Divestiture strategy in the banking industry:
Impact on seller performance
Inês Miranda Silva de Oliveira Viana
Dissertation Proposal
Master in Finance
Supervisor:
Professor Miguel Augusto Gomes Sousa, PhD
i
Biographical Note
Inês Viana was born in Porto, in May 1993.
In 2014 she received her bachelor degree in Management at Faculdade de Economia do Porto. She joined the Master degree in the same year, at the same University. Meanwhile, she did a summer course in International Finance at Nova School of Business and Economics, in 2014.
In September 2015, Inês enrolled in the Corporate Finance department at Millennium Investment Banking.
ii
Acknowledgements
“(…)
Eles não sabem, nem sonham,
que o sonho comanda a vida,
que sempre que um homem sonha
o mundo pula e avança
como bola colorida
entre as mãos de uma criança.”
First of all, I would like to express deepest gratitude to my supervisor, Professor Miguel Sousa, for his understanding and encouragement during this dissertation. Without his full support, I would not be able to do this dissertation. Thank you!
To my Grandmother and my Grandfather, my roots, for the spirit of sacrifice and conquest which they have imbued in our family. I will never be able to express into words how I love you.
To my Mum and Dad, Isilda Viana and Sérgio Viana, for all the love and patient and for always being an example. They were an unconditional support and I would not be able to complete this dissertation without their continuous encouragement.
To my sister, Sofia, and to my brother, Guilherme. You know me better. A Vietnamese proverb says “Brothers and sisters are as close as hands and feet”. We are the same soul.
Finally, I would like to thank to Catarina, Ana, André, Inês and Inês, and for all my friends who were present during this life journey. Thank you so much for your motivation and friendship.
- In Movimento Perpétuo, 1956 António Gedeão
iii
Abstract
This dissertation studies the impact of divestiture operations within the banking industry. While banks play an important role in supporting economic growth, in the past few years one has perceived several changes that led to a new restructuring of the banking industry. Most of the prevailing studies on the topic investigate the wealth effect of bank mergers, with an insufficient focus on divestitures and its impact on the banking industry. The purpose of this analysis is to complement this predominant approach and fill in the existing gap on the prevailing literature. The number of findings covering the subject shows a positive effect on the divesting firms. Our findings suggest that divestiture operations in the banking industry have a different impact in the profitability when compared with divestments in other industries.
Key-words: Banks; divestitures; restructuring JEL-Codes: G21; G34
iv
Sumário
Esta dissertação tem como alvo o estudo do impacto das operações de desinvestimento no sector bancário. O setor bancário tem um papel primordial no apoio ao crescimento económico. Contudo, nos últimos anos esta indústria foi algo de enumeras mudanças que levaram a uma nova reestruturação do setor bancário. A maioria dos estudos que prevalecem sobre este setor estuda o impacto resultante de operações de concentração, com um enfoque insuficiente sobre operações de desinvestimento. O objetivo desta análise é complementar essa abordagem e preencher a lacuna existente na literatura vigente. O número de estudos que cobrem o tema de operações de desinvestimento evidenciam um efeito positivo sobre as empresas. Os resultados alcançados sugerem que a rentabilidade no setor bancário, após operações de desinvestimento, tem uma performance diferente das outras indústrias quando também submetidas a operações de desinvestimento.
iv
Table of Contents
1. Introduction ... 1
2. Literature Review ... 3
2.1 Relevant definitions according to literature ... 3
2.2 Divestment and Performance: Discussion and Evidence ... 4
2.2.1 Event study ... 5
2.2.2 Operational performance effect ... 6
2.3 Determinants of Banking Performance ... 7
3. Methodology and Sample Aspects ... 11
3.1 Methodology Aspects ... 11
3.1.1 Univariate Analysis ... 11
3.1.2 Multivariable Analysis ... 15
3.2 Sample ... 17
3.2.1 The Control Group ... 19
3.3 Descriptive Analysis ... 20
3.3.1 Descriptive Statistics ... 20
3.3.2 Banks‟ Performance before the Operation ... 21
4. Results ... 23 4.1 Univariate Analysis ... 23 4.1.1 Main Variables ... 23 4.1.2 Performance Measures ... 25 4.2 Multivariable Analysis ... 30 4.2.1 Transformation ... 30 4.2.2 Credit Quality ... 31 4.2.3 Specific Risk ... 32 4.2.4 Efficiency ... 34 4.2.5 Profitability... 35
5. Conclusion, Limitations and Future Research ... 37
v
List of Tables
Table 1: Difference-in-difference estimator ... 16
Table 2: Number of deals between 2000 and 2012 ... 18
Table 3: Sample - Number of banks by geography ... 18
Table 4: Financial Statement Main Variables - Comparison between the Two Groups ... 20
Table 5: Banks' Performance - Comparison between the two Groups ... 22
Table 6: Main Variable Change ... 24
Table 7: Loans-to-Deposits Ratio Change ... 25
Table 8: Credit Quality Ratio Change ... 26
Table 9: Banks-Specific Risk Changes ... 27
Table 10: Efficiency Changes ... 28
Table 11: Profitability Changes ... 29
Table 12: The effect of Divestiture Operations on Loans-to-Deposits Ratio ... 31
Table 13: The effect of Divestiture Operations on Credit Quality ratio ... 32
Table 14: The effect of Divestiture Operations on Loan-to-Assets ratio ... 33
Table 15: The effect of Divestiture Operations on Equity-to-Assets ratio ... 34
Table 16: The effect of Divestiture Operations on Scale Efficiency ... 35
Table 17: The effect of Divestiture Operations on ROE ... 36
List of Figures
Figure 1: Evolution of divestiture operations within the banking industry ... 171
1. Introduction
“Watch your thoughts, for they become words. Watch your words, for they become actions. Watch your actions, for they become habits.
Watch your habits, for they become your character. And watch your character, for it becomes your destiny. What we think, we become.”
- Iron Lady, Margaret Thatcher
Banks play a key role in contributing to an economic growth. Maybe the best way to appreciate its importance is by imagining our lives without financial institutions. As Grossman (2010) states in his book, “(…) economy would seem impossible”.
The worldwide financial crisis, with the banking industry in its heart, has led to a significant restructuring of the banking activity. The economic crisis created the collapse of a number of financial institutions and securities markets crashed. As a result, the industry underwent a booming of new mergers with the aim of attaining a higher market power, reduce volatility and scale economies. At this point, the growth of these operations was starting to be seen by the industry as a way out of the financial crisis.
Divestiture operations were another upshot of the recession within this sector. Banks continued to deal with the pressure from difficult funding conditions, transactions to higher costs of capital, changing regulations and tighter capital requirements. Businesses needed to be simplified to be able to compete cost-effectively and obtain higher profits. Therefore, the current trend regarding the restructuring of banks converted into the selling of business lines.
Since the banking industry plays such an important role in our environment, capable of generating economic fluctuations, undergone studies relating to an understanding of how banks are affected by decisions or operations without withstanding other traits that might disturb a bank‟s profitability, are generally highly appreciated. Therefore, this
2
dissertation will be the first attempt to reach a conclusion about the effects of divestiture operations in the banking activity.
The literature on the effect of divestment on a firm‟s profitability is quite limited. However, there is a wide-ranging agreement concerning the positive effects of this type of activity among academy. There are also two main approaches to study these effects: the event study approach, which emphasizes how the market reacts towards divestiture announcements, and the performance effect approach. The latter not only does it examine accounting ratios in order to measure the performance but it also inspects the overall impact of divestiture operations, usually analyzed by the developing of econometric models.
Moreover, it is relevant to mention that most studies that have been completed on the topic did not include financial institutions in their data analysis due to the complexity of financial statement accounts as well as to problems related to a comparison between industries. I will try to overcome the unknown behind this theme, considering those effects on a panel of banks.
In the end, this dissertation should be able to capture and create an efficient model capable of predicting the performance of banks. Here, the operational performance effect of divestiture decisions will be explored.
After this section, the structure of this report will follow the subsequent order: in the next chapter, chapter 2, it will be presented a literature review of the topic. In chapter 3, the methodological aspects of this dissertation will be discussed, as well as the sample used. In chapter 4, the results will be exposed. Finally, in chapter 5, it will be presented the final conclusions of this dissertation.
3
2.
Literature Review
Divestitures in the banking industry are considered as a relatively recent phenomenon. These types of operation tend to upsurge in number during periods of crisis, as throughout these economic downturns, it is critical for any company to readjust itself to a new reality and to focus on the fundamentals of its core business and business values. The literature review is a primary and essential part of this dissertation given that this dissertation will be the first attempt to assess the impact of divestiture operations, in particular, in the banking world. It is pertinent to comprehend what has already been reviewed within the divestitures subject in order to reach a conclusion about the most important steps to be taken in the next sections.
On this chapter, an appraisal of the most important aspects of divestiture business operations will be undertaken. Additionally, the most relevant papers on the area will also be mentioned.
2.1 Relevant definitions according to literature
The term corporate divestiture is defined as the sale of a firm‟s business lines and/or resource portfolio. It is a major strategic decision and, according to Brauer (2006), it can either take the form of a sell-off, a spin-off, an equity carve-out of a line of business either by the sale of major corporate assets or resources.
A sell-off involves the sale of a unit or asset to another firm. In accordance with Brauer (2006) it is the most common type of divestiture manoeuvre.
In its turn, a spin-off is described as the distribution of shares of the divested unit over the firm‟s shareholders through the allocation of a special dividend.
Finally, an equity carve-out designates an open sale of the unit through an initial public offering.
It is necessary to have these basic concepts clearly understood so as to better understand the literature review that follows.
4
2.2 Divestment and Performance: Discussion and Evidence
„But, after all, there is no education like adversity.‟
- Benjamim Disraeli, Endymion
Compared to merger activities, divestments are perceived by the authors as an under-researched topic (Haynes et al., 2002). Nevertheless, there are a considerable number of studies that link divestiture strategies with an intensification of corporate performance.
As reported by Bhagat et al. (1990), Hockisson and Turk (1990) and Shleifer and Vishy (1990, 1991), firms usually adopt a divestiture strategy to attempt to focus more on their core business when they deem themselves as „over-diversified‟ (Markides, 1995), not capable of producing beneficial outcomes with the excess of activities being undertaken. Markides (1995) and Hockisson and Turk (1990) have deducted that, “reduction of diversification, should improve a firm‟s efficiency”. Other aspects were stated in order to justify the divestiture decisions. These include, among others, agency reasons, stock market inefficiencies, tax incentives or changes in the capital markets (Markides, 1995).
The reasons behind a divestiture decision, in the case of banks, might be parallel with the ideas cited above. Nonetheless there are, likewise, other traits to examine due to the specificity of the sector.
In agreement with a recent study prepared by McKinsey1, banks continue to deal with the adversity established since 2007, such as the changing of regulations, the transaction to higher costs of capital, stricter capital requirements or challenging funding conditions. This investigation retains these elements as the main motives for banks to continue to streamline their businesses, with the aim of competing more profitably in fewer market segments. Furthermore, there are a number of explanations revealed by McKinsey to try to elucidate the reasons why divestiture operations are expected to endure: forced restructuring of bailed-out banks by European and national authorities in pursuance of an increase in liquidity and pay-back aids; Government divestitures, as bailouts are under the government‟s control and liquidity needs or the desire to promote competition; pressure to clear a firm‟s balance sheet out of toxic assets and to divest
5
with a view to raise additional capital; and, finally, compression to enhance the returns that are being obtained.
Also, as argued by Burke (1998) based on his analysis of a panel of divestitures favoured by the Federal Reserve between 1985 and 1992, this sort of operation is often practised as an antitrust solution in bank mergers. In fact, it is discernible that during a fusion or alliance of two establishments, arrangements occur. Conversely, the uncertainty behind the regulatory view as to whether or not a merger could constitute an antitrust violation, led more bank regulatory agencies to take harsher measures with the intend of eliminating the haziness involved. Therefore, divestitures were sometimes performed to revise the banks‟ merger proposals so that the structural effects would match the levels specified. Many of the large bank mergers would not have been possible without the meaningful volume of divestitures that took place.
The results of a divestment on a company‟s performance have predominantly been observed and assessed within two distinctive methods: a significant number of studies have been directed towards the „event study‟ approach, which analyses how the market reacts to divestiture announcements. Other authors opted for the tactic that challenges the „ex post effects‟ of divestment operations in corporate performance. Yet, compared to the first approach, the literature of the latter one was often less collared by essayists. The corporate performance of divestiture operations will be the object of study in this dissertation and where it will be given more importance.
Due to the explicitness and importance of these two methods, the most relevant related studies will subsequently be presented.
2.2.1 Event study
The assumptions undertaken by the „event study‟ method comprise the following: (1) the stock market is efficient and therefore change the share price of the divested firms, (2) controlling for movements in the market as well as for the systematic risk, represent the value of the economic impact of the divesting operations.2
2
6
There is a general agreement regarding positive shareholder wealth effects from divestiture announcements.
Markides (1995), in a panel of US data from the 1980s, concluded that „refocusing‟ engenders affluence gains. Likewise, John and Ofek (1995), Montgmory et al. (1983) are in accordance with this inference, believing that divestitures which appear to reduce diversification are associated with abnormal gains.
Alexander et al. (1984), Jain (1985), and Hite et al. (1987) associate divestiture operations with positive abnormal returns for the divesting firms‟ shareholders. Additionally, these authors have also determined that sell-offs suggest favourable information about the investment decisions that lead to share price gains. Hirschey and Zaima (1989) find larger wealth effects for sell-offs by firms with higher insider ownership.
Hite and Vetsuypens (1989), Jain (1985), Afshar et al. (1992) examined the prosperity effects of management buyouts of divisions. These instigators also reported wealth gains for the vendor‟s shareholders.
Borde et al. (1998) swotted the effect of foreign divestitures of overseas‟ subsidiaries by US-based multinational companies, during the period 1994-1995. The outcomes showed favourable announcement period effects. Moreover, the author has come to the conclusion that the results are not as different from domestic divestiture operations as one might have predicted.
Conclusively, one should refer that these studies are more applicable to the short term rather than the long term.
2.2.2 Operational performance effect
The studies related to the operational performance effect regarding divestiture operations are a slanderer stand when compared to the „event study‟ approach. The writers use different measures to evaluate the performance effect. Generally, a divestiture operation is accompanied with an improvement of a firm‟s profitability.
7
In regard of this dissertation, due to the complexity of the financial institutions‟ accounts, the measures applied will differ from those mentioned above.
Markides (1995) and John and Ofek (1995) clinched, from a cross-sectional data for large US firms, that „redeploying‟ divestment improves the operating profitability. Also, Bergh (1995) reported a perfected profitability following a divestiture operation.
Moreover, Bergh (1997) also declared that it is hard to estimate the effectiveness of a divestiture operation in a cross-sectional context, given that it might take up to two years post-divestment until the performance enhancements start showing up.
To avoid inconveniences resulting from cyclical observations, most researchers start by averaging data from several years and only then, begin observing prior divestment as a determinant of the (implicit) long-run equilibrium level of profitability. However, if there are other divestiture operations taking place during the interval of data averaging, they are usually ignored.
Montgomery and Thomas (1988), through the usage of the profitability industry-adjusted ratio, return-on-assets (ROA), detected an upgrading in the performance level. Nonetheless, the results were significantly lower, over the same period of time, when compared to non-divesting companies
Further, Hoskisson and Johnson (1995) revealed in their study that „refocusing‟ would improve the ROA of a business.
2.3 Determinants of Banking Performance
‘Seek neither license, where no laws compel, Nor slavery beneath a tyrant‟s rod;
Where liberty and rule are balanced well Success will follow as the gift of God, Though how He will direct it none can tell.‟
8
Due to the sophistication of the financial institutions‟ accounts, the procedures applied to analyse the performance of a bank are usually different from those used on other institutions. This section aspires to assess what the literature discloses on the most important measures of the banking profitability.
Cover (1999) starts by highlighting that it was never as vital to determine performance measures in the banking world as it is nowadays. “As banks move into the twenty-first century, they must focus more than ever before on creating new streams of revenue in order to increase shareholders‟ value. Crucial to this effort is the need to assess and analyse the profitability of the bank‟s current customers, relationships, services and products. It is only through such analysis that banks can determine which customers to fight for, which customers relationships to expand, and which prospective customers to pursue” (p.78). To be able to reach a final deduction on the consequences of a divestiture operation in the banking sector, it is essential to find the appropriate measures of performance. Consequently, it is mandatory to review the literature on the determinants of banks‟ performance.
Banking performance determinants are divided between internal factors (management decisions and policy objectives) and external factors, which concern aspects that are induced by events outside the influence of the bank. Haslen (1968, 1969) has established a relationship between account ratios and profitability, especially with capital ratios, interest paid and received salaries and wages. He assumed that a divestiture operation would create an impact on these internal factors.
On the other side of banking profitability are, as it was noted, the external factors, which are not subject to specific bank‟s policies and management decisions, but, instead, to events outside the encouragement of the bank. Some of these factors are used isolated as to not have an impact on a bank‟s structure. Therefore, the power of the former on profitability may be clearer.
A substantial number of studies discovered a link between the performance and measures of market structure. In addition, two of the existing and conflicting hypotheses regarding market structure lay on the traditional structure-conduct-performance (SCP) theory and the efficiency-structure (EFS) premise.
On the one hand, in the traditional structure-conduct-performance hypothesis, it is asserted that banks are able to extract monopolistic rents in concentrated markets
9
through their ability to offer lower deposits and charge higher loan rates. It seems that the perspective of higher returns motivates merger waves. Hence, this theory emphasizes market collusion. Lloyd-Williams et al (1994), whom have studied market structure and performance from a Spanish banking sphere, learnt that banks that operate in concentrated markets are able to earn monopoly profits. Notwithstanding that markets that find themselves below the breakpoint of concentration are commonly able to earn competitive or near competitive revenues.
On the other hand, one might find another point of view related to banks‟ performance stressed under the efficient-structure hypothesis. Under this hypothesis, one assumes that a high-quality management leads to lower costs and, as a result, higher profitability. Moreover, it is claimed that a high-quality management firm would lead to higher market share and concentration of the market. Under this approach, the profit-structure relationship is not the direct cause of the higher profitability, which is driven by higher levels of efficiency. Plus, according to this theory, merger movements are motivated by efficiency considerations that would increase total surplus (Berger, 1995).
Some reports also use the scale of regulation in banks as a variable to study the profitability3. Furthermore, the usage of GDP growth as a variable has still not been much discussed in the literature. Yet, a higher growth should imply a lower probability of individual and corporate default and, thus, an easiest access to credit. Revell (1979) noticed that variations in bank profitability might be strongly explained by inflation.
Correspondingly, there are numerous features that can stimulate banks‟ profitability, habitually known as “demand” factors. Oscillations associated to the population and incomes are usually believed to be the most important demand factors (Kaufman, 1965; Yeats, 1974). A sharp downturn in some sectors, such as real state, could dramatically change the profitability of a bank.
***
Banks play an important role in the economic growth and also in our personal lives. Over the past few years, there were numerous changes in the banking industry, due
3
10
especially to the worldwide financial crisis. Until today, there are several doubts about how the financial system will look in the future. It has been a continuous change, and seems like the literature did not follow the new evolution of the banking industry in some aspects. One of those aspects is concerned with divestitures operations, the aim of this dissertation.
To complete the literature review among this topic, it was approached what was been done surrounded divestiture strategies. However, it also seems like divestitures are an under-researched topic. Divestitures in the financial industry are an even more slender strand, since problems related to comparability between industries led to the exclusion of this sector in the studies already existed about divestitures. Therefore, this dissertation will be the first attempt to complete this gap on the literature.
11
3. Methodology and Sample Aspects
“The distinctive function of the banker,” – says Ricardo “begins as soon as he uses the money of others”; as long as he uses his own money he is only a capitalist.
- Walter Bagehot (1924:21)
This section intends to expose the methodology adopted in this dissertation and the sample used. Along it, it is supposed to present the methodological steps which are going to be followed in order to reach the final results, as well as the sample characteristics.
3.1 Methodology Aspects
The main goal of this dissertation is to analyze if the performance of a bank increases after a divestiture operation. In order to do that, this analysis is going to be divided in two different phases: first, it is going to be done an univariate analysis, which is supposed to analyze each of the variables independently, and then a multivariate analysis, exposing the applied econometric model.
3.1.1 Univariate Analysis
With the intention to evaluate the operational performance of banks after divestiture operations occurred between 2000 and 2012, this dissertation is going to execute a univariate analysis as a first attempt to observe the performance evolution of divestiture operations.
In statistical terms a univariate analysis is adopted when only one variable statistical data is study. However, a univariate analysis does not deal with causes or relationships, whereas a multivariable analysis does. The reason why it is going to be performed in this dissertation is to examine how each of determinants of banks performance varies before including them in a multivariable analysis.
The choice of the variables to be used was based on recent studies about the banking sector, considering as well international regulatory framework for banks.
12
The worldwide banking industry is under observation of supervisory tests that central banks imposed on both wholesale and retail banks, according to the Basel Committee.
This Committee does not have any superior authority over the governments and central banks. However, its guidelines are broadly followed and well regarded in the international central banking and finance community. According to their implications, there are a set of dimensions in order to reinforce the comparability and transparency between them, for example: profitability, efficiency credit quality and transformation.
According to Staikouras and Wood (2004), there are also other determinants that can influence banks performance. Those determinants should also be studied in order to understand if a divestiture operation would have an impact on them.
Therefore, and as reported earlier, the literature review on banks performance suggests that the performance is determined by internal and external factors. The underlying economic structure which determines the profitability of the bank indicates that profit is determined simultaneously with overall bank risk and the composition of the bank‟s balance sheet. It should also be including on the analysis variables which capture the influence the risk-return preferences of the bank management, as well as any element of the market, regulatory and organizational structures may have on cost attributes of the assets and liabilities selected by the bank.
Therefore, in this dissertation it is going to be analyzed the following five different dimensions: Transformation; Credit Quality; Banks-specific risk; Efficiency; Profitability.
The transformation will be measure by using the loans-to-deposits ratio, which is in accordance with the Basel Committee, defined as [(Total credit - Provisions and impairment) / Customer deposits]. The transformation ratio measures the relation between loans granted (after impairments deduction) and customers‟ deposits. A negative variation therefore results either from a decrease in loans granted, either by an increase in impairments or either by an increase in customer‟s deposits. A decrease in this ratio is viewed as a positive while a rising transformation ratio is generally not.
13
On the other hand, the credit quality will be measure through the use of the credit quality ratio (Credit in default / Total credit), also in accordance with international regulations.
Banks-specific risk will be measure through the use of the loans-to-assets ratio and the equity-to-assets ratio.
The capital structure of financial institutions is usually very different from the capital structure of other industries. The standard capital structure theories of corporate finance, like Modigliani and Miller (1958), the Tradeoff Theory, the Pecking Order Theory or either the Free cash flow theory cannot be easily applied to this industry, by the reason that the capital structure of this industry is affected by a number of conditions unique to this business, such as government regulation and access to a federal safety net that includes deposit insurance and borrowing through the Federal Reserve discount window.
In this dissertation, the topic of Banks‟ capital structure will not be explored, but it is important to understand how external factor can influence banks‟ capital structure and, subsequently, banks‟ performance. For notice, it is expected an increase in equity amounts during periods of financial crisis. Also, a too high loan-to-assets ratio may be too risky for banks to higher defaults.
The loans-to-assets ratio is a measure of risk by the reason that loans are riskier and also have a greater expected return than other bank assets, like government securities. It is expected a positive relationship between this variable and the performance of a bank, unless if the banks is increasing their loan books and to pay a higher cost for its funding requirements. If this happened, the positive impact may be reduced.
It was also included as a measure of overall capital strength the equity-to-assets ratio, since this variable should capture the general average safety and soundness of the bank. According to Molyneux (1993), as lower an equity-to-assets ratio is, a relatively risky position may be expected in the bank. Therefore, it would also be expected a negative relationship between this ratio and banks profitability. However, in the case of high levels of equity are related to a cheaper cost of capital, this variable may have a positive impact on profitability.
14
Staikouras and Wood (2004) assumes in their article that a higher capital-to-assets ratio is related to lower profitability, as a higher ratio tends to decrease the equity‟s risk and, as so, lowers the equilibrium expected return on equity required by investors. Moreover, a higher equity-to-assets ratio may also be associated with lowers after tax earnings, by reducing the amount on taxes provided by the deductibility of interest payments. Furthermore, the reduced risk from a higher capital ratio may reduce earnings by reducing the value of access to federal deposit insurance that at best imperfectly prices risk.
On the other hand, the efficiency will be measure through the use of the efficiency ratio [(Operating costs-Amortizations) / Operating Income], also in accordance with international regulations. This dimension will be completed with the analysis of the scale efficiency / X-efficiency, (Staikouras and Wood, 2004) which is measured, by simplification reasons, as the Cost Expenditures to Total Assets.
Finally, in terms of profitability, the literature advocates relatively importance to measures like Return-on-Assets (ROA) and the Return-on-Equity (ROE) (Staikouras and Wood, 2004), which is also in accordance with the regulatory implications.
Through the use of the five measures mentioned, it is possible to analyze a bank by different perspectives. Remember that if a divestiture operation succeeds, it is expected that those measures changed, reflecting the improvement.
We complete this analysis calculating the variation of each variable from the average two years before the divestiture to the three years after the operation. The Wilcoxon signed-rank and the t-student tests are going to be used in order to test if the variables changes (mean and median changes) are statistically different from zero. The objective is to test if divestiture operations create impact on the bank‟s performance. The rejection of the null hypothesis by different levels of significance (1%, 5% and 10%) verifies that the measure under consideration creates impact for the bank.
15 3.1.2 Multivariable Analysis
Multivariate data analysis refers to a statistical technique which analyzes data that arises from more than one variable. In this dissertation, it will be analyzed by the developing of an econometric model, which will be exposing in this section.
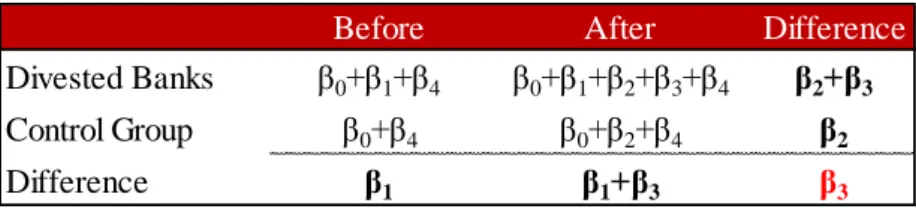
The effect of a divestiture on the performance of a bank is defined as the difference between the bank‟s outcome when divested and the outcome that this bank would have reached if it had not been divested. It results in one question: what would have been the bank‟s performance if it had not been done a divestiture operation? The difference-in-difference (DID) approach is well adapted to dial with this question (Meyer, 1994; Heckman et al., 1997). The idea is to compare the difference in the performance before and after the transaction for divested banks to that in the outcome before and after this operation for a control group. This control group is composed with banks without any divestiture operation. Doing this comparison, it is eliminated the changes in the economic situation that it could be easily (and wrongly) attributed to a divestiture operation, since it is assumed that a change in the economic situation affects all banks in an identical way.
Formally, let be the outcome in period t (after the divestiture operation) for a divested bank i which has been exposed to a divestiture operation, and the outcome for the same bank if it was not subject to a divestiture operation, in the same period t. Therefore, would be the effect of a divestiture operation.
By regression data pooled across the two groups mentioned (divested and non-divested banks), we get the following model:
(1)
The performance of a bank will be determined by the five dimensions already discussed: transformation (loans-to-deposits ratio), credit quality (credit quality ratio), banks-specific risk (loans-to-assets ratio and equity-to-assets ratio), efficiency (scale efficiency) and finally profitability (ROE).
16
Before After Difference
Divested Banks β0+β1+β4 β0+β1+β2+β3+β4 β2+β3 Control Group β0+β4 β0+β2+β4 β2
Difference β1 β1+β3 β3
is a dummy variable taking the value 1 for divested banks and 0 otherwise. It controls for differences in constant performance between divested banks and the control group. The dummy variable was defined as taking the value 1 in the post divested years and 0 otherwise, for both divested and non divested banks. The term is an interaction term between and . Its coefficient represents the DID estimator of the effect of divestiture operation on the group BD (Table 1).
Finally, it was also implemented in the model the variable log(Total Assets), to control for the size of the banks. The inclusion of this variable in the model is justified by the fact that the performance of a bank is also influenced by its dimension, independently of a divestiture operation or not. The log of total assets is used instead of total assets to reduce the scale effect. It controls for cost differences linked to bank size and for the ability of larger banks to diversify and gain economies of scale (Staikouras and Wood, 2004).
In addition, after the estimation of the effects of a divestiture operation in the banking industry, it should be also assessed the impact of divestitures with and without the controlling variables.
Another aspect that remains to explain is how will be selected the control group. If the control group already diverge from divested banks, the DID method will not conduct to valid estimations. This topic will be developed along this chapter.
17 150 200 250 300 350 400 450 2000 2001 2002 2003 2004 2005 2006 2007 2008 2009 2010 2011 2012 3.2 Sample
The data was gathered from Bloomberg database. From this database, it was extracted all banks from North America and Europe in a total of 1,665 banks..
Then, we gathered all divestiture operations within the banking industry that took place between 2000 and 2012, in North America and Europe. A total of 3,516 divestiture operations with 50% or more of shares sold were gathered. These operations involved a total of 1,087 banks. The number of operations by year is presented in Figure 1.
Through its analysis one main feature stands out: In 2010, precisely in the midst of the worldwide financial crisis, the number of divestitures reached its peak with almost 450 divestitures, an increased of 29% in relation to the previous year. This fact is actually in accordance with what was already mentioned in this study: “These types of operation tend to upsurge in number during periods of crisis, as throughout these economic downturns, it is critical for any company to readjust itself to a new reality and to focus on the fundamentals of its core business and business values.”
Source: Bloomberg
Figure 1: Evolution of divestiture operations within the banking industry
18
Table 2 shows the number of banks according to the number of deals they were involved.
The number of banks that were involved in only one divestiture operation was 745, during 2000 and 2012, according to Bloomberg. For the purpose of this dissertation all banks involved in more than one divestitures operations within the period under review – 2 years before the divestiture operation and 3 years after – were removed. For these banks the financial data available needed to assess the bank‟s performance was only available for 58 banks. These 58 banks constitute our final sample of (seller) banks involved in a divestiture operation. The nationality of seller banks is described in Table 3.
Nationality Number of Banks
Austria 1 Croatia 1 Czech 1 Denmark 1 Finland 2 Germany 1 Hungary 1 Norway 3 Poland 1 Russia 1 Spain 2 Switzerland 2 Turkey 1 Ukraine 2 United States 38 TOTAL 58
Number of deals Number of banks
1 deal 745
Between ]1;10] deals 279
Between ]10;50] deals 55
More than 50 deals 8
TOTAL 1087
Source: Bloomberg
Source: Bloomberg
Table 2: Number of deals between 2000 and 2012
19 3.2.1 The Control Group
A control group is defined as a group that is equal to the targeted group, but which does not benefit from any intervention. It is useful by the reason that it can set up if the reported outcomes of an intervention/operation can indeed be established from that intervention or operation and not to external factors. As so, without a control group the potential impact may be misreported. By this reason, the control group treatment will be essential to this dissertation, since the idea is to compare the difference in the performance before and after the transaction for divested banks to that in the outcome before and after this operation for a control group. The main idea which is subject in the application of this philosophy is: “If there was not any divestiture operation, the group of divested banks would have the same performance that the banks with no divestiture operation actually had”. As so, the control group will be composed by non-divested banks.
In order to conduct to valid estimations, the control group of this dissertation must be similar to the group with divested banks. If that was not the case, it would not be able to accomplish reliable results. As so, first of all, it is assumed that banks with similar size would have the same expected future performance. As a measure of a bank‟s size, it will be analyzed the total assets and the return-on-equity (ROE) of each bank.
By applying this methodology, it was extracted from the Bloomberg platform a total of 138 banks without any divesture operation within the period between 2000 and 2012. In a second stage, for each bank included in the divestment group, it were chosen all non-divested banks with a in total asset between -50% and 50% in relation to the total assets of the divested bank, one year before the divestiture operation.
At this stage, for each of the non-divested bank included in the range [-50%; 50%] of the total assets of a divested bank, it was chosen the non-divested bank with nearest ROE ratio. In the case of divested banks with negative ROE, it was only analyzed the total assets of non-divested bank and it was chosen the bank with the nearest amount in terms of total assets.
Using this criterion, 58 non-divested banks were chosen as a control group of this dissertation. These 58 non-divested banks together with the 58 banks (seller) banks
20
involved in a divestiture operation comprise our final sample – composed with 116 banks on total.
3.3 Descriptive Analysis
After establishing the sample which is going to be used in this dissertation, it is also important to have a good understanding of the main characteristics of both Groups, also in order to verify if they fit each other. Therefore, in this subsector both Groups are going to be analyzed for the period before the divestiture operation.
This analysis is going to be divided between two parts: (1) Analysis of the financial statements‟ main variables and (2) Analysis of the dimensions of banks‟ performance.
3.3.1 Descriptive Statistics
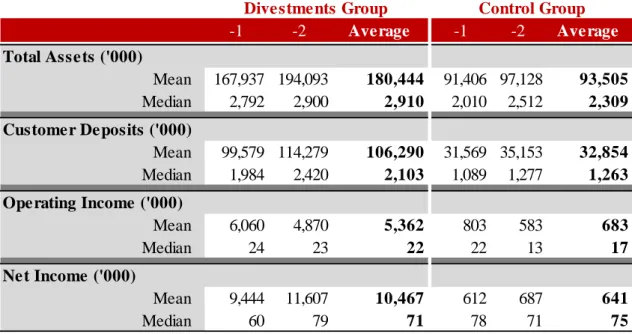
Table 4 displays the differences between the Divestment Group and the Control Group for the main variables of financial statement in the banking industry, for the two periods before the operation and the average of the two periods.
-1 -2 Average -1 -2 Average Total Assets ('000) Mean 167,937 194,093 180,444 91,406 97,128 93,505 Median 2,792 2,900 2,910 2,010 2,512 2,309 Customer Deposits ('000) Mean 99,579 114,279 106,290 31,569 35,153 32,854 Median 1,984 2,420 2,103 1,089 1,277 1,263 Operating Income ('000) Mean 6,060 4,870 5,362 803 583 683 Median 24 23 22 22 13 17 Net Income ('000) Mean 9,444 11,607 10,467 612 687 641 Median 60 79 71 78 71 75
Divestments Group Control Group Table 4: Financial Statement Main Variables - Comparison between the Two Groups
21
From the analysis of Table 4 two main features come out. First, the sample of this dissertation comprises banks from a wide range of sizes. This fact can be concluded by the discrepancy between the mean and the median results in some of the variables, also indicating the presence of outliers. Therefore, this dissertation will focus on the median results analysis.
Second, if it is assumed that both Groups are equal in the period before the divestiture operation, it would be expected that the difference between them, during the period before the operation, would be zero. In a perfect situation, this would be the effect. However, as shown the difference between the two groups is basically on average size measures, as the median values are similar in both Groups. Also, should be noted that these variables were tested and are not statistically significant before the divestiture operations. However, take this into account we are going to control for bank size in the multivariate analysis as explained previously.
Starting with the analysis of the results, in terms of total assets, the divestment group was, in median, 10.6% higher than the control group in the average two years before the divestment operation. The amount of customer deposits was, in median, 16% higher in the divestment group when compared with the control group.
The median operating income in the control group was, in the period before the operation, 32% higher than in the divestments group while the net income performed was higher in 10% than in the divestments group.
3.3.2 Banks’ Performance before the Operation
Concerning the banks‟ performance, no significant differences were detected between the two groups in the period before the divestment operation, as shown in Table 5.
22 All the differences are not statistically significant.
-1 -2 Average -1 -2 Average -1 -2 Average
Panel A: Transformation
Loans-to-Deposits Ratio
Mean 1.18 1.10 1.15 0.92 0.94 0.94 0.26 0.20 0.23
Median 0.91 0.92 0.90 0.88 0.89 0.89 0.02 0.03 0.02
Panel B: Credit Quality
Credit Quality Ratio
Mean 3.0% 4.1% 3.6% 2.1% 2.3% 2.1% 1.70 3.26 2.32
Median 1.9% 1.9% 2.3% 1.5% 1.4% 1.6% 0.83 0.61 0.78
Panel C: Specific Risk
Loans-to-Assets Ratio Mean 69.5% 68.9% 69.2% 63.9% 64.9% 64.9% 5.06 3.48 3.68 Median 70.7% 68.1% 69.1% 63.8% 67.2% 67.8% 5.59 0.50 1.95 Equity-to-Assets Ratio Mean 7.7% 8.0% 8.0% 9.2% 8.7% 9.1% -1.54 -0.76 -1.1 Median 7.8% 7.7% 7.9% 8.4% 8.4% 8.4% -0.64 -0.66 -0.52 Panel D: Efficiency Efficiency Ratio Mean -3.48 4.89 1.05 2.66 0.16 1.47 -4.22 5.24 0.61 Median 1.49 1.24 1.43 1.95 2.09 2.08 -0.20 -0.46 -0.43 Scale Efficiency Mean 1.5% 2.0% 1.8% 4.5% 5.2% 4.8% 0.26 0.34 0.35 Scale Efficiency 2.7% 2.7% 2.7% 2.8% 2.7% 2.7% 0.09 0.2 0.08 Panel E: Profitability ROA Mean 3.5% 3.3% 3.3% 3.8% 3.6% 3.7% -0.03 -0.07 -0.01 Median 3.3% 3.4% 3.3% 3.5% 3.7% 3.6% -0.54 -0.56 -0.46 ROE Mean 42.9% 50.8% 46.6% 42.3% 42.0% 42.0% 7.73 4.16 6.01 Median 45.7% 44.1% 43.4% 38.4% 40.2% 40.7% 4.49 2.44 1.63 % % p.p. x x x % % p.p. x x x % % p.p. % % p.p. % % p.p.
Divestments Group Control Group Difference
x x x
23
4. Results
In this chapter it will be presented the results obtained by applying the methodology of this dissertation in order to answer the dissertation main question: Does the banks‟ performance increase after a divestiture operation or not?
4.1 Univariate Analysis
In the univariate analysis more importance will be given to the median results, in order to exclude the effects of outliers.
The raw and adjusted growth, from the period before the operation (two years average) to the three years after, will be analyzed. Adjusted growth will be calculated by subtracting the growth of the control bank to the growth of the divestments bank. Using this methodology, the macroeconomic impacts are removed as it is assumed that those impacts will influence the results of both groups equally.
4.1.1 Main Variables
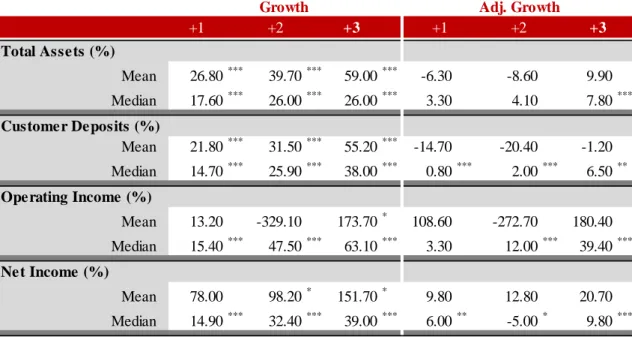
Concerning the main variables, it is possible to observe in Table 6 that in spite of the divestiture operation, the total assets of the divestment banks increases in the three years after the operation. The growth rates are all statistically significant. However, when adjusted by the control group‟s growth, the growth continuous to be positive but only significant in the third year after the divestiture operation. This suggest that the asset growth is, at least partially, explain by the sector growth during the same period.
24
Apparently, these results seem to be contradictory, since it would be expected that, after a divestiture operation, the total assets of any entity (banks or not) would decrease. This fact may be related to one of the reasons mentioned by McKinsey, present in the literature review of this dissertation, which highlights that, after the 2007 worldwide financial crises, banks feel the pressure to clear their balance sheet out of toxic assets and to divest with a view to raise additional capital.The additional capital raise and also the continuous improvement of the banking activity may be enough to overcome the divestiture operation and the underlying decrease on total assets.
Regarding customer deposits results, it is also possible to verify a positive and significant growth in all years after the divestiture operation. When adjusted by the control group‟s growth, this growth is also positive and significant. Apparently, the amount in customer deposits in banks with divestiture operations increase after the divestiture operation.
The same conclusions can be observed in the growth of the operating income, although the adjusted growth of the divestments group is only positively significant in the second and third years after the divestiture operation.
+1 +2 +3 Total Assets (%) Mean 26.80*** 39.70*** 59.00*** -6.30 -8.60 9.90 Median 17.60*** 26.00*** 26.00*** 3.30 4.10 7.80*** Customer Deposits (%) Mean 21.80*** 31.50*** 55.20*** -14.70 -20.40 -1.20 Median 14.70*** 25.90*** 38.00*** 0.80*** 2.00*** 6.50** Operating Income (%) Mean 13.20 -329.10 173.70* 108.60 -272.70 180.40 Median 15.40*** 47.50*** 63.10*** 3.30 12.00*** 39.40*** Net Income (%) Mean 78.00 98.20* 151.70* 9.80 12.80 20.70 Median 14.90*** 32.40*** 39.00*** 6.00** -5.00* 9.80*** Growth +1 +2 +3
*, **, *** statistically different from 0 for a sifnificance level of 10% 5% and 1%, respectively.
Adj. Growth Table 6: Main Variable Change
25
Finally, it is also possible to observe that the net income has a positive and significant growth. However, in the second year after the divestiture operations, this field performed a negative and significant growth when compared with the growth of the control group. This negative performance is overcome in the following year.
More generally, apparently divestiture operations have a positive effect in the main variables of banks financial statements.
4.1.2 Performance Measures
After analyzing the performance of banks‟ main variables, we will now proceed to the analysis of performance measures.
Transformation
Table 7 displays the change (raw and adjusted) of this ratio. As it can be observed, all the median variations are negative and statistically significant (for a significance level of 1% and 5%), thus suggesting an improvement of this ratio after the divestiture operation. However, when adjusted for the change in the control group, although still negative, this variable is not anymore statistically different from zero, which can therefore be concluded that there are no evident of differences between the two Groups, i.e., the improvement on the ratio is mainly due to factors that affected all banks and not necessarily due to divestments operation.
+1 +2 +3 +1 +2 +3
Loans-to-Deposits Ratio (x)
Mean -9.50 -7.83 -9.92 -11.87 -12.14 -15.10
Median -4.49*** -2.34*** -0.98** -1.71 -0.72 -9.18
x x
Growth Adj. Growth
*, **, *** statistically different from 0 for a significance level of 10% 5% and 1%, respectively.
26 Credit Quality
Table 8 displays the change of the credit quality ratio after the divestments operations.
As it can be observed, the median change is negative in the first year after the divestment operations but then improve during the second and third year after the operation. All changes are statistically significant. The behave is the same even after controlling for the control group change.
Thus, these results suggest that divestiture operation in the banking industry increase the credit quality of banks. A detailed analysis will be explored through the multivariable analysis.
Specific Risk
Banks-specific risk is divided through the analysis of two ratios related to Banks‟ capital structure: loans-to-assets ratio and equity-to-assets ratio. The changes in these ratios are presented in Table 9.
Starting with the loans-to-assets ratio analysis, it can be observed that the (median) change of this ratio is negative and statistically significant in the first year after the divestiture operation. The results is similar when adjusted for the change in the control group. Thus, it suggests that divestiture operations decrease the loans-to-assets ratios of divestment banks.
+1 +2 +3 +1 +2 +3
Credit Quality (p.p.)
Mean 0.63 0.57 1.11 1.22 2.21 3.03*
Median -0.12*** 0.00** 0.08*** 0.0%0.39*** 1.08*** 1.53***
Growth Adj. Growth
*, **, *** statistically different from 0 for a significance level of 10% 5% and 1%, respectively.
27
On the contrary, in the second year the change is positive and statistically significant. However, when adjusted for the change in the control group, the variation is not anymore statistically significant. In the third year after the operation, the change is again negative and when adjusted for the change in the control group, statistically significant, thus suggesting a decrease in this ratio three years after the divestiture operation (although not so severe as the first year).
Regarding the equity-to-assets ratio, it is possible to see a positive and statistically significant (median) change in all three years after the divestiture operation. When adjusted for the control group change, the change is still positive, but only statistically significant in the first and second year after the divestiture operation. Therefore, the results suggest that although the divestiture operation increases the equity-to-assets ratio faster than the banks that have not divest, a similar increase is achieved by those banks after three years.
Overall, considering both ratios, the results suggest that after divestiture operations banks took a more risk averse position. This may be due to stricter capital requirement, which is also one of the motives for divestitures operations in the banking industry mentioned by McKinsey.
Efficiency
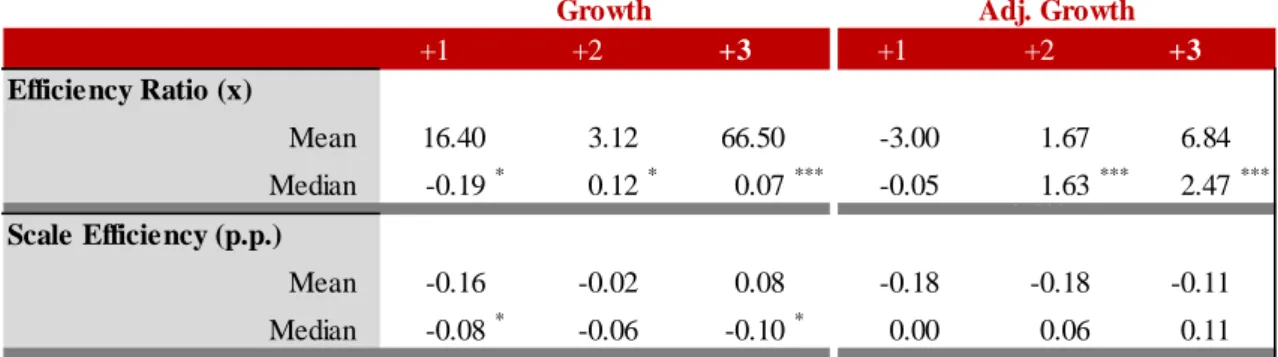
Table 10 displays the change in the efficiency ratio and scale efficiency. Table 9: Banks-Specific Risk Changes
+1 +2 +3 +1 +2 +3 Loans-to-Assets Ratio (p.p.) Mean -1.61 1.97 0.74 -0.92 2.92 1.64 Median -1.71*** 0.28** -0.39 -1.15** -0.67 -0.59** Equity-to-Assets Ratio (p.p.) Mean 0.52 0.81 1.37*** 1.15 0.71 0.20 Median 0.65*** 0.73*** 1.13*** 0.86*** 0.66*** 0.91 *, **, *** statistically different from 0 for a significance level of 10% 5% and 1%, respectively.
28
Regarding the efficiency ratio, the median change is negative (and statistically significant) in the first year after the divestiture operation but it turns positive (and statistically significant) in the second and third year after the operation. . When adjusted for the change in the control group, the positive change in the second and third year after the operation is still statistically significant.
Should be noted that this ratio is a measure of how effective a bank is in using overhead expenses in generating income. Other things being equal, a decrease in the efficiency ratio is viewed as a positive while a rising efficiency ratio is generally undesirable. Therefore, these results indicate an apparently poor performance for banks with divestiture operations.
On the other hand, the scale efficiency measures how effective a bank is in using overhead expenses in its global structure. By analyzing the results of this ratio, this ratio presented a negative change in all three years after the divestment operation, although only statistically significant in the first and third years. When adjusted for the change in the control group none of the results is statistically significant, which can therefore be concluded that there are no evident differences between both groups of banks.
+1 +2 +3 +1 +2 +3 Efficiency Ratio (x) Mean 16.40 3.12 66.50 -3.00 1.67 6.84 Median -0.19* 0.12* 0.07*** -0.05 0.0%1.63*** 2.47*** Scale Efficiency (p.p.) Mean -0.16 -0.02 0.08 -0.18 -0.18 -0.11 Median -0.08* -0.06 -0.10* 0.00 0.06 0.11
*, **, *** statistically different from 0 for a significance level of 10% 5% and 1%, respectively.
Growth Adj. Growth
29 Profitability
Finally, the profitability of divestment banks was also analysed through the change of the return-on-assets (ROA) and return-on-equity (ROE). The results are presented in Table 11.
Starting with the analysis of the ROA ratio, it is possible to observe that the median change is only statistically significant (and positive) in the second year after the divestiture operation. However, when adjusted for the control group change, the median change of this ratio is always positive and statistically significant, thus suggesting that divestiture operations increase bank‟s return-on-assets when compared with banks that have not divest. These results are in accordance with Montgomery and Thomas (1988) and Hoskisson and Johnson (1995), suggesting that divestiture operations and „refocusing‟ would improve the ROA of those firms.
Concerning the variation of ROE, it is observed a negative and statistically significant change during all three years after the divestment operation. This negative change persist in the first and third year after the operation even when controlled for the control group change. Therefore, apparently divestiture operations negatively affect banks‟ return on equity. +1 +2 +3 +1 +2 +3 ROA (p.p) Mean 0.09 0.24 0.24 0.24 0.44 0.18 Median -0.13 0.03*** 0.07 0.26*** 0.36*** 0.21*** ROE (p.p.) Mean -4.07 -5.75 -7.05* -3.11 -7.73 -12.72 Median -5.01*** -2.42*** -3.50*** -4.06*** 2.34 -1.18*** *, **, *** statistically different from 0 for a sifnificance level of 10% 5% and 1%, respectively.
Variation Adj. Variation
30
4.2 Multivariable Analysis
Besides the univariate analysis, the effects of divestitures operations in the banking industry were estimated performing the Ordinary Least Squares (OLS) method with robust standard errors. Those effects were estimated given the five dimensions under discussion.
As explained in the previous chapter, DivBank is a dummy variable taking the value 1 for divested banks and 0 otherwise, and After, also a dummy variable, takes the value 1 in the post-divestiture years and 0 otherwise.
The model was estimated for at least one variable of each dimension considered in this study (for simplification reasons). In each variable, the model was first estimated considering the three years after the divestiture operation as a whole, i.e., just comparing the period after the operation with the period before (columns 1 to 4) and then considering each year after the divestiture individually (columns 5 to 8).
The model was also estimated with and without the controlling variable log(Total Assets) to verify the robustness of the conclusions.
4.2.1 Transformation
Table 12 displays the impact of divestiture operations in the loans-to-deposits ratio. The variable DivBank*After (model 3 and 4) represents the effect of divestiture operations on the transformation level of the bank. According to the model, the impact is negative although no statistically significant in all regressions. It suggests that there is no significant effect in terms of transformation level of the bank with divestiture operations.
In models 5 to 8, the variable After and the interactive dummy DivBank*After were replaced by different dummy variables for each year after the divestment operation: After1, After2 and After3 in the case of the After variable and DivBank*After1, DivBank*After2 and DivBank*After3, in the case of DivBank*After variable. All coefficients associated to these dummy variables are not statistically significant.
31
Therefore, it appears that there is no effect in terms of banks‟ transformation level with divestiture operations. These results are in accordance with the univariate analysis.
4.2.2 Credit Quality
Table 13 displays the effects of divestiture operations in the credit quality ratio.
Once again, the coefficient associated to the variable DivBank*After, that represents the effect of divestiture operation, is negative, but not statistically significant, which suggests that the credit quality did not change after the divestment operation.
The results are similar when dummy year variables are included which suggest that the divestiture operations do not significantly change the performance of credit quality.
These results are not in accordance with the univariate analysis. Since the multivariable analysis gives a much richer and realistic picture than looking at a single variable and also provides a powerful test of significance compared to univariate techniques, we believe that these results are more in accordance with the reality. Therefore, the results suggest that divestiture operations do not affect the credit quality of banks.
Variables (1) (2) (3) (4) (5) (6) (7) (8) DivBank 0.180 * 0.218 0.231 * 0.179 * 0.218 0.231 * (0.094) (0.179) (0.120) (0.095) (0.180) (0.121) After 0.015 0.016 0.046 0.023 (0.105) (0.104) (0.159) (0.106) After1 0.001 0.003 0.082 0.067 (0.126) (0.126) (0.191) (0.127) After2 0.000 0.002 0.040 0.020 (0.127) (0.126) (0.191) (0.128) After3 0.062 0.058 -0.006 -0.050 (0.144) (0.143) (0.223) (0.149) DivBank*After -0.053 -0.193 (0.211) (0.142) DivBank*After1 -0.141 -0.231 (0.255) (0.172) DivBank*Timing2 -0.068 -0.133 (0.256) (0.174) DivBank*Timing3 0.106 -0.223 (0.292) (0.201) Log(Total Assets) 0.033 ** 0.034 *** (0.013) (0.013) Constant 1.022 *** 0.920 *** 0.898 *** 0.640 *** 1.022 *** 0.920 *** 0.898 *** 0.630 *** (0.089) (0.103) (0.135) (0.137) (0.089) (0.104) (0.135) (0.138) Number of observations 339 339 339 339 339 339 339 339 R-squared 0.01% 1.08% 1.10% 3.58% 0.07% 1.13% 1.37% 4.18%
*, **, *** statistically different from 0 for a significance level of 10% 5% and 1%, respectively.
32 4.2.3 Specific Risk
The change on the specific risk of the banks is going to be analyzed using both loans-to-assets and equity-loans-to-assets ratios as they complement each other. Table 14 displays the effects of divestiture operations in terms of loans-to-assets ratio.
The coefficient associated to the variable DivBank*After is again negative but not statistically significant. However when replacing this variable by three different dummy variables, for each year after the divestiture operation, it is possible to verify that divestiture operations has a negative and statistically significantly impact in the first year after the operation (model 8), for a significance level of 10% (also in accordance with the univariate analysis). According to Berger (1995), a decrease in the loans-to-assets ratio is directly related with a decrease in banks‟ profitability.
Variables (1) (2) (3) (4) (5) (6) (7) (8) DivBank 0.001 0.011 0.009 0.003 0.011 0.009 (0.006) (0.012) (0.012) (0.006) (0.012) (0.012) After 0.001 0.001 0.008 0.007 (0.007) (0.007) (0.012) (0.011) After1 0.007 0.007 0.012 0.012 (0.008) (0.008) (0.012) (0.013) After2 0.005 0.005 0.012 0.012 (0.008) (0.008) (0.012) (0.013) After3 -0.020 -0.020 -0.013 -0.014 (0.009) (0.009) (0.016) (0.016) DivBank*After -0.011 -0.009 (0.014) (0.014) DivBank*After1 -0.009 -0.070 (0.016) (0.016) DivBank*Timing2 -0.012 -0.010 (0.016) (0.016) DivBank*Timing3 -0.011 -0.009 (0.020) (0.021) Log(Total Assets) 0.000 0.000 (0.001) (0.001) Constant 0.028 *** 0.027 *** 0.022 ** 0.019 0.028 *** 0.027 *** 0.022 ** 0.018 (0.006) (0.007) (0.009) (0.014) (0.006) (0.007) (0.009) (0.013) Number of observations 217 217 217 217 217 217 217 217 R-squared 0.01% 0.12% 0.43% 0.38% 4.30% 4.42% 4.75% 4.41%
Table 13: The effect of Divestiture Operations on Credit Quality ratio