https://doi.org/10.1007/s00408-018-0190-y
SLEEP
Fractional Exhaled Nitric Oxide Measurements and Screening
of Obstructive Sleep Apnea in a Sleep-Laboratory Setting:
A Cross-Sectional Study
Ricardo L. M. Duarte1,2 · Marcelo F. Rabahi3 · Tiago S. Oliveira‑e‑Sá4,5 · Flavio J. Magalhães‑da‑Silveira1 ·
Fernanda C. Q. Mello2 · David Gozal6
Received: 16 October 2018 / Accepted: 16 December 2018 / Published online: 2 January 2019 © Springer Science+Business Media, LLC, part of Springer Nature 2019
Abstract
Purpose Obstructive sleep apnea (OSA) is a common condition characterized by repetitive collapse of the upper airways
and intermittent oxygen desaturation, which may lead to airway inflammation. Here, we explored whether fractional exhaled nitric oxide (FeNO) levels provide a non-invasive screening tool of OSA.
Methods Over a 3-month period, FeNO levels were measured in consecutive non-smoking patients referred for a sleep laboratory. All patients underwent full polysomnography. OSA severity was classified based on the apnea/hypopnea index: ≥ 5.0/h as any OSA, ≥ 15.0/h as moderate/severe OSA, and ≥ 30.0/h as severe OSA. FeNO was measured by a portable device (NIOX-MINO®; Aerocrine AB, Solna, Sweden) and expressed as parts per billion (ppb). Discrimination by area under the curve (AUC) and binary logistic regression were performed.
Results A total of 229 subjects were evaluated. Mean FeNO values were similar among subjects without OSA or with OSA:
16.9 ± 10.6 ppb versus 20.2 ± 14.5 ppb, p = 0.221; respectively. FeNO was not an inclusionary parameter to predict any OSA, moderate/severe OSA, and severe OSA: odds ratio (OR) 1.023 (95% confidence interval [CI]: 0.986–1.062); OR 1.012 (95% CI: 0.991–1.034); and OR 0.999 (95% CI: 0.980–1.018), respectively. The AUC values for FeNO in the diagnosis of any OSA, moderate/severe OSA, and severe OSA showed no discriminatory properties: AUC: 0.567 (95% CI: 0.464–0.670), AUC: 0.541 (95% CI: 0.465–0.618), and AUC: 0.535 (95% CI: 0.459–0.610); respectively.
Conclusions In a sleep-lab setting, our findings suggest that FeNO measurements are inconsequential in the screening of OSA in adults.
Keywords Obstructive sleep apnea · Polysomnography · Fractional exhaled nitric oxide · Screening · Diagnosis
Introduction
Obstructive sleep apnea (OSA) is a highly prevalent disor-der characterized by recurrent upper airway obstructive epi-sodes, resulting in intermittent hypoxemia and arousals. The estimated prevalence of moderate-to-severe sleep-disordered breathing (SDB) ranges from 10 to 17% among men and from 3 to 9% among women [1], likely reflecting the increase in obesity rates and aging of the population [2, 3]. In certain risk groups, such as patients undergoing pre-operative evalu-ation for bariatric surgery [4] or resistant hypertension [5], the prevalence can reach more than 70%. In patients with OSA, the recurrent snoring and associated local mechanical trauma to the airway along with the recurrent upper airway collapse and intermittent hypoxia-re-oxygenation episodes
* Ricardo L. M. Duarte [email protected]
1 Sleep – Laboratório de Estudo dos Distúrbios do Sono,
Centro Médico BarraShopping, Avenida das Américas 4666, sala 309, Barra da Tijuca, Rio de Janeiro 22649-900, Brazil
2 Instituto de Doenças do Tórax – Universidade Federal do Rio
de Janeiro, Rio de Janeiro, Brazil
3 Faculdade de Medicina, Universidade Federal de Goiás,
Goiânia, Goiás, Brazil
4 Hospital de Santa Marta – Centro Hospitalar Lisboa Central,
Lisbon, Portugal
5 NOVA Medical School – Faculdade de Ciências Médicas,
Universidade Nova de Lisboa, Lisbon, Portugal
6 Department of Child Health, University of Missouri School
lead to release of inflammatory mediators, leading to both local upper airway and systemic inflammation [6].
Fractional exhaled nitric oxide (FeNO) can be easily, rap-idly, and non-invasively measured for assessment of airway inflammation, and is extensively used in asthma to evalu-ate both severity and therapeutic responses [7–9]. However, FeNO levels in OSA patients remain somewhat unclear [10]:
both elevated FeNO [11–15] and unaltered FeNO levels
[16–19] have been reported when comparing OSA patients to controls. A recent meta-analysis [10] addressed FeNO lev-els in patients with OSA and concluded that there was a sig-nificant increase in FeNO levels in subjects diagnosed with OSA. Moreover, FeNO levels were significantly increased upon waking up in patients with OSA, but such pattern was not present in non-OSA groups. In addition, long-term continuous positive airway pressure (CPAP) significantly lowered FeNO levels in OSA patients. Notwithstanding the conclusions of the meta-analysis, some limitations are wor-thy of mention: (i) the available literature contains studies with a relatively small sample size; (ii) different techniques and instruments were used for FeNO measurements; (iii) substantial heterogeneity was present across the cohorts that were evaluated; and (iv) insufficient information regarding confounding factors, such as snoring or timing of FeNO measurement [10].
Here, we hypothesized that FeNO value is useful in the screening of OSA. Our major objectives in the context of FeNO measurements were (i) to verify if FeNO levels dis-criminate between patients with and without OSA and (ii) to evaluate whether FeNO levels can be used as a screening tool in patients with suspected OSA.
Methods
This cross-sectional study evaluated consecutive patients enrolled between January 2017 and March 2017, who were referred by their respective attending physicians. All studies were conducted in a single Brazilian center: Sleep
Labora-tory at Centro Medico BarraShopping, Rio de Janeiro.
Inclu-sion criteria were subjects of both genders, aged ≥ 18 years with suspected SDB. Patients were excluded for any of the following reasons: current smokers, inhaled and/or systemic corticosteroids use, self-reported information of atopy or respiratory disease that might affect FeNO measurements (allergic rhinitis, asthma, and chronic obstructive pulmo-nary disease [COPD]), current respiratory tract infection, previously diagnosed OSA, and insufficient sleep or techni-cally inadequate polysomnography (PSG). The study was approved by the Ethics Committee of the Federal Univer-sity of Rio de Janeiro, Brazil (#1.764.165) and it was devel-oped in accordance with the ethical standards laid down in
the Declaration of Helsinki. All participants gave written informed consent prior any study procedure.
Patient characteristics included gender, race, age, body mass index (BMI), neck circumference (NC), and self-reported comorbidities (diabetes mellitus and hypertension). Patients were measured for weight and height, and BMI was calculated by dividing the weight in kilograms by the square of the height in meters (kg/m2), while NC was
systemati-cally measured, in centimeters, with a tape measure. All patients enrolled had complete data regarding the filling of two validated models: the Epworth Sleepiness Scale (ESS) [20] and the No-Apnea [21]. The ESS [20] is a questionnaire with eight questions related to the chance of dozing in daily situations, being its final score ranging from 0 to 24 points. Individuals with scores > 10 points are classified as having excessive daytime sleepiness [20]. The No-Apnea [21] is a newly developed and validated model, consisting of only two objective and easily measurable parameters: NC scored from 0 to 6 points and age scored from 0 to 3 points (final score ranging from 0 to 9 points). Subjects with scores ≥ 3 points are classified as high risk for OSA diagnosis [21].
FeNO Measurements
The measurements of FeNO were performed according to the recommendations proposed by the American Thoracic Society [7], always in the morning and immediately after the PSG, under the direction of an experienced technician. FeNO was measured by a portable device (NIOX-MINO®; Aerocrine AB, Solna, Sweden) and expressed as parts per billion (ppb). They were seated without a nose clip, inhaled to total lung capacity, and then exhaled at a constant flow rate of 50 mL/s as guided by an eye-level indicator for approximately 10 s. Two successive FeNO measurements were obtained and their mean values were recorded for analysis.
Sleep Test
All patients underwent an attended, in-laboratory PSG (EMBLA® S7000, Embla Systems, Inc., Broomfield, CO, USA), consisting of continuous monitoring of electroen-cephalography, electrooculography, electromyography (chin and legs), electrocardiography, oronasal airflow, thoracic and abdominal belts, pulse oximetry to measure oxygen saturation (SpO2), snoring microphone, and body position sensor. The scoring was performed manually and was inter-preted by two board-certified sleep physicians in accordance with previous guidelines [22], being that both physicians were blinded to the FeNO values. Data from PSG included total sleep time, sleep efficiency, sleep stages, rapid eye movement and sleep latencies, arousal index, apnea/hypo-pnea index (AHI), SpO2 values (awake, mean, nadir, and
cumulative time with SpO2 < 90%), and oxygen desaturation index (ODI) with a threshold of 3%. Apneas were classified with a drop ≥ 90% of baseline in airflow lasting at least 10 s [22]. Hypopneas were classified with a drop ≥ 30% of pre-event during ≥ 10 s associated with ≥ 3% oxygen desatura-tion or an arousal [22]. Diagnosis of OSA was based on an AHI ≥ 5.0/h, being its severity classified based on the AHI thresholds: ≥ 5.0/h as any OSA, ≥ 15.0/h as moderate/severe OSA, and ≥ 30.0/h as severe OSA.
Statistical Analysis
Data analysis was conducted using a statistical software package (SPSS, version 21.0; Chicago, IL, USA). Results are presented as mean ± standard deviation for continuous variables and as number and percentage for categorical vari-ables. Comparisons between groups were performed using the Chi-square test for dichotomous variables, Student’s t test, and univariate analysis of variance (ANOVA) for con-tinuous variables. Correlation was evaluated by Spearman rank correlation coefficient (r). At three AHI thresholds (5.0/h, 15.0/h, and 30.0/h), the predictive performance of FeNO was assessed by logistic regression tests and receiver operating characteristic (ROC) curves with area under the curve (AUC). An AUC > 0.7 was considered as clinically significant discrimination. Both AUC and odds ratio (OR) were reported with their respective 95% confidence intervals (CI).
Results
Of a total of 272 consecutive subjects referred for diagnos-tic PSG, 43 patients (15.8%) were subsequently excluded: 31 patients were using corticosteroids and/or had known respiratory disease and 12 patients were current smokers. Thus, a total of 229 adult patients—including 162 males (70.7%) and 67 females (29.3%)—were considered eligi-ble for further analyses. No PSG needed to be repeated. Baseline and polysomnographic characteristics are shown in Table 1. Mean age was 43.7 ± 12.6 years, mean BMI was
31.1 ± 6.5 kg/m2, and mean NC was 40.6 ± 4.5 cm.
Hyper-tension and diabetes mellitus were present in 32.8% and 14.0% of the patients, respectively. As anticipated from the study design and recruitment of a referral cohort to a sleep-laboratory setting, we found a high frequency of any OSA (86.9%), moderate/severe OSA (62.4%), and severe OSA (39.7%). As expected, patients with diagnosis of any OSA, moderate/severe OSA, and severe OSA had a male predomi-nance (73.9%, 76.2%, and 83.5%; respectively). There were no gender differences in FeNO values: 18.1 ± 14.1 ppb in females versus 20.5 ± 14.0 ppb in males; p = 0.234.
Mean ESS was 9.4 ± 4.5 points, being that 38.9% of the patients were sleepy. We observed a poor discrimination of ESS in predicting any OSA, moderate/severe OSA, and severe OSA: AUC: 0.537 (95% CI: 0.405–0.669; p = 0.517), AUC: 0.529 (95% CI: 0.451–0.606; p = 0.466), and AUC: 0.565 (95% CI: 0.490–0.640; p = 0.097); respectively. Con-versely, No-Apnea model showed to be a useful tool for screening of any OSA, moderate/severe OSA and severe OSA: AUC: 0.786 (95% CI: 0.696–0.877; p < 0.001), AUC: 0.713 (95% CI: 0.644–0.782; p < 0.001), and AUC: 0.717 (95% CI: 0.650–0.784; p < 0.001); respectively.
Correlation
Table 2 shows the correlation between FeNO and some
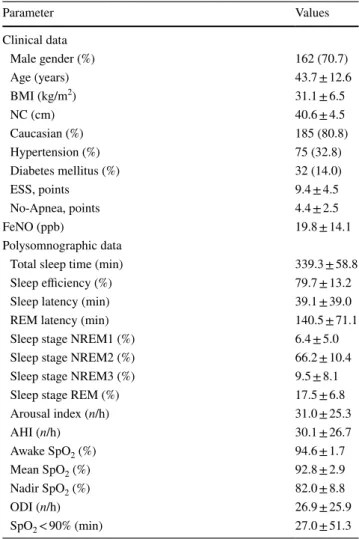
numeric parameters: all clinical and polysomnographic Table 1 Patients characteristics (n = 229)
Numeric and categorical variables were presented as mean ± standard deviation and n (%), respectively
BMI body mass index, NC neck circumference, ESS Epworth
Sleepi-ness Scale, FeNO fraction of exhaled nitric oxide, AHI Apnea/Hypo-pnea Index, REM rapid eye movement, SpO2 oxygen saturation, ODI oxygen desaturation index at 3%
Parameter Values Clinical data Male gender (%) 162 (70.7) Age (years) 43.7 ± 12.6 BMI (kg/m2) 31.1 ± 6.5 NC (cm) 40.6 ± 4.5 Caucasian (%) 185 (80.8) Hypertension (%) 75 (32.8) Diabetes mellitus (%) 32 (14.0) ESS, points 9.4 ± 4.5 No-Apnea, points 4.4 ± 2.5 FeNO (ppb) 19.8 ± 14.1 Polysomnographic data
Total sleep time (min) 339.3 ± 58.8
Sleep efficiency (%) 79.7 ± 13.2
Sleep latency (min) 39.1 ± 39.0
REM latency (min) 140.5 ± 71.1
Sleep stage NREM1 (%) 6.4 ± 5.0
Sleep stage NREM2 (%) 66.2 ± 10.4
Sleep stage NREM3 (%) 9.5 ± 8.1
Sleep stage REM (%) 17.5 ± 6.8
Arousal index (n/h) 31.0 ± 25.3 AHI (n/h) 30.1 ± 26.7 Awake SpO2 (%) 94.6 ± 1.7 Mean SpO2 (%) 92.8 ± 2.9 Nadir SpO2 (%) 82.0 ± 8.8 ODI (n/h) 26.9 ± 25.9 SpO2 < 90% (min) 27.0 ± 51.3
data evaluated failed to reveal any significant correlation with FeNO values, except for age (r = 0.134; p = 0.042),
No-Apnea model (r = 0.156; p = 0.018), and awake SpO2
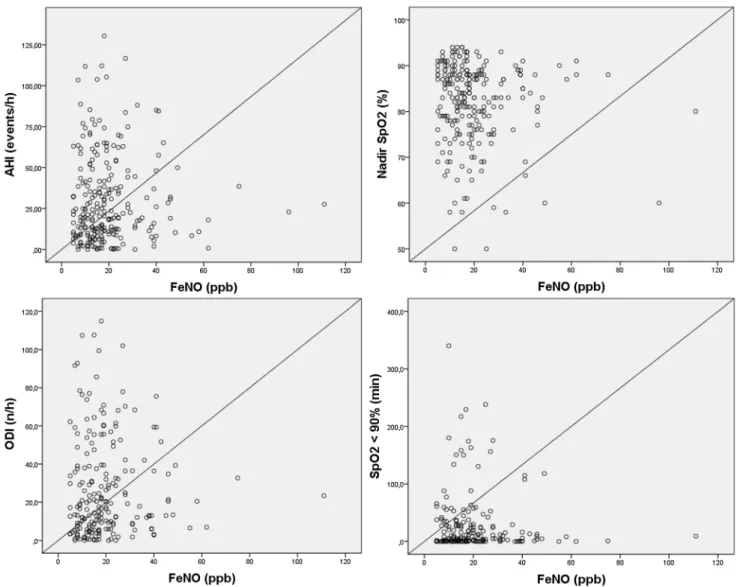
(r = − 0.148; p = 0.025); however, all of them show a weak correlation. As shown in Table 2, the correlation between FeNO and parameters related with OSA severity (AHI, nadir SpO2, ODI at 3%, and cumulative time with SpO2 < 90%) were all not significant: r = 0.068 with p = 0.304; r = − 0.082 with p = 0.218; r = 0.099 with p = 0.161; and r = 0.050 with
p = 0.481, respectively (Fig. 1). Predicting OSA with FeNO
Mean FeNO values were similar among subjects with-out OSA (AHI < 5.0/h) or with OSA (AHI ≥ 5.0/h): 16.9 ± 10.6 ppb versus 20.2 ± 14.5 ppb, p = 0.221;
respec-tively. In addition, Fig. 2 shows FeNO measurements
according to four AHI intervals: < 5.0/h (without OSA), 5.0–14.9/h (mild OSA), 15.0–29.9/h (moderate OSA), and ≥ 30.0/h (severe OSA), illustrating that mean FeNO values were not statistically different across severity categories based on AHI (p value for trend = 0.392).
FeNO was not a relevant retainable parameter to pre-dict any OSA, moderate/severe OSA, and severe OSA: OR 1.023 (95% CI: 0.986–1.062; p = 0.220); OR 1.012 (95% CI: 0.991–1.034; p = 0.251); and OR 0.999 (95% CI: 0.980–1.018; p = 0.931), respectively. Corroborat-ing the findCorroborat-ings described above, we also observed a poor
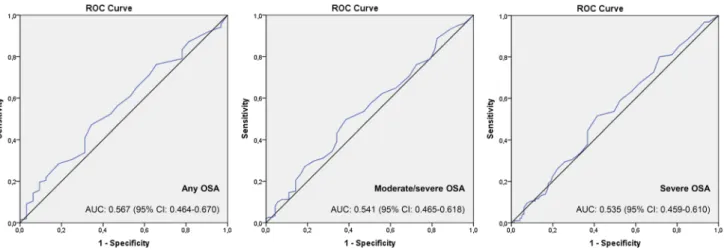
discrimination of FeNO in predicting any OSA, moderate/ severe OSA, and severe OSA (Fig. 3): AUC: 0.567 (95% CI: 0.464–0.670; p = 0.235), AUC: 0.541 (95% CI: 0.465–0.618;
p = 0.295), and AUC: 0.535 (95% CI: 0.459–0.610; p = 0.376), respectively.
Discussion
In the present study, FeNO measurements emerge as a clearly not useful measurement when applied as a potential screening tool for OSA in patients with a high pre-test prob-ability of SDB. In addition, our study indicated that FeNO values were not significantly different in those patients with or without OSA. Studies investigating the effect of OSA on FeNO measurements are inconsistent and with conflicting results [10–19, 23]. Similar to our findings, a study [19] with 129 consecutive patients, aged ≥ 16 years, showed no value in incorporating FeNO in the screening of OSA, con-sidering that FeNO values were similar among individuals with or without SDB, and also whether SDB was defined by an AHI threshold of ≥ 5.0/h or ≥ 15.0/h. Similarly, there were no differences in FeNO concentrations in individuals with OSA (n = 24) and in healthy individuals (n = 7) [18]. A probable explanation for current findings could be that the inflammation that is generally present in patients with OSA may not be eosinophilic in nature. In addition, exclusion of patients with allergic rhinitis, asthma, and asthma–COPD overlap may also have contributed to the negative findings of FeNO as a screening approach for OSA.
Our study was conducted with FeNO measurements being always performed in the morning, aiming to minimize pos-sible circadian-related variations, a feature that has been pre-viously reported as a potential confounder [24]. Differences before and after the sleep periods [16] have led to the rec-ommendation of standardizing the time of day when FeNO measurements are conducted. Moreover, it was also noted that establishment of reference values for FeNO is difficult, given the large number of frequently occurring factors that can influence this measurement [25]. For example, smoking, gender, age, weight, height, atopy, respiratory/nasal symp-toms, use of steroids, and diet have all been implicated in the variance of FeNO.
A previous study [17] evaluated the changes of FeNO
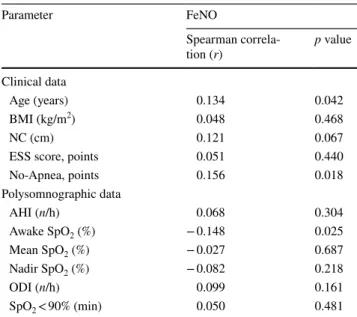
before and after sleep as function of BMI. FeNO levels in subjects without OSA as well as those with OSA were similar, but significant increases were detected in obese patients with OSA, suggesting that obesity is modifying factor and potentially enhances inflammation in the airways in patients with OSA [17]. Similarly, a study [11] with 43 individuals (18 obese patients with OSA, 15 obese patients without OSA, and 10 healthy subjects) showed that FeNO was significantly increased in OSA and in obese patients Table 2 Correlation between FeNO values and other measures
(n = 229)
The FeNO values were correlated with age, No-Apnea model, and awake SpO2; however, all of them reporting a weak correlation
BMI body mass index, NC neck circumference, ESS Epworth
Sleepi-ness Scale, AHI Apnea/Hypopnea Index, SpO2 oxygen saturation,
ODI oxygen desaturation index at 3%
Parameter FeNO Spearman correla-tion (r) p value Clinical data Age (years) 0.134 0.042 BMI (kg/m2) 0.048 0.468 NC (cm) 0.121 0.067
ESS score, points 0.051 0.440
No-Apnea, points 0.156 0.018 Polysomnographic data AHI (n/h) 0.068 0.304 Awake SpO2 (%) − 0.148 0.025 Mean SpO2 (%) − 0.027 0.687 Nadir SpO2 (%) − 0.082 0.218 ODI (n/h) 0.099 0.161 SpO2 < 90% (min) 0.050 0.481
(23.1 ± 2.1 ppb and 17.9 ± 2.1 ppb) when compared to con-trols (7.2 ± 0.6 ppb), thereby supporting the hypothesis that obesity alone can alter the inflammatory status of the upper airway. Concurring findings [14] were reported in 60 patients reinforcing the concept that inflammation of the upper airways in obese patients with OSA and without OSA may be monitored by FeNO measurements.
Interestingly, in a series of 104 consecutive adult non-smokers (75 patients with OSA and 29 controls), FeNO val-ues were elevated in OSA, were correlated with severity, and decreased after positive pressure therapy [12]. Furthermore, in patients with OSA, FeNO levels were significantly higher after sleep compared to measurements conducted at bed-time (19.0 ± 7.7 ppb vs. 13.4 ± 6.5 ppb), while there were no significant overnight changes in patients without OSA. In addition, FeNO levels declined after 1–3 months of CPAP Fig. 1 Scatterplot of individual AHI values, nadir oxygen saturation
(SpO2), ODI at 3%, and cumulative time with SpO2 < 90% plotted
against the corresponding FeNO concentrations in 229 subjects. The
Spearman rank correlation coefficients between FeNO and AHI, nadir SpO2, ODI at 3%, and cumulative time with SpO2 < 90% were all not
significant (p = 0.304, p = 0.218, p = 0.161, p = 0.481; respectively) 16.9 ± 10.6 19.2 ± 12.1 22.3 ± 20.2 19.7 ± 11.7 0 5 10 15 20 25
Without OSA Mild OSA Moderate OSA Severe OSA
FeNO values (ppb)
Fig. 2 FeNO concentrations according to four AHI intervals: < 5.0/h (without OSA), 5.0–14.9/h (mild OSA), 15.0–29.9/h (moderate OSA), and ≥ 30.0/h (severe OSA). Values of FeNO were reported as mean ± standard deviation. The mean FeNO values were not statisti-cally different across categories de AHI (p value for trend = 0.392)
therapy (11.7 ± 4.4 ppb, p < 0.001). Nearly identical results were reported in a smaller series of 26 patients [26]. Thus, based on aforementioned studies, it would appear that CPAP therapy yields clinical benefits by reducing upper airway inflammation and oxidative stress in OSA patients.
Similar to our findings, some studies have shown no usefulness of ESS as a screening tool for OSA [27–30]. Conversely, a practical and extremely simple 2-item model, No-Apnea [21], showed adequate discriminatory ability for detection of OSA in a clinical referral cohort. In the origi-nal derivation cohort, the AUCs for screening for any OSA, moderate/severe OSA, and severe OSA were: 0.784 (95% CI: 0.761–0.808); 0.758 (95% CI: 0.737–0.777), and 0.754 (95% CI: 0.733–0.776); respectively, and the validation cohort essentially confirmed such findings, thereby establishing its reproducibility, and its non-inferiority performance when compared to two previously validated tools (STOP-Bang questionnaire [31] and NoSAS score [32], containing eight and five parameters, respectively) [21].
Limitations and Strengths
Our study had some limitations: patient selection occurred in a single sleep laboratory; therefore the possibility of selec-tion bias is plausible and generalizability of the findings may be limited. In most sleep laboratories, patients referred for PSG are often suspected of suffering from OSA and there-fore represent a high pre-test probability cohort. In addi-tion, all patients included had FeNO measured at the same time (only in the morning): this certainly does not exclude daily variations, it only minimizes circadian or time of day confounders as possible measurement bias. According to some previous studies [12, 13, 17], which have shown that
FeNO measurements are greater immediately upon awak-ening than at night, especially in patients with OSA ver-sus patients without OSA, we chose to measure FeNO in the next morning after PSG, immediately upon waking up. However, several points are also worthy of mention. Our patients were consecutively and prospectively recruited and the sample size was larger than other similar studies that have previously evaluated FeNO. All patients underwent in-lab PSG with the same diagnostic criteria proposed by
American Academy of Sleep Medicine [22], regardless of
whether their clinical symptoms included respiratory com-plaints or not. Moreover, all polysomnographic studies were of sufficient quality for inclusion in the analyses.
Conclusions
In a contextual setting of clinical referral cohort to a sleep laboratory, FeNO measurements do not show evidence of sufficient discriminatory ability to warrant the inclusion of this measurement for the screening of OSA in adult patients. Compliance with Ethical Standards
Conflict of interest The authors declare that they have no competing interests.
References
1. Peppard PE, Young T, Barnet JH, Palta M, Hagen EW, Hla KM (2013) Increased prevalence of sleep-disordered breathing in adults. Am J Epidemiol 177:1006–1014
Fig. 3 ROC curves of the FeNO concentrations in the prediction
of any OSA, moderate/severe OSA, and severe OSA, which were defined by an AHI ≥ 5.0/h, ≥ 15.0/h, and ≥ 30.0/h; respectively. The discriminatory ability—reported as AUC and 95% confidence
inter-val (CI)—of FeNO was not useful for screening the any OSA, moder-ate/severe OSA, and severe OSA: p = 0.235, p = 0.295, and p = 0.376; respectively
2. Gabbay IE, Lavie P (2012) Age- and gender-related characteristics of obstructive sleep apnea. Sleep Breath 16:453–460
3. Flegal KM, Kruszon-Moran D, Carroll MD, Fryar CD, Ogden CL (2016) Trends in obesity among adults in the United States, 2005 to 2014. JAMA 315:2284–2291
4. Duarte RL, Magalhães-da-Silveira FJ (2015) Factors predictive of obstructive sleep apnea in patients undergoing pre-operative evaluation for bariatric surgery and referred to a sleep laboratory for polysomnography. J Bras Pneumol 41:440–448
5. Martínez-García MA, Capote F, Campos-Rodríguez F, Lloberes P, Díaz de Atauri MJ, Somoza M et al (2013) Effect of CPAP on blood pressure in patients with obstructive sleep apnea and resist-ant hypertension: the HIPARCO randomized clinical trial. JAMA 310:2407–2415
6. Almendros I, Carreras A, Ramírez J, Montserrat JM, Navajas D, Farré R (2008) Upper airway collapse and reopening induce inflammation in a sleep apnoea model. Eur Respir J 32:399–404 7. Dweik RA, Boggs PB, Erzurum SC, Irvin CG, Leigh MW,
Lun-dberg JO et al (2011) An official ATS clinical practice guideline: interpretation of exhaled nitric oxide levels (FENO) for clinical applications. Am J Respir Crit Care Med 184:602–615
8. Shaw DE, Berry MA, Thomas M, Green RH, Brightling CE, Wardlaw AJ et al (2007) The use of exhaled nitric oxide to guide asthma management: a randomized controlled trial. Am J Respir Crit Care Med 176:231–237
9. Cowan DC, Cowan JO, Palmay R, Williamson A, Taylor DR (2010) Effects of steroid therapy on inflammatory cell subtypes in asthma. Thorax 65:384–390
10. Zhang D, Luo J, Qiao Y, Xiao Y, Huang R, Zhong X (2017) Meas-urement of exhaled nitric oxide concentration in patients with obstructive sleep apnea. A meta-analysis. Medicine 96:12(e6429) 11. Depalo A, Carpagnano GE, Spanevello A, Sabato R, Cagnazzo
MG, Gramiccioni C et al (2008) Exhaled NO and iNOS expres-sion in sputum cells of healthy, obese and OSA subjects. J Intern Med 263:70–78
12. Chua AP, Aboussouan LS, Minai OA, Paschke K, Laskowski D, Dweik RA (2013) Long-term continuous positive airway pressure therapy normalizes high exhaled nitric oxide levels in obstructive sleep apnea. J Clin Sleep Med 9:529–535
13. Przybylowski T, Bielicki P, Kumor M, Hildebrand K, Maskey-Warzechowska M, Fangrat A et al (2006) Exhaled nitric oxide in patients with obstructive sleep apnea syndrome. Pneumonol Alergol Pol 74:21–25
14. Carpagnano GE, Spanevello A, Sabato R, Depalo A, Turchiarelli V, Foschino Barbaro MP (2008) Exhaled pH, exhaled nitric oxide, and induced sputum cellularity in obese patients with obstructive sleep apnea syndrome. Transl Res 151:45–50
15. Petrosyan M, Perraki E, Simoes D, Koutsourelakis I, Vagiakis E, Roussos C et al (2008) Exhaled breath markers in patients with obstructive sleep apnoea. Sleep Breath 12:207–215
16. Olopade CO, Christon JA, Zakkar M, Hua C, Swedler WI, Scheff PA et al (1997) Exhaled pentane and nitric oxide levels in patients with obstructive sleep apnea. Chest 111:1500–1504
17. JalilMirmohammadi S, Mehrparvar AH, Safaei S, Samimi E, Torab Jahromi M (2014) The association between exhaled
nitric oxide and sleep apnea: the role of BMI. Respir Med 108:1229–1233
18. Agustí AG, Barbé F, Togores B (1999) Exhaled nitric oxide levels in patients with sleep apnea. Sleep 22:231–235
19. Cowan DC, Allardice G, Macfarlane D, Ramsay D, Ambler H, Banham S et al (2014) Predicting sleep disordered breathing in outpatients with suspected OSA. BMJ Open 4:e004519
20. Johns MW (1991) A new method for measuring daytime sleepi-ness: the Epworth Sleepiness Scale. Sleep 14:540–545
21. Duarte RLM, Rabahi MF, Magalhães-da-Silveira FJ, de Oliveira-e-Sá TS, Mello FCQ, Gozal D (2018) Simplifying the screening of obstructive sleep apnea with a 2-item model, No-Apnea: a cross-sectional study. J Clin Sleep Med 14:1097–1107
22. Berry RB, Budhiraja R, Gottlieb DJ, Gozal D, Iber C, Kapur VK et al (2012) Rules for scoring respiratory events in sleep: update of the 2007 AASM Manual for the Scoring of Sleep and Associated Events. J Clin Sleep Med 8:597–619
23. Fortuna AM, Miralda R, Calaf N, González M, Casan P, Mayos M (2011) Airway and alveolar nitric oxide measurements in obstruc-tive sleep apnea syndrome. Respir Med 105:630–636
24. Kharitonov SA, Gonio F, Kelly C, Meah S, Barnes PJ (2003) Reproducibility of exhaled nitric oxide measurements in healthy and asthmatic adults and children. Eur Respir J 21:433–438 25. Olivieri M, Malerba M, Talamini G, Corradi M (2008) Reference
values for exhaled nitric oxide in the general population. Chest 133:831–832
26. Tichanon P, Wilaiwan K, Sopida S, Orapin P, Watchara B, Ban-jamas I (2016) Effect of continuous positive airway pressure on airway inflammation and oxidative stress in patients with obstruc-tive sleep apnea. Can Respir J 2016:3107324
27. Vana KD, Silva GE, Goldberg R (2013) Predictive abilities of the STOP-Bang and Epworth Sleepiness Scale in identifying sleep clinic patients at high risk for obstructive sleep apnea. Res Nurs Health 36:84–94
28. Panchasara B, Poots AJ, Davies G (2017) Are the Epworth Sleepi-ness Scale and Stop-Bang model effective at predicting the sever-ity of obstructive sleep apnoea (OSA); in particular OSA requiring treatment? Eur Arch Otorhinolaryngol 274:4233–4239
29. Soler X, Liao S-Y, Marin JM, Lorenzi-Filho G, Jen R, DeYoung P et al (2017) Age, gender, neck circumference, and Epworth Sleepi-ness Scale do not predict obstructive sleep apnea (OSA) in mod-erate to severe chronic obstructive pulmonary disease (COPD): the challenge to predict OSA in advanced COPD. PLoS ONE 12:e0177289
30. Mediano O, Barceló A, de la Peña M, Gozal D, Agustí A, Barbé F (2007) Daytime sleepiness and polysomnographic variables in sleep apnoea patients. Eur Respir J 30:110–113
31. Chung F, Yegneswaran B, Liao P, Chung SA, Vairavanathan S, Islam S et al (2008) STOP questionnaire: a tool to screen patients for obstructive sleep apnea. Anesthesiology 108:812–821 32. Marti-Soler H, Hirotsu C, Marques-Vidal P, Vollenweider P,
Wae-ber G, Preisig M et al (2016) The NoSAS score for screening of sleep-disordered breathing: a derivation and validation study. Lancet Respir Med 4:742–748