Universidade de Aveiro 2012
Departamento de Engenharia de Materiais e Cerâmica
Sarah Hélène
Christine Henry
Cerâmica islâmica em corda seca de Mértola dos
séculos X a XIII
“Cuerda seca” Islamic ceramics from the X-XIIIth
centuries of Mértola
Universidade de Aveiro Ano 2012
Departamento de Engenharia de Materiais e Cerâmica
Sarah Hélène
Christine Henry
Cerâmica islâmica em corda seca de Mértola dos
séculos X a XIII
“Cuerda seca” islamic ceramics from the X-XIIIth
centuries of Mértola
Dissertação apresentada à Universidade de Aveiro para cumprimento dos requisitos necessários à obtenção do grau de Mestre em Ciência e Engenharia de Materiais, realizada sob a orientação científica do Doutor Joaquim Manuel Vieira, Professor Catedrático do Departamento de Engenharia de Materiais e Cerâmica da Universidade de Aveiro, e co-orientação do Doutor e da Doutora Susana Gomez Martinez, Investigadora do Centro de Estudos Arqueológicos das Universidades de Coimbra e Porto e Co-Diretora de Escavações Arqueológicas do Campo Arqueológico de Mértola
o júri
Presidente Professora Doutora Maria Margarida Tavares Lopes de Almeida Professora Auxiliar da Universidade de Aveiro
Vogais Professor Doutor Joaquim Manuel Vieira
Professor Catedrático da Universidade de Aveiro (Orientador) Professor Doutor João Paulo Pereira Freitas Coroado,
Professor Coordenador da Escola Superior de Tecnologia de Tomar, Instituto Politécnico de Tomar Professora Doutora Ana Margarida Madeira Viegas de Barros Timmons Professora Auxiliar da Universidade de Aveiro
Professor Doutor Pedro Manuel Lima de Quintanilha Mantas Professor Auxiliar da Universidade de Aveiro (Co-orientador)
Doutora Susana Gómez Martinez
Investigadora do Programa Ciência 2008 da FCT, Universidade de Coimbra - CEAUCP / Campo Arqueológico de Mértola (Co-orientadora)
agradecimentos
Support from FAME Master/Erasmus Mundus is acknowledged by the author. Access to the electron microscopy infrastructures of RNME Pole of Aveiro, FCT Project: REDE/1509/RME/2005 is gratefully acknowledged.I am very grateful Doctor Susana Gomez and the camp of archaeological Mértola for their hospitality and above all their confidence.
I especially want to express my gratitude to Pr. Joaquim M. Vieira, Pr. Pedro Q. Mantas and Marta C. Ferro for their help and their support all long my internship in the laboratory of CICECO.
The help of Dr. António Fernandes and Doctor Diogo Mata and permission of the Physics Department of the University of Aviero for providing me the Raman spectrometry for this study is gratefully acknowledge too.
Is also acknowledged the entire team group RNME – National Network of Electron Microscopy, Pole of Aveiro, for their hospitality which allowed me to do my internship is very good conditions..
palavras-chave
Química analitica, cerâmicas islâmicas, corda seca, arqueologia, microscopia electrónica de varrimento, vidrados de chumbo, fosfato, Mértola.resumo
O trabalho presente pretende fazer a caracterização introdutória da estrutura, fases e composição química da pasta e vidrado de um conjunto de seis peças de cerâmica islâmica em "corda seca" dos séculos X-XIII fornecidas pelo Campo Arqueológico de Mértola. É espetável que os resultados do trabalho possam vir a ser úteis para uma futura identificação da origem das peças, das relações de comércio implícitas ou para lançar luz sobre as antigas tecnologias de fabricação de cerâmica.Foram selecionadas para este estudo várias das técnicas instrumentais disponíveis. A microscopia eletrónica de varrimento com espectrometria EDS como a ferramenta mais geral foi extensivamente utilizada na determinação da morfologia e da composição química aproximada do vidrado e da pasta. As fases cristalinas presentes na pasta foram identificadas por difração de raios-X. Recorreu-se à espetroscopia UV e ao colorímetro de refletância CIELab para organizar as pastas segundo a cor com o suporte de índices quantitativos. Para questões específicas da composição e microestrutura da zonagem observada no vidrado de algumas amostras recorreu-se ainda à espetrometria micro-Raman e microscopia de luz polarizada refletida para complemento do estudo.
Algumas das amostras apresentaram quantidades importantes de fósforo na camada do vidrado. Nesta matéria, é comummente aceite nos estudos arqueológicos que o fósforo detetado em cerâmica ou vidros antigos que estiveram enterrados vem de águas residuais. Tal interpretação encaixa verosimilmente nos resultados, em parte apenas das amostras arqueológicas estudadas. Observou-se que as fases com fósforo são caracterizadas por uma proporção específica dos elementos Pb, P e Ca apresentando dois tipos de morfologia que são discutidos. Sabe-se que os vidros contendo fósforo podem apresentar intervalo de miscibilidade, com um de vidro de fósforo / chumbo / cálcio que tenderá a separar-se da composição rica em silicato. A implicação, ainda que especulativa, seria de que as cinzas ósseas poderiam estar a ser utilizadas como matéria-prima para a preparação de vidrados cerâmicos de baixo ponto de fusão. Partir desta perspetiva poderá justificar o aprofundamento do estudo para separação entre os efeitos de intemperismo e a hipotética utilização técnica de fosfatos.
A tese começa com um prólogo curto sobre o contexto histórico das amostras investigadas seguido pela descrição resumida dos principais métodos experimentais utilizados. Os dois capítulos com resultados experimentais incluem um estudo introdutório com uma coleção de quatro peças de tempos mais recentes e o da caracterização das amostras históricas da cerâmica em "corda seca"
keywords
Analytical chemistry, Islamic ceramics, “cuerda seca”, archeology, scanning electron microscopy, lead glazes, phosphate, Mértolaabstract
The present work intended to give a introductory characterization of structure, phases and chemical composition of the paste and glaze of a set of six pieces of Islamic ceramics of “cuerda seca” type from the X-XIIIth centuries provided by the Mértola archeological site. The results will expectedly be a contribution to the identification of origin of the pieces, the trading that can be implied or to shed light and on ancient ceramic fabrication technologies.Several instrumental techniques made available were selected for the study, the Scanning Electron Microscopy with EDS spectrometry as a general tool to determine morphology and the chemical elemental composition of the glaze and paste, X-ray diffraction for the crystalline phases in the paste, UV-spectroscopy and colorimetric to organize the pastes by their color with quantitative indexes. For special cases micro-Raman spectrometry and reflected polarized light microscopy were added to complement the study. Some of the samples showed important amounts of phosphor in glazed layers. In this matter, it is commonly accepted that the phosphor in archeological ceramics or glasses that were buried comes from runoff water, such interpretation seemingly fits our results in part of the archeological samples. It was observed that phosphor phases are characterized by a specific ratio of the elements Pb, P and Ca with two types of morphology that are further discussed. It is known that phosphor containing glasses may present miscibility gaps, phosphorous/lead/calcium glass tending to separate from the silicate rich composition. It would speculatively imply that bone ashes as raw material for preparation of low melting point glazes could have been in use. From this perspective, the distinction between weathering effects and a technical phosphor may mean continuation of the study.
The thesis starts with short prologue on the historical context of samples followed by the short description of the main experimental methods used. The two chapters with experimental results include an introductory study with a collection of four pieces of more recent times and the comprehensive characterization of the “cuerda seca” historical samples.
TABLE OF CONTENTS
CHAPTER 1 - PROLOGUE
1
CHAPTER 2- EXPERIMENTAL METHODS AND TECHNIQUES
7
1
.
S
AMPLE PREPARATION9
2
.
P
RINCIPLE AND TECHNICAL CHARACTERISTICS OFSEM
10
3
.
X-R
AY DIFFRACTION(XRD)
12
4
.
O
PTICAL MICROSCOPY13
5
.
R
AMAN SPECTROSCOPY13
6
.
C
OLORIMETRIC ANALYSES13
6.1
UV-
SPECTROSCOPY13
6.2
CIEL*
A*
B*
COORDINATES14
CHAPTER 3- PRELIMINARY STUDY
15
1
.
T
HE PASTES19
1.1
S
CANNINGE
LECTRONM
ICROSCOPY19
1.2
X-R
AYD
IFFRACTION22
2
.
T
HE GLAZES25
2.1
S
CANNINGE
LECTRONM
ICROSCOPY25
3
.
C
ONCLUSION31
CHAPTER 4 – MÉRTOLA SAMPLES
33
1
.
H
ISTORICAL CONTEXT35
1.1
“C
UERDA SECA”
35
1.2
D
ECORATION35
2
.
S
AMPLES36
3
.
R
ESULTS38
3.1
C
OLORIMETRIC ANALYSIS OF THE PASTE39
3.4
HBR-0072
ANDHBR-0207
58
3.5
X-
RAY DIFFRACTION63
4
.
D
ISCUSSION64
4.1
P
HOSPHOROUS POLLUTION FROM WEATHERING64
4.2
T
ECHNICAL PHOSPHOROUS64
CHAPTER 5 - CONCLUSIONS AND SUGGESTIONS OF FURTHER WORK
73
R
EFERENCES77
LIST OF FIGURES
FIGURE 1. MAP OF THE AL-ANDALUS REGION CORRESPONDING TO MOST OF THE IBERIAN PENINSULA WITH
EXCEPTION OF REGIONS IN NORTH AND NORTH-EAST OF THE TERRITORY (MOLERA 2001). ... 4
FIGURE 2:MAIN PLACES OF PORTUGAL AND SPAIN TERRITORIES INVOLVED “CUERDA SECA” EXCHANGE (SUSANA 2006) ... 5
FIGURE 3.IMAGES OF TWO MOUNTED SAMPLES, PREPARED FOR MICROSCOPY; MOUNTED IN EPOXY FOR CROSS -SECTION (LEFT) AND DIRECTLY GLUED ON SEM SAMPLE HOLDER FOR FACE ANALYSIS (RIGHT). ... 9
FIGURE 4.OPTICAL IMAGES OF THE POLISHED CROSS-SECTIONS OF SAMPLE HBR-0206(LEFT) AND HBR-0207(RIGHT) TAKEN WITH JENAPHOT MICROSCOPE. ... 10
FIGURE 5. SCHEME OF THE INTERACTION ELECTRON/SAMPLE DURING SEM(PAQUETON 2004) ... 11
FIGURE 6. CIELAB SYSTEM OF COLOR COORDINATES (SCHANDA,2007) ... 14
FIGURE 7.OPTICAL IMAGES OF THE FOUR SAMPLES: A)MSJ-TILE-2-25-REST, B)ESG-POT-3-24, C) RMS-TILE-331-3C AND D)MSJ-TILE-325-3C ... 17
FIGURE 8.DIMENSION OF THE SAMPLES: A)MSJ-TILE-2-25-REST C)RMS-TILE-331-3C AND D)MSJ-TILE-3 25-3C ... 19
FIGURE 9.SEM CROSS-SECTION IMAGES AND EDS SPECTRA OF THE PASTE AND GLAZE OF THE FOUR CERAMIC PIECES ... 22
FIGURE 10. SCALE OF ALBITE TRANSFORMATION INTO ANORTHITE STATE IN FUNCTION OF THE FRACTION OF CALCIUM ... 23
FIGURE11. X-RAY DIFFRACTION RESULTS OF THE SAMPLES PASTES... 25
FIGURE 12. IMAGES OBTAINED WITH SEM AND EDS OF THE GLAZES SAMPLES ... 28
FIGURE 13. WHITE CRYSTALS IMAGES OBTAINED WITH SEM AND EDS OF THE GLAZES SAMPLES ... 30
FIGURE 14. FACE IMAGES OBTAINED WITH SEM AND EDS OF THE GLAZES SAMPLES ... 31
FIGURE 15. OPTICAL PICTURES OF THE SIX CUERDA SECA SAMPLES ... 37
FIGURE 16.ULTRA-VIOLET SPECTRA OF THE SAMPLES CR/CSP/0023,HBR-0206,CR/CSP/0022,HBR-0072, HBR-0207 AND HBR-0001 ... 39
FIGURE 17: ELECTROMAGNETIC SPECTRUM CORRESPONDING TO THE VISIBLE RANGE ... 40
FIGURE18.SEM IMAGES OF THE SAMPLE CR/CSP/0023 ... 42
FIGURE 19.SEM IMAGES OF THE SAMPLE HBR-0001 ... 46
FIGURE 20. IMAGES OF REFLECTED POLARIZED LIGHT MICROSCOPY ILLUMINATED BY WHITE. A)SAMPLE CR/CSP/0023.B)SAMPLE HBR-0001. ... 48
FIGURE 21.MICRO-RAMAN SPECTRA OF PHOSPHATE-RICH AND QUARTZ INCLUSIONS, BANDED MATRIX AREA AND GLAZE/ PASTE INTERFACE OF SAMPLE HBR-0001, AND REFERENCE MICRO-RAMAN SPECTRA OF PURE, HIGH TEMPERATURE FIRED CALCIUM-HYDROXYAPATITE (HAP)(COURTESY OF DR.DIOGO MATA),O =532 NM. . 49
FIGURE22.SEM IMAGES OF THE SAMPLE CR/CSP/0022 ... 53
FIGURE23.SEM IMAGES OF SAMPLE HBR-0206 ... 57
FIGURE 26:HBR-0206 AND CR/CSP/0022 PROJECTIONS OF THE COMPOSITION INTO THE PERTINENT TERNARY PHASE DIAGRAMS ... 66 FIGURE 27. SEM(BSE) FIGURE OF THE SAMPLE HBR-0001, DETAILS OF A QUARTZ INCLUSION AND LINE SCAN; IN PINK SI, IN RED P, IN GREEN PB, IN BROWN CA AND IN BLUE C ... 68 FIGURE 28. SEM(BSE) FIGURE OF THE SAMPLE HBR-0001, DETAILS ON A PHOSPHOROUS GRAIN AND ITS LINE
SCAN; IN PINK SI, IN RED P, IN GREEN PB, IN BROWN CA AND IN BLUE C ... 68 FIGURE 29.SEM(BSE) FIGURE OF THE SAMPLE HBR-0001, DETAILS ON A PHOSPHOROUS GRAIN AND ITS LINE
SCAN; IN PINK SI, IN RED P, IN GREEN PB, IN BROWN CA, IN BLUE C, IN PURPLE FE, IN TURQUOISE CU AND IN GREY SN ... 69 FIGURE 30.HBR-0001 AND CR/CSP/0023 PROJECTIONS OF EDS RESULTS INTO PERTINENT TERNARY PHASE
LIST OF TABLES
TABLE 1.SUMMARY OF THE INFORMATION OF THE FOUR SAMPLES OF THE SET ... 18
TABLE 2. EDS OF THE GLAZES AND THE PASTES OF THE FOUR SAMPLES (MOL.%) ... 18
TABLE 3. CLAY MINERAL TRANSFORMATION AS A FUNCTION OF TEMPERATURE FIRING ... 23
TABLE 4.XRD OF THE PASTES OF THE SIX SAMPLES ... 39
TABLE 5.RESULTS OF THE CIELAB ANALYSES OF COLOR OF THE CERAMIC BODIES OF THE ARCHAEOLOGICAL SAMPLES ... 40
TABLE 6.EDS RESULTS OF THE SAMPLE CR/CSP/0023(MOL.%) ... 43
TABLE 7.EDS RESULTS OF THE SAMPLE CR/CSP/0023 ... 43
TABLE 8.EDS RESULTS OF THE SAMPLE HBR-0001(MOL.%) ... 46
TABLE 9.EDS RESULTS OF THE SAMPLE HBR-0001 ... 47
TABLE 10.EDS RESULTS OF SAMPLE CR/CSP/0022(MOL.%) ... 53
TABLE 11.EDS RESULTS OF SAMPLE CR/CSP/0022 ... 54
TABLE 12.EDS RESULTS OF SAMPLE HBR-0206(MOL.%) ... 57
TABLE 13.EDS RESULTS OF SAMPLE HBR-0206 ... 58
TABLE 14.EDS RESULTS OF SAMPLE HBR-0072(MOL.%) ... 60
TABLE 15.EDS RESULTS OF SAMPLE HBR-0072 ... 60
TABLE 16.EDS RESULTS OF SAMPLE HBR-0207(MOL.%) ... 62
The project of this thesis was divided into three moments; first, learning a new technique that was the scanning electron microscopy. Then, to lead me to the use of this new technology and the study of ancient pieces, I conducted a preliminary study of some samples found in the region of Aveiro. Finally, thanks to the collaboration with the Archaeological Museum of Mértola and with the archaeologist Susana M. Gomez who provided us the samples, we were able to make an extensive study of a set of six samples of the type “cuerda seca” from the X-XIIIth centuries. Historical samples have specific values regarding the heritage. Their study responds to specific needs namely to the improvement of the knowledge on economical, cultural and evolution of the technologies along time (Claire Déléry 2008, Susana Gomez 2009). For this kind of analysis, a specific strategy has to be adopted; archaeological samples, due to their fragility, and most of the time, their poor conservation, are difficult to prepare for the analysis. Indeed, they are not always adapted to the analytical techniques because of their specific shape and should not be modified or destroyed because they are precious and unique samples.
The samples come from two places in Mértola: below an ancient Christian cemetery and from a sceptic pit. A first study has been performed by Claire Déléry on a set of samples coming from another site of the archaeological zone in Mértola (Claire Déléry 2006). This study was conducted in order to have a better understanding of the technique of “cuerda seca”, cultural and economical dynamics through the analysis of the glaze and the paste of a large collection of samples.
In the Middle-Age, the Al-Andalus territory was an important space for cultural exchanges and traffic in goods because of its position in west of the Mediterranean in a time that a common Islamic rule linked East and West. With harbours in Mediterranean coast that give access to the shores of Maghreb and to the Near East harbours, Al-Andalus was in a front position to receive new techniques. Almeria was one of the most important of these harbours. Through this port passed materials, artisans and slaves in transit to the beautiful capital of the Caliphate, Cordoba (Gomez 2009).
In this time, large ceramic production centres started to develop in Al-Andalus. Polychrome glaze decoration spread from the south-east to the other side of Al-Andalus, by Atlantic harbours such as Lisbon. Mediterranean played the role of centre for diffusion of techniques, Mértola and Lisbon also contributing with local productions of ceramics, figures 1 and 2 (Molera 2001, Gomez 2009).
Figure 1. Map of the Al-Andalus region corresponding to most of the Iberian Peninsula with exception of regions in north and north-east of the territory (Molera 2001).
The trade of ceramics in Al-Andalus appears to be better represented by glazed materials: honey colored and manganese glaze and ceramics decorated with “cuerda seca” technique. From the Xth to the XIIth century, the “cuerda seca” production sites could only be found in Al-Andalus (Claire Déléry 2006). Thanks to Al-Andalus harbours, the cuerda seca technique arrived not just to the Maghreb but also to the south of France at the end of the Xth century. With the political and economical changes in the region from the XIth to the XIIth century, the exportation of the “cuerda seca” potteries grew to Italy, Egypt and other large harbours with an increase of exchanges between Occident and the Mediterranean Orient.
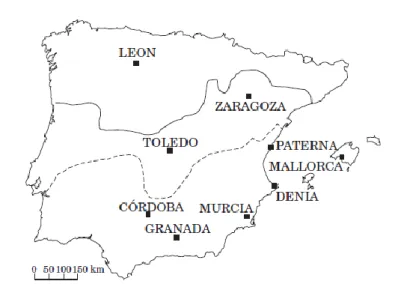
Mértola became one of the communication centers in Garb Al-Andalus. The town played an important role in the redistribution of objects in an extended trade network. Mértola was the central point of the economy in the south-west of Al-Andalus, a wide region that overlaps with the present territories of south of Portugal and west of the autonomous communities of Extremadura and Andalusia in Spain. Indeed, Mértola was considered as an inland seaport tied to the Mediterranean economy since Iron Age and was already the site with palladium and forum during the early Roman period (mid-2th century BC) (Gomes, 2007). This port was located at the most northerly navigable point of the Guadiana river, at the intersection between regional commercial networks and Mediterranean maritime trade routes, figure 2 (Gomez 2009).
Figure 2. Main places of Portugal and Spain territories involved in the“cuerda seca” exchange (Susana 2006)
Mértola provided us 6 samples to bring new information and make a comparison between our results and the results obtained by Claire Déléry and to be able to understand the cultural and economical trades in this type of ceramics. The aim of this study is to determine their structure compositions in order to establish where and how samples were made and their techniques of fabrication. Several techniques of characterization were used: Scanning Electron Microscopy, to determine the morphology and the elemental composition of the glaze, and X-ray diffraction, to give information about the phases of the ceramic body. UV-spectroscopy, colorimetric and micro-Raman analyses were also used.
The following of the thesis is divided into three parts. The first part describes the experimental techniques listed above. The second part is a short study about the preliminary steps in characterizing some samples. Finally, the third part is the characterization of the set of historical samples from the Mértola archaeological site.
The aims of the preliminary study were to establish some routine and protocol concerning the analyses of archaeological samples (understanding the composition of the ceramics, especially the glaze) and to become familiar with the SEM technique (solving the difficulties of sample preparation) and with the analyses themselves. The analysis of a set of four samples of different sate of conservation and ages allowed me to improve the knowledge in formulation of ceramics. This study also allowed me to develop approaches in sample preparation that should be the less destructive as possible within the spirit of conservation.
The main part of the thesis concerns the study of the glazes of the set of “cuerda seca” samples. The term “cuerda seca” was coined in 1558 to describe the décor on ceramic materials with which the
different glazes are isolated from each other by a line of different composition, mostly manganesium oxide composed with fat. The technique of glazing ceramic bodies was firstly used by the, Achaemenid known as the first Persian Empire in the Ist millenary BC (Encyclopedia Universalis).
The second half of the Xth century was a time for art and culture development in Al-Andalus. Orient influenced polychrome decor of ceramics appeared in the Iberian Peninsula. The potters started the production of the first polychrome glazes; honey coloured and manganese decoration, followed by those decorated with the “cuerda seca” technique. In Orient, the centres of production were Kashan, Damas, Fostât and the Caire. Following the route of faiences and Muslim expansion, the “cuerda seca” arrived in Spain in the Xth
century and in Malaga later in the XIIth century. In Cristian reconquested territories of Spain the “cuerda seca” décor was mainly fabricated in Seville and Toledo (Encyclopedia Universalis).
During the study, analyses showed important amounts of phosphor. Usually, phosphor found in ancient pieces is considered as the result of weathering by the archaeologists. The phosphorous pollution usually comes from runoff water coming through cemetery, or treatment of the ground with phosphates. In the case of this set of “cuerda seca” ceramics, the findings seem more complex because three kinds of morphology were observed. In two samples, phosphor was only observed at the surface of the sample which can be considered as external pollution. Because of the particular morphology and an obvious correlation between samples concerning the repartition of phosphorous matter (similar ratio Pb/P/Ca) one opted to give room in this study on other potential sources of phosphor in those samples beyond the effects of the burials.
1. Sample preparation
Depending on the sample and on the analysis to be performed (SEM or optical microscopy), there are several sample preparations techniques of selection. The sample can be directly analyzed without modification in the case of topography analyses. In that case, the sample is fixed on a metallic holder with carbon cement or tape. If the sample is non-conductive, a carbon coating (or AOPD) is used to allow the conduction of the electrons through the sample. Samples are often polished in order to offer a flat surface for the study of chemical composition with more accurate measurements.
For the study of the cross-sections, the cut bits of the samples were mounted in epoxy (80% araldite-AY103 and 20% hardener) left to cure overnight. Once it is hardened, the mounting is grinded and the polished in two main steps on silicon-carbide paper follow by fine polishing with diamond paste on cloth. According to the sample (soft or hard material), one can use several grit sizes paper and pastes. For the preparation of the samples of this study three silicon-carbide paper; P400, P800 and P1000 and four diamond paste; #15, #6, #3, #1 (m) were used. The higher the grit numbers the smaller the abrasive grain sizes are. At the end of the polishing, the sample can be removed from the epoxy mounting or directly glued on a metallic holder and coated with carbon or AOPD.
For the facing analysis by SEM, the taken bits of the glazes were directly glued on a metallic SEM sample holder with carbon cement. The carbon cement allows better adherence of the samples than the carbon tape sticks but it needs 5 hours drying. After drying, the samples were coated with a carbon film. As the ceramics samples are non-conductive materials, one applied two layers of C coating.
Polished samples were glued on metallic SEM sample holders and coated with carbon (as for facing analyses), figure 3.
CROSS-SECTION FACING
Figure 3. Images of two mounted samples, prepared for microscopy; mounted in epoxy for cross-section (left) and directly glued on SEM sample holder for face analysis (right).
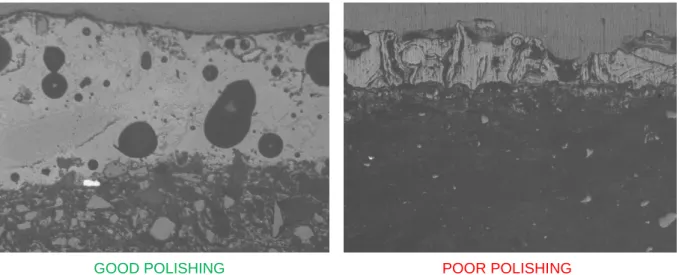
The polishing is very important in SEM microscopy to have good atomic number contrast in high resolution images the sample must have the lowest relieve as possible. It is equally important in EDS analysis in order to allow quantitative measurement of the chemical composition of the samples (Henri Paqueton and Jacky Ruste, Techniques de l’ingénieur). The quality of polishing of two samples can be observed in the images optical microscope in figure 4.
GOOD POLISHING POOR POLISHING
Figure 4. Optical images of the polished cross-sections of sample HBR-0206 (left) and HBR-0207 (right) taken with JENAPHOT microscope.
For the XRD measurement, small amount of ceramic body were cut from samples reduce into fine powder which was pressed in the sample holder of the X-Ray powder diffractometer.
2. Principle and technical characteristics of SEM
The scanning electron microscopy (SEM) is a powerful technique for surface topography observations with elemental analyses by X-ray energy (EDS) or wavelength spectrometry (WDS). It uses the signals created at the surface of solid specimen by the interaction of the fine focus electron beam-sample to give information about the texture, the chemical composition and the crystalline structure of the sample. SEM technology is used to generate a 2-dimensional image of a selected area of the surface of the sample with a lateral resolution of 2 to 10 nm, a magnification ranging from 20 to 400 000X. Analysis can also be performed in a specific point, especially useful in EDS (Energy Dispersive Spectroscopy) measurements.
A finely focusing electron beam with a specific kinetic energy scans the surface of the sample and signals produced by the sample are detected. Under the electron beam, the sample emits several signals coming from secondary electrons (giving the SEM image), backscattered electrons and photons (visible light or X-ray allowing the EDS), Auger electrons and transmitted electrons (in thin section as in STEM microscopy), figure 5.
Figure 5. Scheme of the interaction electron/sample during SEM (Paqueton 2004)
Secondary electrons produce the image point by point of the scan surface and show the morphology and topography of the sample. Backscattered electrons are valuable for illustrating contrast in composition in heterogeneous samples. X-rays are produced by inelastic collisions of the incident electrons with electrons in the orbital of the atoms. After this excitation, the electrons of the atoms return to lower energy state producing specific x-rays with characteristic wavelength corresponding to specific chemical species. The produced x-ray gives qualitative and may yield quantitative measures of the concentration of the elements present in the sample.
A scanning electron microscope is composed of: an electron source “GUN” most of the time a tungsten filament, electron lenses used to focus the beam, a sample stage (sample holder), several detectors for the different signals and finally display and data devices.
Also really important for the good work of the SEM microscope are: i) Vacuum system: prevent interaction of the beam with particles of the air, ii) Cooling system, iii) Vibration-free floor and iv) Room free of ambient magnetic and electric fields.
The SEM/EDS analysis were preformed with the SEM/EDS Hitachi S4100 with FEG electron gun and accelerating voltages in 500V a 30kV range, equipped with the Rontec EDS dectector. EDS software provides subroutines for correction of the X-Ray detection conditions in SEM and standarless analysis of chemical composition being feasible.
3. X-Ray diffraction (XRD)
X-ray diffraction is an analytical technique giving information about the crystal structure, chemical composition and physical properties of materials and thin films. X-ray domain, goes from 0.1 Å (γ-Ray limit) to 100 Å (far-UV limit) corresponding to the energy range 0.1 to 100 keV (E=hν=h.c/λ).
The X-ray diffractometry as analytical method can only be used on crystallized materials such as minerals, metals, ceramics, semi-crystalline polymers and organic crystallized samples but not on amorphous material such as the glasses. Yet, crystalline inclusions and precipitates of glazes can be analysed by XRD.
There are many possibilities for the X-rays to interact with the matter; in diffraction, the beam can be diffracted elastically or inelastically. In XRD, one are talking about elastic diffraction; meaning that the incident and the diffracted beams have the same wavelength and the same energy. The kinetic energy of the incident particles is conserved, only their direction of propagation is modified.
In powder-XRD, a focused X-ray beam is diffracted by a sample composed of a big number of microcrystals with random orientation. The microcrystals have a size between 0.01 and 0.001 mm. As there are a lot of microcrystals, one can count that enough of them have a family of reticular plane that matches with the Bragg relation. Indeed, one can represent the crystal network as a series of parallel and equidistant lattice planes. Bragg's law provides the condition for a plane wave to be diffracted by a family of lattice planes:
n. λ = 2dhkl.sinθ (Eq. 1)
Where d is the lattice spacing, θ the angle between the wave vector of the incident plane wave, k0, and the lattice planes, λ its wavelength and n is an integer corresponding to the order of the reflection. It is equivalent to the diffraction condition in reciprocal space and to the Laue equations.
For peak identification using the Bragg equation (Eq.1) for each peak, one calculates the corresponding distance crystalline distance dhkl. With the series of dhkl one can determine the series of planes hkl which is related to the lattice parameters. JCPDS files constitute a database of almost known crystalline compounds at the present time. Identification of the phases is based on the comparison of the values distances and peak relative intensity with the files, assisted specialized search tools provided by dedicated software.
From other methods of treating information provided by XRD, such as Rietveld method or Fourrier transforms, one can obtain more information about the sample, namely: i) quantitative analysis: determine the composition of a mixture, ii) determination of preferential orientation of the crystal (texture study), iii) determination of the phase transitions, iv) crystalline structure determination. The XRD analysis was performed with the Rigaku XDMAX powder diffractometer at room temperature using monochromatic Cu Kα radiation (λ = 1.54056 Å).
4. Optical microscopy
By using polarized light in optical microscopy birefringent materials have the optical contrast increased by the rotation of the vector the electromagnetic field of light. Polarised light analysis of rocks or man-made materials is more often done with transmitted light microscopy. As such, it allows quantitative analysis as usually done in geology, mineralogy or even in chemical studies. Reflection of light on the surfaces of the solids also induces rotation of the vector of the electromagnetic field of light. In partially transparent materials or in presence of surface thin films the reflected light may create interference effects of the polarized light beam that are exposed by using the analyser, as found in Kern optical microscopy (Weaver 2003).
In this study the polished sections of glazes of selected samples were observed in reflected polarized light microscopy with a Nikon microscope equipped with 2 Mb digital photographic camera.
5. Raman spectroscopy
Raman spectroscopy is based on the inelastic scatter of light by the vibration excitation modes of molecules and atomic bonds of the materials. Phonons may be created (Stokes process) or annihilated (Anti Stokes process) in this excitation processes. The Raman shift of the frequency of the scattered beam in relation to the incident beam measures the energy associated to the Stokes/ anti Stokes processes and yields information on the specific energy of chemical bonds of the material being analysed. Raman spectroscopy is frequently restricted to narrow wavenumber range 50-1000 cm-1, which is close to the range selected also for this study. Rules of mutual exclusion correlated the ouputs of Raman spectroscopy to the results of IR FT spectrometry.
The use of laser beams finely focused by the optics of the microscope can give very narrow, highly monochromatic, coherent beam excitations in very small volumes of the surface of the sample as in micro-Raman spectroscopy (Gardiner 1989, Ferraro 2003). For the present study the micro Raman Spectrometer Jobin Yvon 64000 of the Department of Physics was used. It has the following main features: spatial resolution (1 micron), spectral resolution (1 cm-1 ), range: 40 cm-1 to 8000 cm-1, laser excitation of Argon and Ti-saphire.
6. Colorimetric analyses
6.1UV- spectroscopy
The spectrometer UV-3100 (UV-VIS-NIR) recording spectrophotometer with halogen and deuterium lamps covering the spectrum from 190 to 1000 nm was used to analyse the six samples of
archaeological ceramics and determine the color of their ceramic bodies the cross-sections of in the non-glazed back surfaces, depending on the piece wall thickness.
6.2CIEL*a*b* coordinates
A second colorimetric analysis was performed using CIELab coordinates in order to determine if samples showing the same absorption peak have the same color. For this purpose, a Minolta CM-508D spectrometer with a D65 illuminator and 10 º viewing angle was used. The system of selected coordinates L* a* b*, introduced in 1976, is a measurement model of the CIE (International Commission on Illumination, CIE, 1978).
This three-dimensional representation of color is formed by the two axes a* and b*. The parameter a* can have negative values (-a*) which indicate the green color whereas positive part (a*) stands for red, figure 6. For the b* coordinate, the color ranges from blue (-b*) to the yellow (b*). The third axis is the vertical one, represents the lightness or luminance L* of the color. This quantity varies from L* = 0 (black) to L* = 100 (white) and determines color intensity. These parameters assign a location to the each color in a well defined system and allow comparison of color between different tested samples too.
Figure 6. CIELab system of color coordinates (Schanda, 2007)
The CIELab color coordinates were converted to the equivalent RGB values by using the EasyRGB color calculator (http://www.easyrgb.com/index.php?X=CALC#Result), the RGB codes yielding the shading colors of the corresponding heading boxes of table 7. The pastes of samples HBR-0206 and CR/CSP/0023 have red tainted colors. The sample HBR-0001 has a pinkish component in a color of low luminance. The sample CR/CSP/0022 has yellowish taints in a color of the lowest luminance. Finally, samples HBR-0207 and HBR-0072 show colors with greenish components faded by the intense luminance, the HBR-0207 being of clear cream color.
The color of a ceramic body depends on firing temperature, amount of iron in its composition and oxy/reduction conditions in the furnace atmosphere. For two samples that have the same composition, it is expected that the higher L* is the lower the firing temperature might have been (Schanda, 2007)
Chapter 3 - Preliminary study
An introductory analysis of tiles found in the ground of the town of Aveiro was done to show the evolution of glazes along different historical moments. It was also an objective of this first laboratory study to solve difficulties expected from poor conditions of the pastes and fragility of the glaze layers mainly during polishing of cross-section
The set of our samples included three modern ceramic pieces (one dark blue tile, a blue and yellow decorated tile, both of most recent production technologies of the 20th century and a blue and white earthenware faience also from the 20th century), and one azulejo tile probably from the 17th century. The three tiles are known as azulejos because they have coloured glazes that shine on their surface (Basso 2009). The decorations of the glaze of the four samples are shown in figure 7. The reference codes, paste thickness and XRD composition are given in table 1. The two samples with MSJ-TILE reference were picked from the ground of the old yard of Santa Joana Coventry (XVth century restored in late 20th century). The other two samples were picked from the grounds in town of Aveiro in Esgueira (ESG) and Mário Sacramento street (RMS) and were selected for the styles of decoration. The numbers indicate the date of collection in 2012.
outside - inside
a) MSJ-TILE-3 25-REST b) ESG-POT-3 24
c) RMS-TILE-3 31-3C d) MSJ-TILE-3 25-3C
Figure 7. Optical images of the four samples: a) MSJ-TILE-2-25-REST, b) ESG-POT-3-24, c) RMS-TILE-3 31-3C and d) MSJ-TILE-3 25-31-3C
are summarized in table 1. The approximate elemental composition of the body and glaze of the four pieces determinated by EDS are given in table 2.
Table 1. Summary of the information of the four samples of the set
Sample Paste Thickness
(mm)
Glazed decoration Paste composition
(DRX)
MSJ-TILE-3 25-REST
White - gray 9.5 Blue and dark blue Quartz, mullite
ESG-POT- 3 24 cream --- White and blue
(outside); White (inside)
Quartz, diopside, anorthite
RMS-TILE- 3 31-3C white 5.5 Blue, yellow and White (diffused)
Quartz, diopside, gehlenite, anorthite, mullite
MSJ-TILE-3 25-3C cream 14 White, yellow and blue (trace)
Quartz, calcite, albite, gehlenite, hematite, diopside, mullite
Table 2. EDS of the glazes and the pastes of the four samples (mol. %).
SEM Na2O MgO Al2O3 SiO2 K2O CaO TiO2 Fe2O3 CuO SnO2 PbO BaO ZrO2 ZnO
MSJ-TILE-3 25-REST Paste 1 2.2 2.5 13.0 77.5 3.7 1.1 Glaze 1 13.7 59.0 2.7 10.0 2.4 3.4 2.8 6.1 ESG-POT- 3 24 Paste 2 5.1 12.7 61.6 4.5 14.9 1.2 Glaze 2 5.7 4.3 69.9 4.7 1.0 0.3 5.0 9.1 RMS-TILE- 3 31-3C Paste 3 5.4 10.9 62.5 1.6 19.0 0.6 Glaze 3 6.9 49.2 10.4 2.5 0.4 17.4 8.1 5.1 MSJ-TILE-3 25-3C Paste 4 3.6 3.9 8.8 45.5 1.0 35.0 2.2 Glaze 4 4.6 4.8 76.2 3.9 0.9 3.3 6.3
1. The pastes
Without further analysis, one can already have an idea of the age of the tiles regarding the thickness and decoration elements. Tile pressing technology has evolved towards ever thinner section of the tile to save weight; the thicker the tile is, the elder it may be. This can be explained by the evolution of the techniques of production along ages. Such explanation is not expected to hold for the pottery pieces. Ceramic objects used as tableware are usually thin to be light and easily portable.
Thin wall pottery pieces are commonly found in ancient greek amphora collections, high quality Roman terra sigillata, as well as in the present study with the elegant cuerda seca pieces of Islamic production. One can rank the three tile pieces by the increasing the value of their thickness, figure 8 and table 1.
a) RMS-TILE-3 31- 3C: 5. 5 mm b) MSJ-TILE-3 25-REST: 9. 5 mm c) MSJ-TILE-3 25- 3C: 14 mm Figure 8. Dimension of the samples: a) MSJ-TILE-2-REST c) RMS-TILE-3 31-3C and d) MSJ-TILE-3
25-3C
1.1Scanning Electron Microscopy
In the following, for each image of microscopy, the glaze layer is seen on the top and the paste is on the bottom part of the image.
In a morphological point of view, one can make several observations including: -glaze/interface/paste
-porosity distribution
For each of these categories the four samples are similar. Indeed the three samples MSJ-TILE-3 25-REST, ESG-POT-3 24 and MSJ-TILE-3 25-3C present a well defined interface, without diffusion of the glaze into the paste. This is often interpreted as resulting from a double firing, or can be the effect of single firing when non fritted glazes are used. The paste has been fired before the glaze was applied. For the sample RMS-TILE-3 31-3C, the interface between the glaze and the ceramic body is not so neatly defined. It can be because of poor regulation of temperature during firing or, in a different way, because reaction of the glaze and clay in the case of a single firing.
One can only give a qualitative description of the porosity as no measures were taken. Regarding size, quantity and distribution of the pores in the four SEM figures 9, one can group the samples (1) with (2) and the samples (3) with (4). The two azulejos 3 and 4 seem to have less but bigger pores
1 cm 0,5 cm
and more heterogeneously distributed than the two other samples. These differences can indicate different production techniques or compositions.
MSJ-TILE-3 25-REST (1)
ESG-POT-3 24 (2)
RMS-TILE-3 31- 3C (3)
MSJ-TILE-3 25- 3C (4)
Figure 9. SEM cross-section images and EDS spectra of the paste and glaze of the four ceramic pieces.
The analysis of the paste shows that three samples present the same set of elements. The base of a natural clay, figure 9 and table 2: silicon (Si), calcium (Ca) and aluminium (Al) and common elements present in minerals such as iron (Fe), sodium (Na), magnesium (Mg) and potassium (K), present in hematite, feldspars and other minerals. The differences among these three pastes are derivative proportion of these elements. Sample (4) has a higher level of calcium and more iron than the other two samples.
Sample (1) presents a different composition; with “modern” elements such as barium (Ba) and zirconium (Zr), used to improve the production. These corroborate the thickness and the element of style and shows that this sample is a modern tile from the late 20st century industry.
1.2X-Ray Diffraction
The pastes are mostly composed of silicate derivatives of clay. Above all the intensities, in the crystalline phases in the body one find the silica (SiO2) as the mineral quartz. One also finds more complex silicate minerals such as mullite, diopside, anorthite, gehlenite and albite, table 3. Some of these silicates are the reaction products of others. Indeed, the minerals gehlenite, mullite and anorthite
come from the kaolin, calcite and other mineral of the natural clay (mineral kaolinite, Al2Si2O5 (OH) 4) as follows:
Table 3. Clay mineral transformation as a function of temperature firing (Cultrone 2001)
MINERALS TRANSFORMATION
Metakaolin: Al2Si2O7 Temperature of formation: 550-600°C Mullite: Al6Si2O13 Temperature of formation: 1050°C Gehlenite: Ca2Al2SiO7 Chemical reaction: +
Calcium oxide
Temperature= 800°C
Anorthite: CaAl2Si208 Temperature= 900°C
Also important to note is that kaolinite deposits are associated with quartz and non-decomposed feldspars.
Some silicates are linked too: anorthite and albite for example. Both are part of the plagioclase solid solution series one in the calcium-rich end member (anorthite) and the other in the sodium-rich end member (albite: Na (Si3Al) O8), figure 10.
Figure 10. Scale of albite transformation into anorthite state in function of the fraction of calcium (www.minerals.net/mineral/plagioclases.aspx)
Most of these elements are not pure but combined with other elements such as magnesium, sodium, iron, potassium, with traces of titanium and manganese.
Regarding the different spectra, figure 9, one can say that the most recent the ceramics are, the simplest their phases composition is, table 2. That retrieves information about the selection of raw materials (purity of the clay) for the body and control of reactions during firing (in line with the actual mastering of these technologies).
In the case of sample (1), one can say that the clay used was probably kaolin with high purity kaolinite, fired around 1050°C as mullite is the only silicate present. While sample number (3), contains three derivatives of the kaolinite that shows either wider span of temperature or heterogeneity of composition. The presence of calcite in the composition indicates a low firing temperature and the broad phase composition corroborates the use of less pure clay.
PERCENTAGE OF CALCIUM
XRD composition MSJ-TILE-3 25-REST (1)
- Quartz: SiO2, Mullite: Al6Si2O13 ESG-POT-3 24 (2)
- Quartz: SiO2, Diopside: Ca (Mg,Al)(Si,Al)2O5, Anorthite : Ca(Al2Si2O8) RMS-TILE-3 31- 3C (3)
- Quartz: SiO2, Diopside: Ca (Mg,Al)(Si,Al)2O5, Gehlenite : Ca2 (Al(AlSi)O7), Anorthite : Ca(Al2Si2O8), Mullite: Al6Si2O13
MSJ-TILE-3 25- 3C (4)
- Quartz: SiO2, Calcite : CaCO3, Albite : Na(Si3Al) O8, Gehlenite : Ca2 (Al(AlSi)O7), Hematite: Fe2O3, Diopside: Ca (Mg,Al)(Si,Al)2O5, Mullite: Al6Si2O13
Figure11. X-ray diffraction results of the samples pastes
2. The glazes
2.1Scanning Electron Microscopy
In the SEM microscopy of the glazes, two kinds of surfaces were analyzed: (a) the cross-section where the samples were cut in two parts in order to give access to the glaze and to the paste, and (b) the face of the glaze surface to access to the different part of the glaze (drawings, coloured areas…).
2.1.1Cross-sections
Glazes are calco-sodic siliceous and silica lead glazes. All samples present silicon (Si) and calcium (Ca) but only the samples (2) and (4) have sodium (Na) in sufficient quantity to appear in the spectra. The silicon is the main constituent of the glazes and it becomes the element with the highest intensity with EDS.
One find lead (Pb) and zinc (Zn) in sample 1 and 3 that are silica-lead glazes. These two fluxing elements are used in order to give to the glaze one particular melting point. The study of the ratio Si/Pb gives information about the viscosity of the glaze; the higher the silicon rate, the higher the viscosity, the lowest the fusibility is.
Another category of common used elements are the opacifiers; making the glaze not transparent. In the samples one found the two kinds of opacifiers: in the samples (1) and (3) the zirconium (Zr) and in the sample (2) the tin (Sn). The absence of any opacifier in the sample (4) can be explained by the heterogeneous repartition of tin as opacifier.
Other elements that were also found in the glazes can be explained by diffusion from the paste (Al, Ba) or from the colouring ingredients (Fe).
With their “common” composition and their higher content of lead samples (2) and (4) follow the oldest formulation of glazes were the silica lead glazes in adapted to the thermal expansion of calcia-rich paste (Figueiredo, 2009).
Cross-section EDS general
MSJ-TILE-3 25-REST (1)
ESG-POT-3 24 (2)
RMS-TILE-3 31- 3C (3)
MSJ-TILE-3 25- 3C (4)
Figure 12. Images obtained with SEM and EDS of the glazes samples
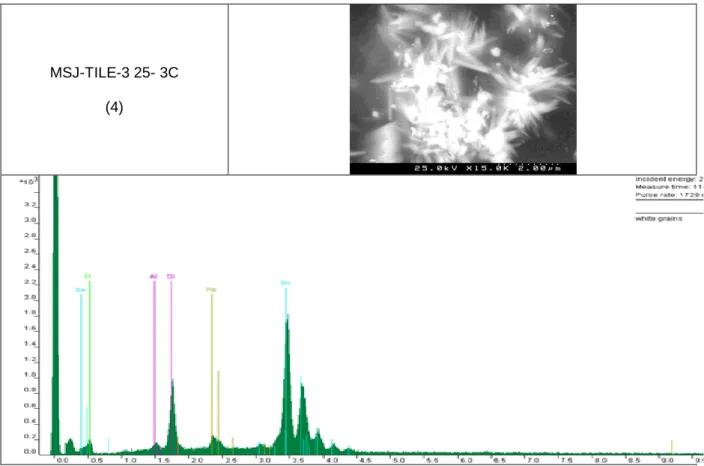
With respect to the morphology of the glazes, one can say that the glaze of samples (2), (3) and (4) have the same aspect with a homogeneous distribution of dark inclusions (SiO2) and also of white grains (explained in the following). The white grains and the black inclusion present in the sample (4) are unequally dispersed in the glaze. Whereas the black inclusions are in all the samples made of quartz (SiO2); the white grains have different compositions. EDS analysis of the white precipitates of sample 3 supports the composition as based on zinc.
One can see an evolution between those three samples in figure 13: the white grains of the opacifier of sample (1) and (2) have a circular shape, the white grains of sample 2 being more markedly packed. The sample (4) has opacifier grains of a total different shape; they are circular and clusters in circles. This morphological difference can be explained by difference in composition and firing conditions.
The opacifier regions of sample (2) and (4) have similar composition with tin.
The crystalline inclusions of white contrast of sample (1) figure 13 are composed of many different elements some already found in the corresponding cross-section EDS spectrum, figure 12. The presence of zinc and zirconium as the main opacifiers is matched by equal amount of cobalt and chromium and iron that are the base of the colouring pigments (blue and dark blue).
samples White grains-SEM
MSJ-TILE-3 25-REST (1)
ESG-POT-3 24 (2)
MSJ-TILE-3 25- 3C (4)
Figure 13. White crystals images obtained with SEM and EDS of the glazes samples
2.1.2 Face
The scanning images of the face in figure 14 are used to establish the composition of the different coloured areas or drawings of the glazes (the corresponding EDS spectra are found in Annex 1). The EDS of the samples (2) and (3) show the same composition as in the analysis made in cross-section, the case being different for the sample (1) and (4), figures 12 and 13. The SEM analyses of the glaze surface of sample 2 and 3 might have missed the coloured areas.
The sample (1) has three distinct zones (see figure 14). The zone with the line seen figure 7-a (probably painted) has the same composition as the glaze. The second zone with the deep blue has coarse quartz inclusions figure 14. One can say that the titanium, the lead, the iron and the barium are coming present in the deep blue zone with a rough surface and less shining aspect.
sample surfaces MSJ-TILE-3 25-REST (1)
ESG-POT-3 24 RMS-TILE-3 31-3C MSJ-TILE-3 25- 3C (4)
Dark blue Whitish blue
Figure 14. Face images obtained with SEM and EDS of the glazes samples
Of the sample (4), only the dark blue and the whitish blue part of the glaze were analysed. The places where EDS were taken in the bluish white area shows the regular elements found in the cross section of the glaze added with cobalt, nickel, iron and antimony. Besides the blue colouring, the yellow colour linked to Sb may have also diffused to that point. Cobalt oxide is the most common pigment used to make the blue colour.
3. Conclusion
The SEM/EDS and XRD analyses show different composition and morphology of the four samples. Because of complex composition, thickness and decoration style and the presence of modern elements (barium…) one can say that the sample (1): MSJ-TILE-3 25-REST and (3): RMS-TILE-3 31-3C are the most recent tiles of this series. On the contrary, the not so precise composition the sample (4), its thickness and the blue-yellow colouring on white glaze (Basso, 2009) indicates that it is from older sample. It is more difficult to set the age of sample (2: ESG-POT-3 24; it has tin as opacifier.
Chapter 4 – Mértola samples
1. Historical context
1.1 “Cuerda seca”
1.1.1Technical characteristics
The “cuerda seca” technique as part of the glazed decoration styles has some specific characteristics that make the difference. There are different ways to make a glazed decor: the decoration made of paint or glaze can be covered by a transparent glaze or applied on the (opaque) glaze, but after firing, glaze and decoration always become just one vitreous layer. One finds this technique on green and manganese decoration. That is the main difference with “cuerda seca”.
In “cuerda seca” decoration, all the surface of the ceramics presents a décor made of painted lines and glazes directly applied on the clay body. There are two types of “cuerda seca”: partial “cuerda seca” where the biscuit is visible and the total “cuerda seca” where the decoration covers the entire surface of the piece. A black line surrounds the drawings and is used to separate apart the different colours of the glaze and prevent their mixing. The line is directly applied on the clay and after firing it is not glazed which differs from the green and manganese decoration technique. The line was made of a mixture of manganese oxide with a blend of animal and vegetal fat that burnt during firing, leaving a black mark. After firing, the coloured glazes, mostly of lead-silica type, become vitrified, but not the “cuerda seca” line, that giving to the décor a relief aspect (Claire Déléry, 2006).
1.2Decoration
1.2.1Glaze
Glazes are important sources of information to study the evolutions of “cuerda seca” potteries throughout time. Indeed, glazes present different behaviour depending on their composition that varies from one colour to another.
Claire Delery (2006) provides additional details about the different types of glaze in use and their firing.
Glazes are composed of silica, which is vitrified at very high temperature. Fluxing agents such as PbO are mixed with silica to decrease glass melting point. The role of added glass modifiers (Na, K, Ca) is to stabilize the non-vitrifying components. Other metal oxides such as ZnO or PbO are also in use to give the glaze a specific melting temperature. Finally, the addition of opacifiers such as tin oxide makes the glaze non-transparent.
The Si/Pb ratio is systematically calculated as it gives information on the viscosity of the glazes. Indeed, when this ratio is higher than 1, the silicon content is higher than that of lead and the viscosity of the glaze increases. On the contrary, the higher the lead content is the lower the viscosity of the
elements, including lead, evaporate modifying the original composition of the glaze. In addition, lead has the tendency to migrate to the clay body and Si, Al, Ca to the glaze. This exchange modifies the viscosity and the melting temperature of the glazes with firing time (Déléry 2006).
“Cuerda seca” glazes are typically composed of three colours: white, yellow and blue-green plus the black for the “cuerda seca” lines themselves. For each colour, the compositions of the glazes vary with addition chromogen ionic compounds. The greens are obtained by adding copper and iron / or just copper (Claire Déléry 2006). The dark green can be obtained by increasing the amount of iron or by increasing the thickness of the glaze. The turquoise is obtained with copper, iron and tin, the late being an opacifier. The natural green and dark green are obtained by varying the proportions of copper and iron respectively (~ 2% and 3% and 3% and 1%). The yellow or honeys are tin free glazes coloured with antimony or iron from clays and manganesium. The whites are obtained through a high tin content in the absence of chromogen ions.
1.2.2Firing
The potteries can be fired in two different processes, the single step firing and double firing. The double firing process is done in two steps: the ceramic body is first fired without the glaze and second time fired with the glazed decoration. While in single firing, the ceramic with glazing applied on the dried body is fired in just one high temperature cycle. Single firing is usually dictated by economic savings.
The firing process is an important part of production of ceramics as it leads to differences not just in morphology but also in chemical composition of the glazed layers. Indeed, with double firing potters obtain an interface around 20 and 30 µm, whereas with single firing with fritted glazes the interface obtained is wider, between 70 and 100 µm. In the second case, the interface becomes enlarged by the precipitation of several phases due to the reaction between the ceramic body and the glaze (Claire Déléry 2006).
Differences in firing process also lead to differences in colors; clays may contain iron which gives different colors according to the temperature, time of exposure to heat, oxidizing/reduction in the furnace atmosphere and the presence of other elements (Ca, Ti, ...) that change redox conditions of the material. Therefore, one can observe that ceramics coming from double firing are clearer than in single firing due to a lower oxidation state of iron (Claire Déléry, 2006).
2. Samples
The panel is composed of six samples from between the XIth and XIIIth centuries of the archaeological site Mértola. The pieces were found under a Christian cemetery and a sceptic pit. Four of the samples are partial “cuerda seca” and the remaining ones are total “cuerda seca”.
CR/CSP/0023 HBR-0206 HBR-0001
CR/CSP/0022 HBR-0207 HBR-0072
Figure 15. Optical pictures of the six cuerda seca samples
The samples CR/CSP/0023 and HBR-0206 are partial “cuerda seca”. The glaze of sample CR/CSP/0023 is a blue/green glaze delimited by perfect black lines of “cuerda seca”. In spite of the similarities of the perfectly drawn black line of “cuerda seca”, the sample HBR-0206 seems to have a different glaze. The glaze of this sample has a white/green color that seems to be over-fired (rough surface) while the firing temperature of sample CR/CSP/0023 seems to be better adjusted to the glaze.
The sample HBR-0001 is partial “cuerda seca”. The glaze of this sample is in a higher state of degradation than in the two previous samples. The “cuerda seca” is still visible but it is difficult to determine the differences in the color of different glazed areas. Close inspections indicates that the glaze is made of two colors, green and white, separated by “cuerda seca” lines.
HBR-0207 is a total “cuerda seca” and HBR-0072 presents a brown line-like contrast on the circumference relief. The piece HBR-0072 (probably a “jarred”) is covered by a homogeneous green glaze and separated in two areas by a brownish line. The decor of sample HBR-0207 is composed of areas of white and a green glazes separated by “cuerda seca” lines. The difference between the vitreous green (a) and the other zones in green (b) can be explained by the advanced alteration state or because the piece actually has glazes of two different compositions.
Sample CR/CSP/0022 (figure 15) is the whitest piece of the set in visual inspection and also the one of more elaborated drawings. The clear color of the clay surface can come from the kaolinite or derivate materials (3. 2).
a
b
c
The piece CR/CSP/0022 is a partial “cuerda seca”. The drawings of the pottery piece are well preserved. One can observe the lotus flower in the middle of circles (c) and palms separating these elements, the glaze being properly surrounded by “cuerda seca” lines. The glaze seems to be composed of three colors: the blue/green of the palms, the vitreous green in one lotus flower and the black area of the other flower. One is not sure about the black color of this second area; it may come from a firing or glazing accidents, or might have been intentional with some aesthetic purpose.
3. Results
In the following, the results of the study of six samples will be divided into three parts. The EDS analyses showed important quantities of phosphor in the glazes under different forms. Phosphor may lead to a phase separation in the glazes depending on the content in silicates versus phosphorous/lead/calcium phases. The phosphorous phases are characterized by specific ratio of the Pb, P, Ca ions. Two types of morphology were identified.
Therefore, the samples were regrouped by their similarities of morphology phosphor containing areas of their glazes: the samples CR/CSP/0023 and HBR-0001 are grouped together because they showed a visible stratigraphic effect, the samples CR/CSP/0022 and HBR-0206 because of spheres that look like precipitates of phosphorous matter and finally, the samples HBR-0207 and HBR-0072 with their phosphorous sediment layers on the surface of their glazed layers.
It is generally accepted that the phosphorous matter in archaeological ceramics comes coming from runoff water (Clare Déléry, 2009). However, from the results obtained here one may wonder if bone ashes as raw material for low melting point ceramic glazes were already in use. From such perspective, the distinction between technical phosphor and phosphate sediments could be made.
The figures were taken by SEM microscopy with different magnifications. The magnification of each SEM image is indicated below the figure [example: x400]. For each samples several images of the different zones of the samples were taken (tables 18, 19, 22, 23, 24 and 25).
Some of the SEM images were taken in facing (showing only the surface of the glaze) and the others in cross-section (showing the inside of the glaze of the paste). Sometimes, one image corresponds to several EDS spectra because it shows diverse interesting details.
Results of XRD analyses for each of the six samples are given in table 4. These results will be commented in the following subsections of this chapter.
Table 4. XRD of the pastes of the six samples
Sample paste quartz diopside anorthite augite gehlenite mullite
CR/CSP/0023 x - x - x x HBR-0001 x - x x x - CR/CSP/0022 x - x x x - HBR-0206 x - x - x x HBR-0072 x x x x - - HBR-0207 x - x x - -
3.1 Colorimetric analysis of the paste
3.1.1UV- spectroscopy
Figure 16. Ultra-violet spectra of the samples CR/CSP/0023, HBR-0206, CR/CSP/0022, HBR-0072, HBR-0207 and HBR-0001
The spectroscopy was used to determine region of absorption of the samples. It allows one to know if the samples have the same color or not, but does not give the exact color.
CR/CSP/0023 HBR-0206 CR/CSP/0022 HBR-0072 HBR-0207 HBR-0001
Figure 17: electromagnetic spectrum corresponding to the visible range
According to the visible part of the spectra in figure 8, one can see three categories of samples with: - absorption around 600 nm corresponding to orange/red,
- absorption around 500 nm corresponding to green/yellow, - absorption around 400 nm corresponding to pink.
3.1.2CIEL*a*b* coordinates
For present study, color of the pastes of six samples was analysed in order to understand links that could exist between them and be able to group samples.
Table 5. Results of the CIELab analyses of color of the ceramic bodies of the archaeological samples
HBR-0072 HBR-0207 CR/CSP/0022 HBR-0001 HBR-0206 CR/CSP/0023
L* 79.92 97.33 50.11 55.49 51.67 55.76
a* -4.96 -4.77 -2.39 5.43 10.25 9.10
b* 27.26 27.01 18.14 22.89 27.28 25.83
Samples HBR-0206 and CR/CSP/0023 have close chemical compositions (see XRD analyses in table 4). As they also have similar a* and b* coordinates (giving the color) but slightly different luminance; we can assume that the sample HBR-0206 of lower L* was fired at higher temperature than the sample CR/CSP/0023 of higher L*. This hypothesis will be investigated with the help of XRD results below.
According to the CIELab coordinates scheme and with the direct observation of the samples, one can say that the pieces CR/CSP/0023 and HBR-0206 (figure 15) are made of red clay. Red clays are usually composed of high proportions of hematite and calcite. To determine their composition, the ceramic bodies were studied by XRD and SEM, this results being presented below in the part (3.2/3).
The CIELab coordinates scheme shows that the sample HBR-0001 (figure 15) has a pinkish component of color. This result is interesting because in the visual inspection the surface of the
ceramic body looks whitish. The color determined by color spectrometry can be again explained because of its content in iron, as seen in the following (3. 2).
The results of color analysis of the paste of the samples HBR-0207 and HBR-0072 (figure 15) show greenish components integrating their colors. Such colors are coming from the mixture of the koalinite clay with added elements (see 3. 3).
3.2CR/CSP/0023 and HBR-0001
3.2.1Microscopy
These two samples show a specific glaze morphology that forms fine bands or a “stratigraphy” as shown in the following.
For the sample CR/CSP/0023 the selected images in figure 18 show:
- in figure A, the paste and the distribution of pores of the paste. The EDS of the paste detected the presence of elements of main silicates, namely kaolin, and iron.
- in figure B, in a general view of the glaze taken in cross-section is shown. This image can be split into three parts: the interface (in grey above the ceramic body), some black inclusions and the grey matrix. The composition at the interface corresponds to a regular silica-lead glaze base with tin oxide as opacifier (silicates, lead, calcium and tin) [table 7]. Besides tin oxide, precipitates of lead and calcium compounds are usually use as opacifiers and correspond to the white crystals. The sample shows also small proportion of copper (1, 5% and 2, 7%) homogeneously distributed in the glaze corresponding to the pigments that yield blue colour to the glaze. The big black inclusions at the top (1) of the glaze and the two other elongated (2 and 3) in the middle are quartz grains. The two others parts (grey matrix and black zones) are detailed in figures C, D and F.
- in figure C, details the top of the glaze are shown. One can see at the top of the image “lines” detailed and analyzed in the figure E, the dark grey zone being detailed in the figure D and the grey matrix detailed in the figure 18-F.
- in figure D, the dark grey zone has the same composition [table 6] as the glaze in general (silicates, iron, copper from the pigments, lead and tin as main opacifier). The absence of phosphor in those zones is noted; that may correspond to a part of the glaze blend that did not react with phosphor because of a heterogeneous mixing of the powders or because the glass may tend to separated into different glassy phases during firing.
It is interesting to note that the composition at the top of the glaze layer (figure E) and the composition of the glaze (figure F) are the same. The same ratio Pb/Ca/P [table 7] is determined in these two parts