UNIVERSIDADE DE LISBOA
Instituto de Geografia e Ordenamento do Território
Vulnerability Assessment and Landslide Risk Analysis. Application to
the Loures Municipality, Portugal
Clémence Guillard-Gonçalves
Orientador: Prof. Doutor José Luís Gonçalves Moreira da Silva Zêzere
Tese especialmente elaborada para a obtenção do grau de Doutor em Geografia, especialidade de Geografia Física.
Júri:
Presidente: Profª. Doutora Maria Lucinda Cruz dos Santos Fonseca Vogais:
- Prof. Doutor Lúcio José Sobral da Cunha
- Prof. Doutor Alexandre Manuel de Oliveira Tavares - Prof. Doutor Carlos Valdir de Meneses Bateira
- Prof. Doutor Fernando Manuel Silva da Fonseca Marques - Prof. Doutor José Manuel Moreira da Silva Zêzere
Esta dissertação foi financiada pela Fundação para a Ciência e Tecnologia integrando-se no âmbito da bolsa de Doutoramento SFRH/BD/64973/2009
i
Preamble
The three chapters of the thesis are the full contents of three papers which were published in different ISI indexed peer reviewed journals. That is why the written English (American English or UK English) may vary from one to the other. In order to ease the reading, the format was harmonised and figures and tables were renumbered.
My contribution to the three papers is:
Chapter 1: Guillard, C. and Zezere, J.: Landslide susceptibility assessment and validation in the framework of municipal planning in Portugal: the case of Loures Municipality., Environ. Manage., 50(4), 721–735, doi:10.1007/s00267-012-9921-7, 2012.
The inventory of the 313 landslides coming from the interpretation of orthophotomaps and the inventory of the 70 landslides coming from the stereoscopical interpretation of aerial photographs were made by myself, as well as the differentiation of the depletion and accumulation zones, following the advice of José Luís Zêzere and an anonymous reviewer. I applied the Information Value Method, plotted the success and prediction rate curves and gathered the most susceptible zones which integrated the National Ecological Reserve. I interpreted and discussed the results together with my co-author.
Chapter 2: Guillard-Gonçalves, C., Cutter, S. L., Emrich, C. T. and Zêzere, J. L.: Application of Social Vulnerability Index (SoVI) and delineation of natural risk zones in
Greater Lisbon, Portugal, J. Risk Res., 18(5), 651–674,
doi:10.1080/13669877.2014.910689, 2015.
I chose the study area, selected the 46 socioeconomic variables, ran the correlations, applied the Principal Component Analysis, selected and interpreted the principal components and mapped the SoVI following the advice of Susan Cutter and Chris Emrich. I elaborated the total susceptibility map, the risk zones map and the exposed population map on the advice of José Luís Zêzere. I elaborated the matrix for delineation or risk zones and I interpreted and discussed the results together with my co-authors.
Chapter 3: Guillard-Gonçalves, C., Zêzere, J. L., Pereira, S. and Garcia, R. A. C.: Assessment of physical vulnerability of buildings and analysis of landslide risk at the municipal scale – application to the Loures municipality, Portugal, Nat. Hazards Earth Syst. Sci., 16(2), 311–331, doi: 10.5194/nhess-16-311-2016, 2016.
Following the advice of José Luís Zêzere, I elaborated a questionnaire, sent it to more than 300 European landslide experts and interpreted the answers. I listed all the buildings of the test site during field work. I created a map with the Location Coefficient based on the one of the Portuguese Tax Services. I applied the Information Value Method to the deep-seated slides inventory and I calculated the probability of occurrence of the deep-seated and shallow slides. I mapped the vulnerability, the standard deviation, the value of the buildings and the risk. I interpreted and discussed the results together with my co-authors.
ii
Aknowlegments
I would like to thank all the persons who contributed to the realization of this work.
Among them, I specially thank my advisor the Professor José Luís Zêzere for his support, his recommendations and his availability.
I am also grateful to the Professors Susan Cutter and Chris Emrich for their advice regarding the SoVI application, and the HVRI research team for their help and advice
I thank the members of the RISKam team, and especially Susana Pereira, Ricardo Garcia, Sérgio Oliveira, Raquel Melo, Teresa Vaz, Cristina Henriques, Aldina Piedade and Jorge Rocha for their advice and friendship.
I would like to express special thanks to Tiago Santos for his help and company during field work.
Finally, I thank my family members and my friends from the bottom of my heart for their support and patience.
This work was funded by Fundação para a Ciência e Tecnologia through PhD grant SFRH/BD/64973/2009.
Esta dissertação foi financiada pela Fundação para a Ciência e Tecnologia integrando-se no âmbito da bolsa de Doutoramento SFRH/BD/64973/2009
iii
Abstract
The present study aims to develop a method for assessing the landslide vulnerability at the municipal scale which supports the landslide risk analysis.
Three susceptibility assessments to deep-seated rotational and translational slides and to shallow slides in the Loures municipality are presented in the first chapter. A bivariate statistical method called Information Value Method was used to cross the 686 inventoried landslides with seven predisposing factors (slope angle and aspect, plan slope curvature, inverse of the topographic wetness index, geology, soil types and land use). The accuracy and the robustness of the models were assessed by success and prediction-rate curves. The 20.3% of the municipality where 70% of the future landslides should occur according to the susceptibility models were selected to be included in the National Ecological Reserve.
The second chapter presents a study of the social vulnerability of the 149 civil parishes of the Greater Lisbon. The method used is the Social Vulnerability Index (SoVI) method, which consists in selecting socioeconomics variables, removing the auto-correlated variables and applying a Principal Component Analysis (PCA). The seven principal components resulting from the PCA were interpreted and the SoVI values were classified based on standard deviation. The risk delimitation was effectuated by combining the SoVI map with the susceptibility maps of the main natural hazards which threaten the Greater Lisbon (earthquakes, floods, flash floods, landslides, tsunami, and coastal erosion). The exposition of the population was finally considered by combining the number and location of the residents with the risk zones map.
The third chapter shows a physical vulnerability assessment of the Loures municipality buildings for different landslide magnitudes. The average of the vulnerability attributed by a pool of European landslide experts and by a sub-pool of landslide experts who know the study area on the basis of the structural type of the buildings was used. The variability of the answers was assessed by standard deviation calculation. Then, the economic value of the buildings was assessed based on the Portuguese Tax Services approach. In addition, the landslide hazard was calculated by combining the landslides spatiotemporal probability and their frequency-magnitude relationship. Finally, the landslide hazard was combined with the vulnerability and the value of the buildings in order to obtain the landslide risk.
In the conclusion section, the social vulnerability and the physical vulnerability of the Loures municipality were combined twice. First, the considered social vulnerability was extracted from the second chapter results; its scale is the civil parish scale. Second, a new social vulnerability assessment was made at the basic geographic entity (BGRI) scale. Finally, the landslide risk was analysed considering the total vulnerability provided by the combination of the physical vulnerability and the new social vulnerability assessment, the landslide susceptibility, the exposition of the population and the economic value of the buildings.
iv
Résumé
La présente étude a pour but de développer une méthode d'évaluation de la vulnérabilité à l'échelle municipale qui servirait de base à une évaluation de risque de glissements de terrain.
Trois évaluations de la susceptibilité aux glissements de terrain plans et rotationnels profonds et aux glissements de terrain superficiels de la municipalité de Loures sont présentées dans le premier chapitre. Une méthode statistique bivariée appelée Méthode des Valeurs Informatives a été utilisée pour croiser les 686 glissements de terrain qui ont été inventoriés au sein de la municipalité de Loures avec sept facteurs de prédisposition (inclinaison et orientation des pentes, concavité/convexité des pentes, inverse du topographic wetness index, géologie, types de sols et occupation du sol). La justesse et la robustesse des modèles ont été évaluées par des courbes de réussite et de prévision. Les 20,3% de la municipalité où les 70% des futurs glissements devraient avoir lieu ont été sélectionnés pour intégrer la Réserve Écologique Nationale.
Le deuxième chapitre présente une évaluation de la vulnérabilité sociale au sein des 149 paroisses civiles de la Grande Lisbonne. La méthode utilisée est l'Indice de Vulnérabilité Sociale (SoVI), qui comprend une sélection de variables socioéconomiques, le retrait des variables corrélées et l'application d'une Analyse en Composantes Principales (ACP). Les sept composantes principales qui proviennent de l'ACP ont été interprétées et les valeurs de SoVI ont été classées sur la base des écarts types. La délimitation du risque a été effectuée en associant la carte de SoVI avec la carte de susceptibilité des principaux aléas naturels qui menacent la Grande Lisbonne (séismes, inondations, crues éclaires, mouvements de terrain, tsunami et érosion côtière). Enfin, l'exposition de la population a été prise en compte par la superposition du nombre d'habitants et de leur lieu de résidence avec la carte des zones de risque.
Le troisième chapitre montre une évaluation de la vulnérabilité physique des bâtiments de la municipalité de Loures associée à des glissements de terrain de différentes magnitudes. La moyenne de la vulnérabilité attribuée par un groupe d'experts européens et par un sous-groupes d'experts qui connaissent la zone d'étude et qui se base sur le type de structure des bâtiments a été utilisée. La variabilité des réponses a été évaluée par le calcul des écarts types. Puis, la valeur économique des bâtiments a été calculée en se basant sur l'indice de calcul des Services de Taxes Portugais. De plus, l'aléa glissements de terrain a été associé à la vulnérabilité et à la valeur des bâtiments pour obtenir le risque de glissements de terrain.
Dans la section de conclusion, la vulnérabilité sociale et la vulnérabilité physique de la municipalité de Loures ont été réunies en considérant deux approches différentes. Lors de la première approche, la vulnérabilité sociale considérée a été extraite des résultats provenant du deuxième chapitre ; elle est à l'échelle de la paroisse civile. Lors de la deuxième approche, une nouvelle évaluation de la vulnérabilité sociale a été effectuée à l'échelle de l'entité géographique de base (BGRI). Finalement, le risque de glissements de terrain a été analysé considérant la vulnérabilité totale provenant de l'association de la vulnérabilité physique et de la nouvelle évaluation de la vulnérabilité sociale, de la susceptibilité aux glissements de terrain, de l'exposition de la population et de la valeur économique des bâtiments.
Mots-clefs : Susceptibilité aux glissements de terrain, vulnérabilité sociale, vulnérabilité
v
Resumo
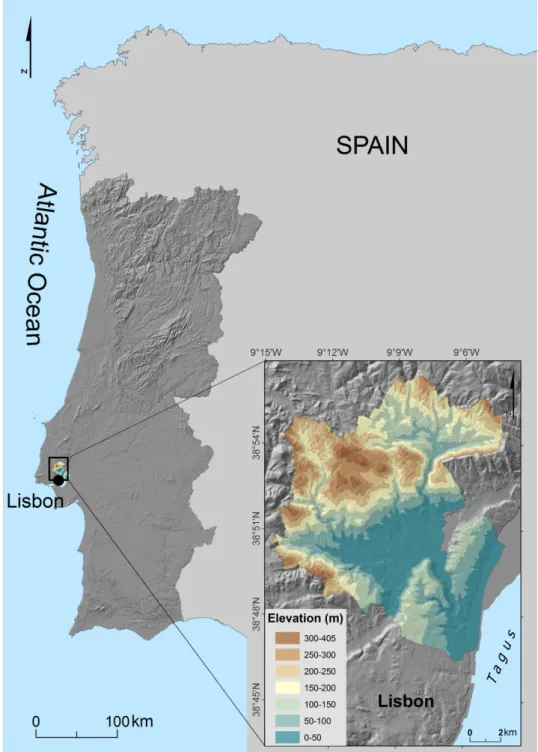
A presente tese de doutoramento pretende aprofundar a avaliação da vulnerabilidade a deslizamentos e a análise do risco de deslizamentos à escala municipal. O risco é considerado como sendo o produto da perigosidade, da vulnerabilidade e do valor dos elementos em risco. A principal área de estudo corresponde ao município de Loures (169,3 km²), situado na região a norte de Lisboa (Portugal).
No primeiro capítulo é aplicada uma metodologia para avaliar a suscetibilidade a deslizamentos, numa perspetiva de aplicação prática ao nível municipal. A suscetibilidade a deslizamentos é a expressão da propensão da ocorrência do deslizamento numa área dada, com base em características do terreno, não considerando o período do retorno ou a probabilidade de ocorrência dos fenómenos de instabilidade. A sua avaliação é baseada no princípio que os deslizamentos futuros têm uma probabilidade de ocorrência mais elevada sob circunstâncias similares àquelas que determinaram a instabilidade passada e presente. Um inventário de 686 deslizamentos que ocorreram no município de Loures entre 1967 e 2004 foi elaborado a partir de três fontes: (1) 313 deslizamentos foram derivados da interpretação de ortofotomapas digitais pormenorizados (pixel = 0.5 m), combinados com a representação detalhada da elevação do terreno (curvas de nível espaçadas a cada 5 m); (2) 70 deslizamentos resultaram da leitura estereoscópica de fotografias aéreas obtidas em 1983 na sequência de um evento chuvoso intenso que desencadeou muitos deslizamentos na região a Norte de Lisboa; (3) 303 deslizamentos resultaram de um inventário efetuado em 1996 por Zêzere (1997) em duas zonas do município de Loures a partir de ortofotomapas e foram validados no terreno por trabalho de campo. O inventário total foi separado em três grupos para elaborar três modelos de suscetibilidade de acordo com os tipos de deslizamentos (rotacionais, translacionais profundos e translacionais superficiais). Para a avaliação da suscetibilidade a deslizamentos, assume-se que a distribuição espacial dos deslizamentos futuros pode ser prevista através de relações estatísticas entre os deslizamentos passados e um conjunto de fatores de predisposição da instabilidade geomorfológica; neste estudo, o declive, a exposição e a curvatura das vertentes, o inverso do wetness index, a geologia, os tipos de solo, e o uso do solo foram selecionados. A suscetibilidade é avaliada usando algoritmos baseados numa análise estatística bivariada (Método do Valor Informativo) sobre unidades de terreno de condição única, numa base matricial. A robustez e a exatidão dos modelos de suscetibilidade criados foram validadas pela construção de taxas de sucesso e de predição. A legislação que exige a avaliação da suscetibilidade a movimentos de massa em vertentes em Portugal a nível municipal é a Reserva Ecológica Nacional (REN). As zonas mais suscetíveis foram extraídas a partir dos três mapas de suscetibilidade, e os resultados obtidos permitem concluir que 70% dos futuros deslizamentos devem ocorrer em 20,3% da área total do município classificadas como mais suscetíveis a deslizamentos. Deste modo, a inclusão desta área mais suscetível na REN poderá potencialmente reduzir os danos resultantes de 70% dos futuros deslizamentos no município de Loures.
As metrópoles são altamente vulneráveis aos perigos, pela concentração de população, de infraestruturas críticas e de atividades económicas. Em Portugal, muitos serviços são centralizados na Grande Lisboa, onde 19% da população total vive em apenas 1,5% do território (1376 km2). O segundo capítulo apresenta um estudo que tem como objetivo aprofundar a avaliação dos riscos naturais na Grande Lisboa, através de uma abordagem multirriscos. Em primeiro lugar foi avaliada a vulnerabilidade social das 149 freguesias da Grande Lisboa, onde se integram as 18 freguesias do município de Loures. Com efeito, a avaliação da vulnerabilidade das populações pode ajudar os responsáveis do planeamento da emergência a perceber quem é vulnerável a desastres naturais, para
vi
que possam preparar uma evacuação realista e eficaz e procedimentos de resposta para os indivíduos expostos ao risco. O método de avaliação que foi utilizado e adaptado ao contexto português é o SoVI (Índice de Vulnerabilidade Social). Deste modo, numa primeira fase foram escolhidas 46 variáveis socioeconómicas, e 38 delas foram mantidas, depois de aplicar testes de auto-correlação. As 38 variáveis não-correlacionadas foram estandardizadas e uma Análise em Componentes Principais (ACP) foi aplicada, seguida de uma rotação Varimax. Sete fatores que resultaram da ACP e que explicam 79.5% da variância foram extraídos usando o critério de Kaiser. Cada fator foi interpretado e um sinal foi atribuído tendo em consideração se o fator é responsável pelo incremento ou pela diminuição da vulnerabilidade social. O SoVI foi calculado somando os fatores e foi mapeado utilizando uma classificação baseada na média e desvio padrão dos resultados obtidos. Doze das 149 freguesias da Grande Lisboa foram classificadas como tendo uma vulnerabilidade social muito elevada, e 24 como tendo uma vulnerabilidade social elevada. O mapa de SoVI foi combinado com o mapa de suscetibilidade a perigos que ameaçam a Grande Lisboa (sismos, cheias rápidas e progressivas, movimentos de vertentes, tsunami e erosão costeira), o qual foi baseado nos trabalhos elaborados no âmbito da revisão do Plano Regional de Ordenamento do Território da Área Metropolitana de Lisboa (PROT-AML). As zonas de risco foram traçadas a partir do cruzamento dos mapas de SoVI e de suscetibilidade total, permitindo assim destacar as áreas que necessitam de uma atenção especial em termos de planeamento de emergência. Vinte e duas freguesias da Grande Lisboa têm um risco muito alto, cujas 17 fazem parte do município de Lisboa, quatro do município de Loures e uma do município de Vila Franca de Xira. Finalmente, a população da Grande Lisboa foi considerada e combinada com o mapa das zonas de risco, dando informações sobre o número e a localização dos residentes expostos aos riscos naturais considerados.
O terceiro capítulo apresenta uma avaliação da vulnerabilidade física dos edifícios do município de Loures a deslizamentos. O risco de deslizamentos foi calculado como sendo o produto da perigosidade, da probabilidade de magnitude dos deslizamentos, da vulnerabilidade física e do valor económico dos edifícios. Em primeiro lugar, a perigosidade foi avaliada combinando a probabilidade espaciotemporal e a relação de frequência-magnitude dos deslizamentos. Dois modelos de suscetibilidade a deslizamentos profundos e superficiais foram obtidos pela aplicação do Método do Valor Informativo. As probabilidades anuais e plurianuais foram estimadas, fornecendo um modelo de perigosidade a deslizamentos. Em segundo lugar, uma avaliação da vulnerabilidade dos edifícios a deslizamentos foi desenvolvida e aplicada ao município de Loures, com base num inquérito feito a um grupo de peritos europeus em deslizamentos. O inquérito foi baseado em nove cenários de magnitudes e quatro tipos de estrutura de construção. Um subgrupo de peritos em deslizamentos que conhecem a área de estudo foi extraído do primeiro grupo de peritos europeus, e a variabilidade das respostas provenientes do primeiro grupo e do subgrupo foi avaliada com base no desvio padrão. Além disso, a vulnerabilidade média das entidades geográficas básicas (BGRI) foi comparada pela mudança da unidade de mapeamento e aplicando a vulnerabilidade a todos os edifícios de uma zona de teste que faz parte do município de Loures, cujo inventário foi efetuado através de trabalho de campo. Em seguida, o valor económico dos edifícios foi calculado usando uma adaptação da fórmula utilizada pelos Serviços Fiscais Portugueses. Finalmente, o risco anual e plurianual de deslizamentos foi calculado para os nove cenários de diferentes magnitudes de deslizamentos e as diferentes probabilidades espaciotemporais, multiplicando a perda potencial (Vulnerabilidade × Valor Econômico) pela probabilidade de perigo. Em regra, os valores de vulnerabilidade dados pelo subgrupo de peritos que conhecem a área de estudo são superiores aos indicados pelos peritos europeus, nomeadamente para os deslizamentos de grande magnitude. As vulnerabilidades obtidas variam de 0,2 a 1 em função dos tipos de estrutura de construção e da magnitude dos deslizamentos, e são máximas para deslizamentos de 10 e 20 metros de profundidade. No entanto, o risco anual mais
vii
elevado foi encontrado para os deslizamentos de 3 metros de profundidade, com um valor máximo de 25,68 € por pixel de 5 metros, porque estes deslizamentos combinam uma frequência relativamente alta no concelho de Loures com um dano potencial substancial.
Na seção de conclusão, a vulnerabilidade social e a vulnerabilidade física do concelho de Loures foram combinadas através de duas abordagens. Na primeira abordagem, a vulnerabilidade social utilizada provem do segundo capítulo e respeita à escala da freguesia. Na segunda abordagem, uma nova avaliação da vulnerabilidade social foi feita à escala da BGRI. O risco de deslizamento foi finalmente analisado considerando a vulnerabilidade total obtida pela combinação da vulnerabilidade física e da nova avaliação da vulnerabilidade social à escala da BGRI, a suscetibilidade a deslizamentos, a exposição da população e o valor económico dos edifícios.
Em termos de aplicação, os modelos de suscetibilidade desenvolvidos no primeiro capítulo foram utilizados como base para a elaboração da REN no concelho de Loures. Isso significa que o município está ciente do perigo de deslizamentos. Além disso, exigências especiais em relação ao uso e transformação do solo (por exemplo, proibição de construção de habitação e de vias de comunicação) são aplicadas nas áreas que foram determinadas como sendo as mais perigosas pelos modelos de suscetibilidade e que integraram a REN. Os modelos de vulnerabilidade e de risco ainda não foram utilizados pelas partes interessadas, sendo certo que o mapeamento do risco proveniente do modelo de vulnerabilidade física desenvolvido no terceiro capítulo pode ser muito útil para as companhias de seguros, uma vez que considera em detalhe o valor económico dos edifícios. A proteção civil poderá estar mais interessada pelo modelo de vulnerabilidade total desenvolvido na secção de conclusão, para efeitos de planeamento de emergência. De facto, esta avaliação de vulnerabilidade fornece a localização da população mais vulnerável em grande escala, cruzada com os edifícios que têm uma alta vulnerabilidade física a deslizamentos de diferentes magnitudes.
Palavras-chave: Suscetibilidade a deslizamentos, vulnerabilidade social, vulnerabilidade
física, risco de deslizamentos.
Referência:
Zêzere, J.L.: Movimentos de vertente e perigosidade geomorfológica na Região a Norte de Lisboa. Dissertação de Doutoramento em Geografia Física, Universidade de Lisboa, 575 p, 1997.
viii
Contents
Preamble ... i Aknowlegments ... ii Abstract ... iii Résumé ... iv Resumo ... v Contents ... viii Figures ... xi Tables ... xiii 0. Introduction ... 30.1. The landslide disaster system ... 3
0.2. Landslide hazard ... 5
0.3. Vulnerability and losses due to natural disasters ... 8
0.3.1. Different facets of vulnerability ... 8
0.3.2. Potential losses ... 9
0.4. The assessment of vulnerability ... 10
0.4.1. Vulnerability representation ... 11
0.4.2. Social vulnerability to natural hazards ... 12
0.4.3. Physical vulnerability of elements at risk to landslides ... 13
0.4.4. Studies which combine social and physical vulnerability to landslides ... 14
0.5. Presentation of the work done in the present thesis ... 16
0.6. References ... 18
1. Landslide susceptibility assessment and validation in the framework of municipal planning in Portugal: The case of Loures Municipality ... 29
1.1. Introduction ... 29
1.2. Study area ... 32
1.3. Data and methods ... 34
1.3.1. Landslide inventory and probability of landslide area ... 34
1.3.2. Landslide predisposing factors ... 35
1.3.3. Modeling strategy ... 38
1.3.4. NER delimitation ... 41
1.4. Results and discussion ... 41
1.5. Conclusions ... 47
ix 2. Application of Social Vulnerability Index (SoVI) and delineation of natural risk zones in
Greater Lisbon, Portugal ... 55
2.1. Introduction ... 55
2.2. Data and methods ... 58
2.2.1. Study area ... 58
2.2.2. Data sources ... 58
2.2.3. Difficulties in adapting the SoVI concepts... 58
2.2.4. SoVI calculation ... 61
2.2.5. Susceptibility maps and total susceptibility ... 64
2.2.6. Delineation of risk zones and exposed population ... 65
2.3. Results and discussions ... 66
2.3.1. SoVI components ... 66
2.3.2. SoVI map ... 68
2.3.3. Susceptibility maps and total susceptibility map ... 70
2.3.4. Delineation of risk zones and exposed population ... 73
2.4. Conclusions ... 76
2.5. References ... 77
3. Assessment of physical vulnerability of buildings and analysis of landslide risk at the municipal scale. Application to the Loures municipality, Portugal. ... 83
3.1. Introduction ... 83
3.2. Study area ... 86
3.3. Data and methods ... 88
3.3.1. Frequency-Magnitude of the landslides, susceptibility and hazard ... 88
3.3.2. Physical vulnerability of the buildings ... 89
3.3.3. Economic value of the buildings ... 94
3.3.4. Landslide risk ... 96
3.4. Results ... 96
3.4.1. Frequency-magnitude of the landslides, susceptibility and hazard ... 96
3.4.2. Physical vulnerability of the buildings ... 100
3.4.3. Economic value of the buildings ... 106
3.4.4. Landslide risk ... 107
3.5. Discussion ... 110
3.6. Concluding remarks ... 114
3.7. References ... 115
3.8. Annex ... 120
x
4. Conclusion of the thesis ... 123
4.1. Data and methods ... 124
4.1.1. Average of the physical vulnerability and the social vulnerability ... 124
4.1.2. Assessment of the social vulnerability at the BGRI scale and its combination with the physical vulnerability ... 125
4.1.3. Landslide risk analysis ... 129
4.2. Results ... 129
4.2.1. Combination of the physical vulnerability at the BGRI scale and the social vulnerability at the civil parish scale ... 129
4.2.2. Assessment of the social vulnerability at the BGRI scale and its combination with the physical vulnerability at the BGRI scale ... 133
4.2.3. Landslide risk analysis ... 134
4.3. Discussion ... 138
4.4. Final considerations ... 140
xi
Figures
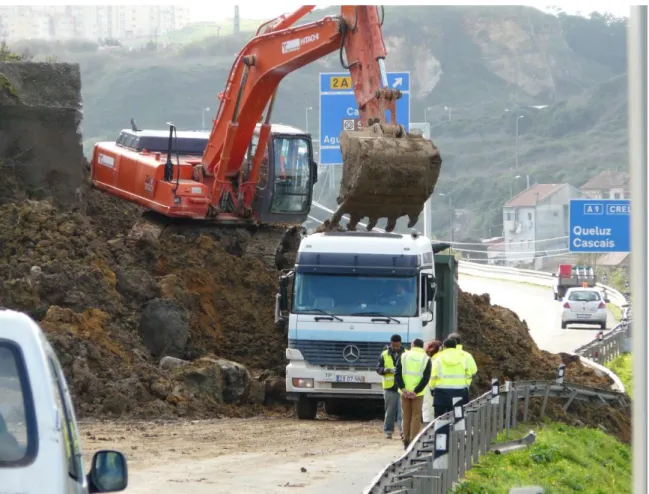
Fig. 0.1 - Damage caused by the landslide on the CREL embankment. Source: Sérgio Cruz de
Oliveira, CEG, IGOT, Universidade de Lisboa, 24/01/2010 ... 4
Fig. 0.2 - CREL interrupted by the landslide. Source: Sérgio Cruz de Oliveira, CEG, IGOT, Universidade de Lisboa, 24/01/2010 ... 5
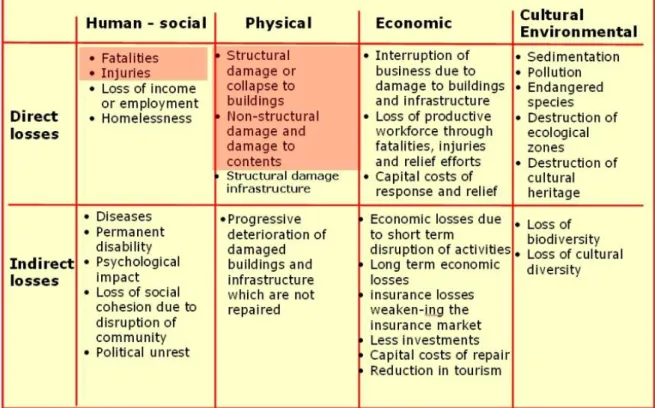
Fig. 0.3 - Overview of types of loss resulting from natural hazards. Source: van Westen and Kingma, 2009 ... 10
Fig. 0.4 - Organization of the study ... 17
Fig. 1.1 - Geographic situation and elevation of Loures Municipality ... 33
Fig. 1.2 - Landslide inventories of rotational slides (a), deep translational slides (b), and shallow translational slides (c); to facilitate visualization landslides areas were magnified. .. 39
Fig. 1.3 - Probability of landslide area (a) and probability densities (b) for deep and shallow landslides in the Loures Municipality ... 42
Fig. 1.4 - Fraction of landslide depletion area and total affected area in each class of slope angle factor (º) (a) and in each class of geological factor (see Table 1.1. for signification) (b) ... 43
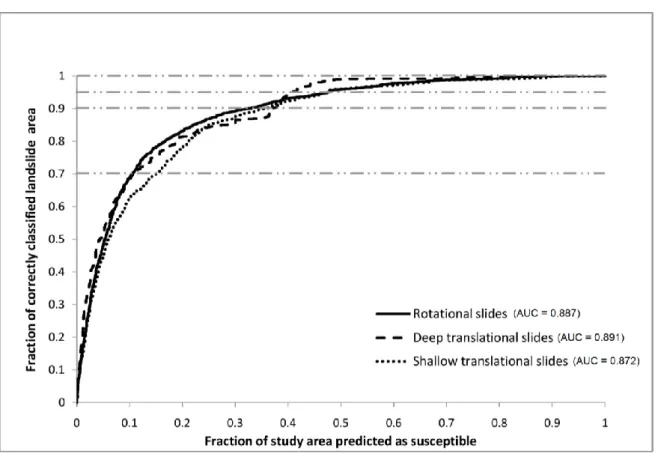
Fig. 1.5 - Prediction-rate curves corresponding to landslide susceptibility models ... 44
Fig. 1.6 - Landslide susceptibility maps of rotational slides (a), deep translational slides (b), and shallow translational slides (c) ... 46
Fig. 1.7 – National Ecological Reserve (NER) ... 47
Fig. 1.8 – Example of exposed elements (buildings and roads) distribution and relation with the NER ... 47
Fig. 2.1 - Situation of Metropolitan Area of Lisbon (a) and of Greater Lisbon (b). Municipalities of Greater Lisbon (c). In Fig. 2.1.c legend, the numbers in parentheses are numbers of civil parishes in 2001. ... 59
Fig. 2.2- Greater Lisbon SoVI map (data from Census 2001) ... 69
Fig. 2.3 - Greater Lisbon susceptibility maps and SoVI map (data from Census 2001) ... 71
Fig. 2.4 - Greater Lisbon susceptibility to all dangerous phenomena ... 72
Fig. 2.5 - Greater Lisbon risk zones (SoVI based on Census 2001) ... 74
Fig. 2.6 - Greater Lisbon exposed population to risk (SoVI based on Census 2001) ... 75
Fig. 3.1 - Loures municipality location, elevation and location of the 686 inventoried landslides ... 87
Fig. 3.2 - Rotational slide body and foot (adapted from Highland and Bobrowsky, 2008) ... 91
Fig. 3.3 - a. Civil parishes of the Loures municipality and location of the fieldwork area; b. buildings of the fieldwork area ... 95
Fig. 3.4 - Probability of landslide area in the Loures municipality (based on the work done by Guillard and Zezere, 2012) ... 97
Fig. 3.5- Prediction-rate curves and area under the curve (AUC) of landslide susceptibility models in the Loures municipality (based on the work done by Guillard and Zezere, 2012) . 98 Fig. 3.6 - Landslide susceptibility maps in the Loures municipality for: a. deep-seated slides, b. shallow slides (based on the work done by Guillard and Zezere, 2012) ... 99
xii Fig. 3.7 - Average building vulnerability and standard deviation per BGRI-subsection for buildings located on landslide body, for a slip surface depth of: a. 1 metre; b. 3 metres; c. 5 metres; d. 10 metres; and e. 20 metres. White polygons are BGRI-subsections without
buildings ... 103 Fig. 3.8 - Average building vulnerability and standard deviation per BGRI-subsection, for buildings located on landslide foot having an affected material height of: a. 0.5 metre; b. 1 metre; c. 3 metres; and d. 5 metres. White polygons are BGRI-subsections without buildings ... 103 Fig. 3.9 - Vulnerability of buildings inventoried in the fieldwork area, being on landslide body having a slip surface depth of: a. 1 m; b. 3 m; c. 5 m; d. 10 m; ... 104 Fig. 3.10 - Vulnerability of buildings inventoried in the fieldwork area, being on landslide foot having an affected material height of: a. 0.5 m; b. 1 m; c. 3 m; ... 104 Fig. 3.11 - Box plots of the vulnerability of the test site buildings for each scenario, for the buildings inventoried by fieldwork (in grey) and for the buildings of the BGRI-subsections (in black) ... 105 Fig. 3.12 - Economic value of buildings per 5 m pixel in the Loures municipality ... 106 Fig. 3.13 - Detail of annual risk for buildings of the Loures municipality located on a
landslide body, for a: a. 1 m; b. 3 m; c. 5 m; d. 10 m; and e. 20 m slip surface depth. Pixel size: 5 m. For location, see Fig. 3.6. ... 107 Fig. 3.14 - Detail of annual risk for buildings of the Loures municipality located on a
landslide foot, for a: a. 0.5 m; b. 1 m; c. 3 m; d. 5 m high of affected material. Pixel size: 5 m. For location, see Fig. 3.6. ... 107 Fig. 3.15 - Box plots of the risk for the buildings per 5 m pixel, for each scenario. Outliers are not shown. The maximum outlier values are: 8.35 (Foot height: 5 m), 12.81 (Foot height: 3 m), 19.58 (Foot height: 1 m), 5.46 (Foot height: 0.5 m), 8.2 (Body depth: 1 m), 25.68 (Body depth: 3 m), 20.38 (Body depth: 5 m), 9.62 (Body depth: 10 m) and 2.99 (Body depth: 20 m). ... 108 Fig. 3.16 - Detail of multiannual risk for buildings of the Loures municipality located on a landslide body with a 10 metres-deep slip surface, for a hazard of: a. 1 year, b. 10 years, c. 25 years, d. 50 years. Pixel size: 5 m. For location, see Fig. 3.6. ... 111 Fig. 4.1 - Average vulnerability for residents living in buildings potentially affected by a landslide body, for a slip surface depth of (a) 1 m, (b) 3 m, (c) 5 m, (d) 10 m, and (e) 20 m. White polygons are BGRI subsections without buildings. ... 131 Fig. 4.2 - Average vulnerability for residents living in buildings potentially affected by a landslide foot with an affected material height of (a) 0.5 m, (b) 1 m, (c) 3 m, and (d) 5 m. White polygons are BGRI subsections without buildings. ... 132 Fig. 4.3 - Total vulnerability for residents living in buildings potentially affected by a
landslide body, for a slip surface depth of (a) 1 m, (b) 3 m, (c) 5 m, (d) 10 m, and (e) 20 m. White polygons are BGRI subsections without buildings. ... 135 Fig. 4.4 - Total vulnerability for residents living in buildings potentially affected by a
landslide foot with an affected material height of (a) 0.5 m, (b) 1 m, (c) 3 m, and (d) 5 m. White polygons are BGRI subsections without buildings. ... 136
xiii
Tables
Table 1.1 - Thematic layers and Information Value scores of variables considering the
modeling groups of landslide types. More significant results are highlighted in bold. ... 36 Table 1.2 - Summary of landslide susceptibility models for the Loures Municipality ... 45 Table 2.1 - Description of the variables chosen to create SoVI for Greater Lisbon. All of them come from the Census 2001 made by the INE, except PHARM1000 that comes from a study conducted by the INE in 2002. ... 62 Table 2.2 - Components, drivers and signs attributed to the components to calculate the SoVI ... 67 Table 2.3 - Matrix for delineation of risk zones ... 73 Table 3.1 - Structural building types in the Loures municipality (National Institute of
Statistics, Census 2011) ... 90 Table 3.2 - Damage level on buildings ... 92 Table 3.3 - Magnitude probability of slides according to their slip surface depth in the Loures municipality ... 97 Table 3.4 - Magnitude probability of slides according to the height of their accumulated material in the Loures municipality ... 98 Table 3.5 - Probability of occurrence of deep-seated landslides in 1 year, 10, 25 and 50 years in the Loures municipality ... 100 Table 3.6 - Probability of occurrence of superficial landslides in 1 year, 10, 25 and 50 years in the Loures municipality ... 100 Table 3.7 - Average vulnerability and standard deviation for each structural building type located on landslide body (cf. Table 3.1 for building type) ... 101 Table 3.8 - Average vulnerability and standard deviation for each structural building type located on landslide foot (cf. Table 3.1 for building type) ... 102 Table 3.9 - Landslide risk per civil parish. Vulnerability data obtained with a sub-pool of landslide experts knowing the study area. ... 109 Table 4.1- Classification of social vulnerability calculated at the BGRI scale ... 127 Table 4.2 - Classification of physical vulnerability calculated at the BGRI scale ... 127 Table 4.3 - Crossing of the social vulnerability values and the physical vulnerability values ... 128 Table 4.4 - Classification of the total vulnerability ... 128 Table 4.5 - Original and converted SoVI values ... 130 Table 4.6 - Landslide risk analysis for the resident population, considering the total
vulnerability for 3 metres-deep landslides (cf. Fig. 4.3.b); adapted from Koks and co-authors (2015) ... 137 Table 4.7 - Landslide risk analysis for the buildings, considering the total vulnerability for 3 metres-deep landslides (cf. Fig. 4.3.b); adapted from Koks and co-authors (2015) ... 137
1
3
0. Introduction
Landslides affect exposed populations worldwide, causing damage, fatalities and injuries. In Portugal, their magnitude has been rarely high enough to cause injuries, although the DISASTER database lists 239 fatalities occurred in the period 1865-2010 (Pereira et al., 2015; Zêzere et al., 2014). In addition, landslides are quite frequent and have been responsible for damage on roads and buildings. These losses and the ensuing disruption of activities make landslides a major geomorphologic hazard in Portugal. Damage caused by landslides can be reduced with adequate policies and practices. For that, it is mandatory to assess landslide hazard and vulnerability to analyse the landslide risk in order to manage it.
0.1. The landslide disaster system
The term landslide refers to a downslope movement of soil, debris, rock, and/or organic materials driven by gravitational forces (Cruden, 1991; Highland and Bobrowsky, 2008). To better understand the effects that landslides may induce, they are usually classified by: (1) the type of movement (fall, topple, slide, spread, flow and slope deformation); (2) the type of affected material (e.g. rock, soil, earth, debris); and (3) the velocity of the moved material (which ranges from some millimetres per year to some metres per second) (Varnes, 1978; Cruden and Varnes, 1996; Hungr et al., 2013). The predisposing conditions and triggering mechanisms of slope failures are also important factors which must be considered for the landslides understanding. The triggering mechanism is usually associated to a natural event (e.g. rainfall, earthquake, snowmelt; stream erosion) but can also come from human activities (e.g. excavation during road building, excessive loading of a slope) (Highland and Bobrowsky, 2008). It also can be a combination of both, as it happened in Amadora (a municipality of the Greater Lisbon) in January 2010, when a large landslide triggered by rainfall affected a highway (A9 - CREL) embankment, the overloading of which having jeopardised its drainage and stability (TVI24, 2010). This huge landslide caused direct losses: some electricity poles were toppled (Fig. 0.1) and 600,000 m3 of material had to be removed from the highway (Fig. 0.2) (Diario de Notícias 2010); as well as indirect losses: the affected part of the highway was not usable by drivers during three weeks in both directions and the highway remained partially closed in one direction during three more weeks (RTP Noticias 2010). The costs generated whether by the deposition removal or by the lack of money coming from the toll that was not paid during all this period were very elevated, and the drivers who used to travel by this highway lost time and money because of the deviation paths.
The consequences of a landslide can be diverse according to the landslide magnitude and the vulnerability and value of the exposed elements (also called elements at risk). The assessment of the potential damage (e.g. injuries, fatalities, destruction of buildings or
4 infrastructures, loss of activity) that landslides can produce on a set of elements at risk is named landslide risk analysis (Bell and Glade, 2004). Analysing landslide risk means to define the risk (what could happen?), to calculate the frequency of the hazard (when could it happen?), to determine which are the elements at risk (who is threatened?), to evaluate the consequences (what is the intensity of the hazard? how vulnerable are the elements at risk?), and to assess the involved costs (Fell et al., 2005). Landslide risk analysis is the first step to assess the risk, which implies to fix a limit of risk acceptation. Then, risk assessment allows to manage the landslide risk, which implies the reduction of the risk through policies, procedures and practices (Bell and Glade, 2004; Fannin et al., 2005).
Fig. 0.1 - Damage caused by the landslide on the CREL embankment. Source: Sérgio Cruz de Oliveira, CEG,
IGOT, Universidade de Lisboa, 24/01/2010
The landslide hazard, which is the spatial and temporal probability of a landslide occurrence, is usually the first step for a landslide risk analysis. Then, the vulnerability and the value of the elements at risk which are exposed to landslides have to be assessed, because the landslide risk is generally considered as the product of the landslide hazard, the vulnerability of the elements at risk and their values (e.g. Varnes and the International Association of Engineering Geology Commission on Landslides and Other Mass Movements,
5 1984; Cardinali et al., 2002; Uzielli et al., 2008). These concepts and their assessment are developed in the next subsections.
Fig. 0.2 - CREL interrupted by the landslide. Source: Sérgio Cruz de Oliveira, CEG, IGOT, Universidade de
Lisboa, 24/01/2010
0.2. Landslide hazard
The landslide hazard expresses the probability of occurrence of a potentially damaging landslide event within a given area and in a given period of time (Varnes and the International Association of Engineering Geology Commission on Landslides and Other Mass Movements, 1984; Guzzetti et al., 1999; Glade, 2001). In addition, the landslide hazard assessment must include information on landslide types and magnitudes (Guzzetti et al., 1999; Bell and Glade, 2004; Jaiswal et al., 2010). Landslide magnitude refers to the intensity and potential destructiveness of a landslide (Guzzetti et al., 1999). The landslide destructiveness can be measured by the characteristics of the landslide, like the landslide area (Guthrie and Evans, 2007) or the landslide volume (Evans et al., 2007), or by the consequences generated by the landslide, like the number of fatalities (Guzzetti, 2000).
6 The assessment of the landslide hazard is based on the assessment of the susceptibility of the slopes. Indeed, the susceptibility assessment refers to the spatial probability of the landslides based on the local terrain conditions (Soeters and van Westen, 1996; Glade, 2001; Zêzere, 2002). Landslide susceptibility assessment at the basin scale as well as at the municipal scale is based on the assumption that future landslide have higher probability to occur under the same conditions that led to past landslides (Varnes and the International Association of Engineering Geology Commission on Landslides and Other Mass Movements, 1984; Soeters and van Westen, 1996; Zêzere et al., 2004a; Guzzetti, 2005). Therefore, a complete inventory of the past landslides must be listed in order to combine the distribution of these landslides with the spatial patterns of the predisposing factors for slope instability (Zêzere et al., 2004b; Chacón et al., 2006). The landslide inventory records the location and the type of the landslide, as well as the date of occurrence, when this is known (Malamud et al., 2004). It can be carried out from various sources, like the stereoscopically examination of aerial photographs, or by the examination of orthophoto maps combined with the accurate topography. Field investigation is useful to validate slope movements seen on the photographs or orthophoto maps and to map the fresh landslides which are more recent than the photographs and therefore do not appear in them.
The inventory of the landslides must be combined with a set of slope instability predisposing factors for landslide susceptibility assessment. For an assessment at the municipal scale, the critical data regarding predisposing factors include slope angle and slope aspect, lithology, geological structure, faults, soil types, geomorphologic units, land use types, land use changes and hydrological components (van Westen et al., 2008; Pereira, 2010). Nevertheless, the set of factors can be limited and must be coherent and logical (Zêzere et al. 2008a).
The methods used for the susceptibility assessment can be statistic, heuristic or deterministic (Corominas et al., 2014; Dai et al., 2002; Guzzetti et al., 2006). The statistical models have the advantages (1) to be easily applicable at the municipal scale unlike the deterministic models which require detailed knowledge regarding the unstable slope characteristics (e.g shear resistance parameters, unstable soil thickness); and (2) to be objective, unlike the heuristic models which are subjective and the quality of which depends on the experience of the expert, especially for the attribution of weighted values (Soeters and van Westen, 1996; Pereira, 2010). The accuracy and the robustness of the statistical models can be validated by success and prediction-rate curves (Chung and Fabbri, 2003; Guzzetti et al., 2006), which allow to know the goodness of fit of the susceptibility model and the predictive power of the susceptibility model, respectively (Chung and Fabbri, 2003).
Then the temporal component must be considered and combined with the susceptibility assessment in order to assess the landslide hazard. For that, the probability of landslide occurrence can be determined by using landslide records. Alternatively, the probability of the landslide triggering event can be used (Glade, 2001).
Landslide magnitude and frequency have to be considered during the landslide hazard assessment (Guzzetti et al., 2005). The magnitude of a landslide event can be measured by the
7 total number, total area and/or total volume of landslide in a landslide event (Malamud et al., 2004; Oliveira, 2012). Frequency-magnitude curves are necessary for a correct understanding and characterisation of municipal or regional landslide hazard (Guthrie et al., 2007) and can be obtained by multiplying the probability distribution by the total number of landslides in the event (Malamud et al., 2004).
The landslide hazard assessment implies several uncertainties which must be considered when using the landslide hazard map. First, it is based on the assumption that future landslides have a higher probability to occur under the same conditions that generated the past landslides; but if slope instability conditions change, because of human intervention on slopes or because of climate change, for example, the magnitude of the landslides should increase. Second, the inventory of landslides used as a base for the susceptibility assessment is always incomplete, because the areas of depletion and accumulation of the landslides are not always visible for various reasons, particularly in the forested, ploughed or recently urbanised areas or regarding old or inactive slope movements which disappeared from the landscape due to erosion or vegetation growth (Guzzetti et al., 1999). Moreover, the quality of the landslide inventory depends not only on the freshness of the landslides and on the absence of alterations of the land use, but it depends also on the quality and the scale of the photographs, on the morphological and geological complexity of the considered area and on the degree of experience of the expert who mapped the landslides (Varnes and the International Association of Engineering Geology Commission on Landslides and Other Mass Movements, 1984).
The landslide hazard map is useful to town and country planning stakeholders because it allows them to take decisions regarding the use of the areas where most of the future landslides should occur. They can therefore adopt preventive measures, as the prohibition of building dwellings, roads, infrastructures or other types of constructions on the most hazardous areas. Indeed, planning control is one of the effective and economical way to reduce landslide losses, because if the local governments remove or convert the buildings and infrastructures that are on unstable areas, or discourage or regulate new development on these areas, the risk would be reduced at source (Dai et al., 2002). The stakeholders can also adopt protective measures, as the development of engineering work in potentially unstable slopes where elements at risk need to be protected, by correcting the underlying unstable slope or controlling the landslide movement, for example (Dai et al., 2002). However, these solutions are costly and are not always practicable, namely when the landslide magnitude is very high. In already developed hazardous areas, a possible solution is the introduction of a monitoring and warning system to evacuate preventively the residents prior meteorological events prone to trigger landslides, but it is only possible on the places that are already known as unstable.
For civil protection, the hazard assessment is important, but the assessment of the vulnerability of the elements at risk is also useful to know which part of the population is more at risk. In relation to hazard assessment, vulnerability assessment to natural hazards in general and to landslide hazard in particular is a new field of research and the number of studies focusing on vulnerability assessment is limited (Fuchs, 2009; Papathoma-Köhle et al., 2012). For Zêzere and co-authors, landslide vulnerability is probably the most difficult term to
8 represent quantitatively within landslide risk analysis (Zêzere et al. 2008b). Landslide vulnerability understanding and assessment are therefore a crucial path for assessing the landslide risk (Ding et al., 2012; Fotopoulou et al., 2013), but they are not easy tasks.
0.3. Vulnerability and losses due to natural disasters
0.3.1. Different facets of vulnerability
Geographers have a long-standing interest in natural hazards and vulnerability research since the work of Gilbert F. White who submitted his pioneering thesis on flood hazards and flood plain management to the University of Chicago in 1942 (Fuchs et al., 2011). Nevertheless, the term "vulnerability" is used in several disciplines, which makes it a quite fuzzy term because of the different definitions and conceptual models that are used (Alcántara-Ayala, 2002; Fuchs et al., 2011). Indeed, Thywissen (2006) listed 22 definitions of risk and 36 definitions of vulnerability to natural disasters, which emerged between 1983 and 2005.
Most of the definitions of vulnerability to natural disasters agree to state that the vulnerability is multi-dimensional (vulnerability has several facets: e.g. physical, social, economic, environmental, institutional), dynamic (vulnerability changes over time), intrinsic of any community, scale-dependant (vulnerability can be expressed at different scales from human or household to country resolution) and site-specific (each study area might need its own approach) (Thywissen, 2006).
For the United Nations, the term "vulnerability" refers to the conditions which make a community susceptible to the impact of hazards, the conditions being determined by physical, social, economical and environmental factors or processes (UNISDR, 2009). This makes it a term with different facets, which should be all considered to make a complete vulnerability assessment. In practice, it is rarely the case. Indeed, authors usually focus on one facet of the vulnerability according to their background.
Engineers are more often interested in the physical vulnerability (also called structural vulnerability) of the buildings. The physical vulnerability can be assessed by considering different scenarios and by calculating the likelihood of occurrence of specific process scenarios (Fuchs, 2009). Vulnerability curves are often used to assess the physical vulnerability of a type of element at risk (e.g. reinforced concrete buildings), indicating the interaction between the intensity of the hazard and the type of element at risk (Corominas et al., 2014).
Not only the built environment factors are important in terms of natural disaster outcome, but also the social factors (Zahran et al., 2008); this work is in general done by sociologists who assess the social vulnerability of the population. For Cutter and co-authors (2008), social vulnerability is linked to the inherent characteristics of social systems that create potential for harm. It exists before the occurrence of a disaster and is function of the
9 exposure of the element at risk and sensitivity of system (Cutter, 1996; Cutter et al., 2008). To assess the social vulnerability of a population, social scientists collect and explore a set of socioeconomic factors in order to know which part of the population would have more difficulty to recover from a natural disaster, and which part would be less vulnerable and more able to cope with stress or change (Fuchs, 2009).
Economists focus on the economic vulnerability. Guillaumont (2009) developed an Economic Vulnerability Index (EVI) which measures the likelihood that a country's economic development process is hindered by the occurrence of exogenous unforeseen events, often called external shocks, and which come from the occurrence of a natural disaster (e.g. earthquake, volcanic eruption, flood) or trade or exchange-related shocks (e.g. slumps in external demand, world commodity prices instability, international fluctuations of interest rates) (Guillaumont, 2009). This index has been used by the United Nations to measure the vulnerability of the least developed countries.
According to Tapsell and co-authors (2010), the vulnerability to natural disasters has other facets. Indeed, additionally to social, physical and economic vulnerabilities are the organizational, cultural, systemic, territorial and institutional vulnerabilities (Tapsell et al., 2010). Another facet is the functional vulnerability, which characterises the potential damage that activities and functions may suffer. It depends on the damage caused on goods, persons and secondary functions as well as the capacity the society can restore the activity (Léone et al., 1996). Gleyze and Reghezza proposed a method to assess the functional vulnerability of the transport networks to a 100-year flood in Ile-de-France (Gleyze and Reghezza, 2007).
0.3.2. Potential losses
The potential losses or consequences of a natural disaster are often defined as a product of the vulnerability and the value of the elements at risk (Julião et al., 2009; Silva and Pereira, 2014; van Westen et al., 2005). Potential losses can be diverse according to the different types of hazards and of elements at risk, and according to the facet of the vulnerability which is considered. The losses can be whether direct when they result from the effects of elements at risk (e.g. injuries, structural damages to buildings or infrastructures), or indirect when they result from the consequences of this destruction (Eidsvig et al., 2014). Figure 0.3 lists some of the direct and indirect losses which can result from natural disasters. Direct losses belonging to social and physical vulnerabilities are more frequently evaluated (in red in Fig. 0.3). For instance, some authors, as Fuchs and co-authors (2007) and Akbas and co-authors (2009), assessed the vulnerability of buildings to debris flows by defining the vulnerability as the ratio between the loss and the individual reconstruction value, which was calculated for each building on function of its type and size. The obtained ratios were coupled to the corresponding deposition height and the vulnerability was plotted in function of the intensity of the debris flows, represented by their height. Some authors assess the indirect losses, as Eidsvig and co-authors (2014), who proposed a model to assess the relative socioeconomic vulnerability to landslides at the local or regional scale by indicators representing the degree
10 of preparedness, effectiveness of the response and capacity to recover from the damage caused by landslides. Nevertheless, indirect losses are more difficult to assess than direct losses, and are therefore less considered than direct losses (Gall et al., 2011). The lack of consideration of direct and indirect losses is responsible for under-estimation of the risk, which is by definition the product of the hazard by the potential losses.
Fig. 0.3 - Overview of types of loss resulting from natural hazards. Source: van Westen and Kingma, 2009
Besides the diverse vulnerability facets and the difficulty associated to the assessment of all the potential losses, the absence of clear goals for risk and vulnerability reduction is an issue in the development of vulnerability and risk indicators. The development of tools for the vulnerability assessment aims at filling the gaps between the theoretical concepts of vulnerability and the decisions that the stakeholders have to take (Birkmann, 2007).
0.4. The assessment of vulnerability
The vulnerability assessment is certainly useful for disaster risk reduction and promoting an exchange of information, as aims the Americas Project (Birkmann, 2007; Cardona, 2005), or for improving disaster preparedness and preventing losses, as aims the Hotspots Project by creating indicators regarding the frequency of the hazards and the foreseeable economic or human impacts at a global scale (Birkmann, 2007; Léone, 2007). Ideally, it should also assist
11 policy makers in identifying investments priorities (e.g. prevention and mitigation measures) to reduce risk, to identify national risk-management capacities and to evaluate the effects of policies and investments on risk management, and to gauge a country's relative position and follow its evolution over time (Birkmann, 2007).
Some global approaches aim to compare disaster risk between countries exposed to selected natural hazards, as it is the case of the Disaster Risk Index (DRI), which measures the mortality by assessing the relative vulnerability, which is the ratio of the number of persons killed by the number of exposed persons (UNDP/BCPR 2004; Birkmann 2007). The DRI was used to identify the countries which most need prevention and development (Peduzzi et al., 2009). Another index of structural vulnerability to climate change was developed to assess the environmental vulnerability of the least developed countries which are facing environmental shocks resulting from climate change (e.g. droughts, floods, storms and rise of sea level), in order to allocate adaptation funds (Guillaumont and Simonet, 2011).
0.4.1. Vulnerability representation
Birkmann (2006. p.11) noted that "we are still dealing with a paradox: we aim to measure vulnerability, yet we cannot define it precisely". Vulnerability can be measured either on a metric scale or a non-numerical scale (Glade, 2003) and is represented by different ways.
One of them is the elaboration of an index which combine various indicators. The index elaboration is usually used to assess social vulnerability (e.g. Social Vulnerability Index (SoVI) which was established by Cutter and co-authors (2003)), economic vulnerability (e.g. Economic Vulnerability Index (EVI), established by Guillaumont (2009)), human vulnerability (e.g. Disaster Risk Index (DRI), established by UNDP/BCPR (2004)) or environmental vulnerability (e.g. Index of Structural Vulnerability to Climate Change, established by Guillaumont and Simonet (2011)).
Physical vulnerability is more often expressed through vulnerability functions (e.g. Fuchs et al., 2007) which represent the interactions between the damaging event and the elements at risk through curves expressing the possible resistance of the elements to an impact (Li et al., 2010; Puissant et al., 2013). In the case of the landslide vulnerability , the vulnerability functions are usually used for detailed assessments (1:5000-1:10000) (Puissant et al., 2013). An example of application is the study of Papathoma-Köhle and co-authors (2012), who measured the degree of loss of buildings in function of the debris flow intensity, represented by the height of the debris deposit.
Fragility curves are another way to represent physical vulnerability by providing the probability for a type of elements at risk to reach or to exceed a specific damage state under a given hazard intensity (Blong, 2003). For example, in the case of earthquakes, for which the fragility curves have been frequently used, they express the level of damage to a building given, for example, the amplitude of ground shaking (Douglas, 2007). Although less used for landslides than for earthquakes (Douglas, 2007), some authors use them, as Fotopoulou and
12 co-authors (2013), who expressed the level of damage caused by permanent cumulative ground displacement at the foundation level on reinforced concrete buildings. According to Lateltin and co-authors (2005), more research is needed because a lot of uncertainties remain in the calculation of fragility curves according to different landslide intensities.
Finally, the relation between hazard intensity and degree of damage can also be given in a vulnerability table or matrix, especially when the hazard intensity has no intermediate values (e.g. the Modified Mercalli Intensity for earthquake hazard). Léone and co-authors (1996) established vulnerability matrices to assess the structural damage on elements at risk to landslides. Similar matrices can be used to assess the corporal and functional vulnerabilities (Léone, 1996).
Most of the scientific studies assessing the vulnerability of the populations to natural hazards examine either the social vulnerability or the physical vulnerability of the elements at risk, which are discussed in the following subsections.
0.4.2. Social vulnerability to natural hazards
Social vulnerability characterises the inequalities which define the predisposition of social groups in the context of a disaster (Hewitt, 1997; Susman et al., 1983). The concept of social vulnerability is complex (Ciurean et al., 2013); indeed, it is itself a multi-faceted entity and authors use this term with different meanings (Tapsell et al., 2010). Therefore, fundamental differences exist between the main types of social vulnerability to natural hazards assessment approaches; some of them are based on intangible losses assessments and others are based on the underlying socioeconomic factors that are responsible for vulnerability in a society (Ciurean et al., 2013). If physical vulnerability is usually considered as hazard-dependant (Papathoma-Köhle et al., 2011), a unique social vulnerability assessment is often combined with different natural hazards assessments (e.g. Cutter et al., 2010; Chen et al., 2014).
Social vulnerability is commonly measured by indexes which are based on a set of socioeconomic indicators (e.g. age, gender, disability) which can either be weighted (by expert judgement, analytic hierarchy, Principal Component Analysis (PCA), factor analysis or multiple regression models) or not (if all indicators are assumed to have an equal significance). The indicators are then combined, often by an additive combination when the factors are independent or by a multiplicative combination when the utility of one factor depends on another factor, or even by an association of both additive and multiplicative combinations (SafeLand, 2012). The obtained social vulnerability can then be combined with susceptibility or hazard assessments in order to locate the risk to different natural disasters (e.g. Cutter et al., 2000).
In attempting to define social vulnerability, a new concept of resilience emerged and evolved (Tapsell et al., 2010). As the social vulnerability concept, the concept of resilience has many definitions. Klein and co-authors (2003) made a literature review of the resilience concepts. The authors noted that the Resilience Alliance defines the resilience of
social-13 ecological systems by considering three dimensions: (1) the amount of disturbance a system can absorb still remaining within the same state; (2) the degree to which the system is capable of self-organisation; (3) the degree to which the system can build and increase the capacity for learning and adaptation. This comprehensive interpretation of the resilience became the basis of a scientific background paper, which refers to resilience as the "flip side" of vulnerability. A later interpretation defines the resilience as a component of the vulnerability, along with exposure and sensitivity. It is also the interpretation of different authors, as Pelling (2003). According to the United Nations, resilience is the "ability of a system, community or society exposed to hazards to resist, absorb, accommodate to and recover from the effects of a hazard in timely and efficiently manner, including through the preservation and restoration of its essential basic structures and functions" (UNISDR, 2009). Berkes (2007) believes that resilience thinking helps the providing of an all-hazard approach and avoid the division that is often made between social and physical vulnerability.
0.4.3. Physical vulnerability of elements at risk to landslides
Physical vulnerability is a functional relationship between process magnitude, the impacts on structural elements at risk and exposed values (Fuchs, 2009). Regarding the built environment, vulnerability is related to the fragility of physical structures and is defined as the expected degree of loss resulting from the impact of a certain event on the elements at risk. Its assessment requires the evaluation of different parameters and factors such as type of element at risk, resistance, and implemented protective measures (i.e. local structural protection) (Fuchs, 2009).
In physical geography and in engineering geology, most of the studies consider the vulnerability to a hazardous event of a given magnitude as being the degree of loss of elements at risk expressed in a scale ranging from 0 (no loss) to 1 (total loss) (e.g. Varnes & the International Association of Engineering Geology Commission on Landslides and Other Mass Movements 1984; Hufschmidt et al. 2005; Chacón et al. 2006; Uzielli et al. 2008; Zêzere et al. 2008b; Fuchs et al. 2011; Uzielli et al. 2014). From this definition emerged a wide range of vulnerability assessment models, each study addressing vulnerability in a different way (Papathoma-Köhle et al., 2011). These different models partly depend on the different scales of the vulnerability assessment (Puissant et al., 2013), and on the purpose for which the vulnerability assessment method was created.
There are few studies focusing on vulnerability assessment to landslides and other gravitational hazards comparing to other types of hazards according to Hollenstein (2005), which registered more than 1000 vulnerability assessments for earthquakes, more than 100 vulnerability assessments for wind events and only 20 or less for gravitational hazards (Hollenstein, 2005). For this author, this must be due to the fact that the gravitational hazards are usually accurately delimited, therefore the stakeholders simply avoid the potentially affected areas. In addition, the institutions that manage the risk do not seem to need empirical models because they think having sufficient empirical knowledge. However, assessment of
14 the physical vulnerability to landslides is useful to assess the potential losses that can be caused by landslides and the associated risk. Several ways exist to measure the physical vulnerability to landslides (van Westen and Kingma, 2009). The first one consists of collection and analysis of the registered damage in recent historical events. This method is particularly used for relatively frequent events such as floods or earthquakes, which normally affect many buildings of the same type, allowing thus the elaboration of vulnerability curves by correlating the magnitude of the event and the degree of damage. Recent approaches have been made regarding the assessment of physical vulnerability to landslides on the base of observed damages. For example, Galli and Guzzetti (2007) assessed the physical vulnerability of buildings and roads to landslides in Umbria, Italy. They considered 103 slides and slide-earth flows which caused damage to roads and buildings in 90 sites in Umbria, and they established a relation between the area of the landslides and the vulnerability of the roads and the buildings by observing the consequences of the landslides. The minimum and maximum vulnerability thresholds were plotted for each type of element at risk (buildings, major roads and secondary roads) and were used to map expected vulnerability of the elements at risk. The results of the study show that when the landslide area increases, the amount of damage also increases, as well as the vulnerability of the elements at risk.
When there is not enough available information regarding the caused damage, the physical vulnerability can be measured through expert opinions. For example, landslide experts can give their opinion on the potential damage that can be caused to a specific type of elements at risk by a landslide that has a certain magnitude, and the vulnerability assessment would be based on their answers. This method is time-consuming because numerous experts must be interviewed to obtain results with a lower subjectivity.
Analytical methods study the behaviour of structures based on engineering criteria, computer simulation programs helping for modelling the behaviour of buildings (e.g. Huang et al. 2011). These methods have been more used for earthquakes than for landslides.
Geography is an interdisciplinary field of research which allows to make progress in the mitigation and adaption to natural hazards by analysing the multi-faceted characteristics of the vulnerability (Fuchs et al., 2011). Some studies focus only on one aspect of the vulnerability, while others focus on different facets of the vulnerability and propose a combination of these assessments. Some of the studies which have the ambition to assess several facets of the vulnerability to landslides are presented in the next subsection.
0.4.4. Studies which combine social and physical vulnerability to landslides
Léone was one of the pioneer in the assessment of vulnerability to landslides. He proposed a method to assess the corporal (for people), structural (for material goods) and functional (for activities) sides of the vulnerability to landslides and presented them in matrices (Léone, 1996).