The Intention to Use
Reusable Packaging
Investigating the Effect of the Consumer’s
Perceived Ease of Use, Perceived Usefulness
and Pro-Environmental Attitude
Joana Sofia de Oliveira Ferreira Pedro Dias
Dissertation written under the supervision of
Prof. Paulo Romeiro
Dissertation submitted in partial fulfilment of requirements for the MSc in
Management with Specialization in Strategic Marketing, at the Universidade
iii ABSTRACT
Title: “The Intention to Use Reusable Packaging: Investigating the Effect of the Consumer’s Perceived Ease of Use, Perceived Usefulness and Pro-Environmental Attitude”
Author: Joana Sofia de Oliveira Ferreira Pedro Dias
With consumers becoming more concerned with the environment and increasing the demand for sustainable products, companies have been adapting their products to match consumers’ expectations. One of the most efficient ways of increasing a product’s sustainability is through sustainable packaging. This study focuses on reusable packaging with concentrated refills. This research aims at identifying what determines the intention to use a reusable packaging and how the consumers’ environmental attitude will impact this relationship. More precisely, this study will consider the Technology Acceptance Model as the starting point and analyze how perceived ease of use and perceived usefulness will predict the intention to use when moderated by the consumer’s environmental attitude.
An online questionnaire was conducted where respondents were exposed to a product picture of a spray surface cleaner either in a single-use or reusable packaging. The results obtained indicate that the consumers’ intention to use a reusable packaging is significantly lower than the single-use packaging mostly due to the its perceived inconvenience and difficulty to use. Additionally, a consumer with a high environmental attitude is more willing to use a reusable packaging and finds it easier to use. Findings also show that the brand effect is diminished in a reusable packaging when consumers have higher levels of environmental attitude when compared to a single-use packaging.
Keywords
iv SUMÁRIO
Título: “A Intenção de Usar Embalagens Reutilizáveis: Investigação do Efeito da Facilidade de Utilização Percebida, Utilidade Percebida e da Atitude Pró-ambiental do Consumidor” Autor: Joana Sofia de Oliveira Ferreira Pedro Dias
Os consumidores estão mais preocupados com o meio ambiente e a procura por produtos sustentáveis tem vido a aumentar. Esta tendência tem levado as organizações a adaptar os seus produtos de forma a irem de encontro com expetativas dos consumidores. Um dos métodos mais eficientes para aumentar a sustentabilidade de um produto é através de embalagens sustentáveis. Este estudo foca-se em embalagens reutilizáveis com recargas concentradas. Esta investigação tem como objetivo identificar o que explica a intenção de usar uma embalagem reutilizável e como é que a atitude ambiental dos consumidores vai impactar esta relação. Mais precisamente, o estudo vai considerar o Technology Acceptance Model como ponto de partida e analisar como Facilidade de Utilização Percebida e a Utilidade Percebida preveem a intenção do uso, quando moderados pela atitude ambiental do consumidor.
Foi realizado um questionário em que os inquiridos foram expostos a uma imagem de um limpa-superfícies em spray ou numa embalagem descartável ou numa embalagem reutilizável. Os resultados obtidos indicam que a intenção dos consumidores usarem uma embalagem reutilizável é mais baixa dado uma pré-concebida inconveniência e dificuldade de uso acrescida.
Além disso, um consumidor com uma atitude ambiental elevada está mais disposto a usar uma embalagem reutilizável e considera-a mais fácil de usar. Os resultados também mostram que o efeito da marca é perdido com consumidores com nível elevados de atitude ambiental em embalagens reutilizáveis.
Palavras-chave
v ACKNOWLEDGEMENTS
This dissertation marks the end of my studies and the beginning of a new chapter in my life. There are many people I am grateful to and a few deserve a special mention.
I would like to start by thanking my supervisor, Professor Paulo Romeiro, for his support, availability and words of encouragement. Without his patience and assistance this dissertation would have been impossible to finish. I would also like to thank Professor Fernando Machado for his help during this process.
I would like to express my sincere gratitude to my parents and to my brother. You have taught me more than anyone in life and everything I achieved so far was thanks to you. Thank you for always believing in me.
Aos meus avós Laurindo e Mimi, obrigada por serem sempre os meus maiores fãs. Obrigada por todas as velinhas acesas, todos os chocolates e por nunca deixarem de acreditar que sou uma “máquina”. À minha avó Lila, por ser o maior exemplo de classe que conheço e uma inspiração.
A special thank you to Madalena Martins, my right arm in life since I can remember. I wouldn’t be where I am today without you and for that I am incredibly grateful. Thank you for being my person and for being my best friend.
To Inês Rodrigues, you make life more interesting. Thank you for the unconditional support and for always knowing what to say.
I’d also like to express my gratitude to João Cunha, João Ferreira and Rodrigo Bugalho. You are the coolest guys I know, and I am extremely lucky to be able to call you my friends. Thank you for the laughs, arguments but mostly for sticking with me throughout all these years. Finally, to Rodrigo Assunção, you have been the greatest thing Católica has given me. I owe you more thank you’s than could ever fit in this page, so I’ll just thank the student affairs for putting you in my class back in 2013.
vi TABLE OF CONTENTS ABSTRACT ... III SUMÁRIO ... IV ACKNOWLEDGEMENTS ... V TABLE OF CONTENTS ... VI TABLE OF FIGURES ... VIII TABLE OF TABLES ... IX TABLE OF APPENDICES ... X GLOSSARY ... XI
CHAPTER 1: INTRODUCTION ... 1
1.1BACKGROUND AND PROBLEM STATEMENT ... 1
1.2PROBLEM STATEMENT ... 2
1.3RELEVANCE ... 2
1.4RESEARCH METHODS ... 3
1.5DISSERTATION OUTLINE ... 3
CHAPTER 2: LITERATURE REVIEW AND CONCEPTUAL FRAMEWORK ... 5
2.1TECHNOLOGY ACCEPTANCE MODEL (TAM) ... 5
2.2PACKAGING ... 8
2.3SUSTAINABILITY AND PRO-ENVIRONMENTAL ATTITUDE ... 13
2.4MODIFIED TAM:REUSABLE PACKAGING TECHNOLOGY ACCEPTANCE MODEL ... 16
CHAPTER 3: METHODOLOGY ... 17 3.1RESEARCH APPROACH ... 17 3.2SECONDARY DATA ... 17 3.3PRIMARY DATA ... 17 3.3.1ONLINE SURVEY ... 18 3.3.1.1DATA COLLECTION ... 18 3.3.1.2RESEARCH DESIGN ... 19 3.3.2MEASUREMENT /INDICATORS ... 20
CHAPTER 4: RESULTS AND DISCUSSION ... 23
4.1SAMPLE CHARACTERIZATION... 23
4.2MEASURE RELIABILITY ... 24
4.3RESULTS FROM THE HYPOTHESES TESTING ... 25
4.3.1HYPOTHESIS 1 ... 26
4.3.2HYPOTHESIS 2 ... 28
4.3.3HYPOTHESIS 3 ... 30
4.3.4HYPOTHESIS 4 ... 30
4.3.5.CONDITIONAL PROCESS MODELING –MODERATED MEDIATION (MODEL 86) ... 34
4.4FURTHER RESULTS ... 38
4.4.1BRAND EFFECT ... 38
vii
CHAPTER 5: CONCLUSIONS AND LIMITATIONS ... 40
5.1MAIN FINDINGS &CONCLUSIONS ... 40
RQ1:OVERALL, HOW WILLING ARE CONSUMERS TO USE REUSABLE PACKAGING? ... 40
RQ2:WHAT EXPLAINS INTENTION TO USE REUSABLE PACKAGING? ... 40
5.2MANAGERIAL IMPLICATIONS ... 41
5.3ACADEMIC IMPLICATIONS ... 41
5.4LIMITATIONS AND FURTHER RESEARCH ... 42 REFERENCE LIST ... I APPENDICES ... VIII
viii TABLE OF FIGURES
Figure 1: Technology Acceptance Model (Davis, 1985) ... 6
Figure 2: Modified TAM - Reusable Packing Technology Acceptance Model ... 16
Figure 3: Cross-Sectional Design Matrix ... 19
Figure 4: Stimuli Shown to Different Groups of Respondents ... 20
Figure 5: Hayes' Process Macro Model 86 (Conditional Process) ... 22
Figure 6: Statistical Model with Coefficients (H1a) ... 27
Figure 7: Statistical Model with Coefficients (H1b) ... 28
Figure 8: Statistical Model with Coefficients (H2) ... 29
Figure 9: Statistical Model with Coefficients (H3) ... 30
Figure 10: Interaction Effect of PEA * PP on PEOU ... 32
Figure 11: Statistical Model with Coefficients (H4a) ... 32
Figure 12: Interaction Effect of PEA * PP on ITU ... 34
Figure 13: Statistical Model with Coefficients (H4b) ... 34
Figure 14: Interaction Effect of PEA * PP on ITU [Total Model] ... 36
ix TABLE OF TABLES
Table 1: Operational Model ... 21 Table 2: Sample Characterization ... 24 Table 3: Cronbach's Alpha of Constructs ... 25
x TABLE OF APPENDICES
Appendix 1: Survey ... VIII Appendix 2: Hypothesis 1a ... XI Appendix 3: Hypothesis 1b ... XIII Appendix 4: Hypotheses 2 and 3 ... XIV Appendix 5: Hypothesis 4a ... XVI
Appendix 6: Hypothesis 4b ... XVIII
Appendix 7: Conditional Process Modeling - Moderated Mediation ... XX Appendix 8: Conditional Process Modeling with Brand Effect ... XXV Appendix 9: Cluster Analysis ... XXX
xi GLOSSARY
TAM Technology Acceptance Model TRA Theory of Reasoned Action PEOU Perceived Ease of Use PU Perceived Usefulness ATU Attitude Towards Use ITU Intention to Use ASU Actual System Use
VIEW Visible, Informative, Emotional, Workable FMCG Fast Moving Consumer Goods
NGO Non-Governmental Organization SPA Sustainable Packaging Alliance TPB Theory of Planned Behavior
UK United Kingdom
PP Packaging Preference PEA Pro-Environmental Attitude
CHAPTER 1: INTRODUCTION
1.1 Background and Problem Statement
With the growing concern of the well-being of the environment, companies have been desperate to find their spot in the sustainable market (Kooijman, 1993). Whether through packaging alterations or through changes in formulas, organizations have been relying on the launch of green products (Dangelico, 2010) to convince consumers they are up to their sustainable standards. Although to some these products are simply image-boosters, the conscious segment is quickly becoming one of the biggest targets for most companies. A study by Unilever shows how a third of the consumers does now prefer sustainable products and how this represents an untapped market of €966 billion (Unilever, 2017). One of the most efficient ways of transforming non-sustainable products into sustainable ones is through packaging modifications. Sustainable packaging is considered an important attribute in consumers’ choices and for at least one third of the consumers is the most important attribute.
With most of the current packaged goods market resourcing to plastic, one of the biggest polluters, most countries have now been introducing legislation that bans the use of certain materials and penalizes those who do not consider environmental issues (Rundh, 2009). Green packaging is now becoming more available in the market and competing against traditional products for the consumers’ attention. This comes in all shapes and forms, but the focus of this dissertation will be reusable and concentrated packaging technologies. Creating refillable packaging, increases the number of times containers are used, yielding the environmental benefits (Numata & Managi, 2012). Concentrated products have a simple concept, reducing the amount of packaging in a packaged good. Companies like Unilever have been experimenting with having consumers investing in traditional reusable packaging and then selling ultraconcentrated versions of the product in small bottles that the consumers can later dilute at home.
Although consumers appreciate reusable products, there is evidence of a perceived inconvenience. Consumers believe that reusable packaging requires more time and effort to clean, refill and store than a single-use packaging and have even expressed safety concerns due to their higher involvement. Additionally, they believe that these technologies must offer further benefits relative to traditional packaging, specially cost benefits (Lofthouse & Bhamra, 2006).
Even though the number of consumers with a high pro-environmental attitude is rising, the market share of green products has remained stable throughout the years. This means that the desire to have sustainable products does not always represent the actual in-store experience, as a large percentage of consumers identifies as being conscious yet still buy non-conscious products (Rokka & Uusitalo, 2008).
Taking into account the conflicting ideas presented, the aim of this research is to identify what determines the intention to use a reusable packaging and how the consumers’ environmental attitude impacts this relationship.
1.2 Problem Statement
The main scope of this research is to understand how consumers’ intention to use a reusable packaging differs from the traditional packaging. Additionally, it also intends to comprehend how a consumer’s pro-environmental attitude impacts their intention to use a packaging technology. The problem statement can be summarized as:
How does the consumers’ pro-environmental attitude and packaging usabilty perceptions (reusable vs single-use) impact consumer’s intention to use reusable packaging?
This problem statement is explained by the following research questions: RQ1: Overall, how willing are consumers to use reusable packaging? RQ2: What explains intention to use reusable packaging?
1.3 Relevance
The trend of sustainability has been on the consumers’ minds for the past few decades. As a response, consumers have become significantly more aware of the impact of their choices (Stolz, Molina, Ramírez, & Mohr, 2013) and started to demand products that meet their changing needs (Scott & Vigar-Ellis, 2014). With the amount of waste generated by the population drastically increasing, one of the main focuses has been the excessive packaging used by most businesses. Therefore, organizations are trying to find solutions to intensify their corporate social responsibility and become more sustainable. Reusable packaging may be one solution for companies to adapt their current products and attract the conscious segment. Nevertheless, due to the inconvenience that is typically associated with reusable packaging, it is vital to understand how consumers react to this change and investigate whether this would be implemented as a viable option for the majority of consumers. Exploring the adoption of
reusable packaging can help marketeers with their efforts of becoming more sustainable and analyzing whether concentrated refills and reusable packaging can revolutionize the way a category is dealt with.
In addition, by identifying the level of pro-environmental attitude it is possible to analyze how this variable will impact the choice of packaging the consumer intends to use. This could provide marketeers with more in depth information about a possible consumer profile so that the ideal strategies are applied.
Overall, the main goal of this study is to understand what explains the intention to use a reusable packaging and to provide marketeers with the necessary tools to improve the acceptance of these products.
1.4 Research Methods
In order to gather the necessary data to answer the proposed research questions, both secondary and primary data was collected. The first step was to analyze the existing literature, particularly from relevant academic papers, regarding the most important components of this study (Technology Acceptance Model, sustainability, packaging and pro-environmental attitude). This careful review assisted in defining the problem clearer as well as designing the primary data collection process.
As for the primary data, quantitative research was collected through a questionnaire that tested which type of packaging (reusable or single-use) was more attractive to the consumer. In order to do so, four different groups of respondents were exposed to different versions of a spray surface cleaner. Either a non-branded reusable cleaner, branded reusable cleaner, non-branded single-use cleaner and brander single-use cleaner. This questionnaire also sought information regarding the level of pro-environmental attitude of each respondent.
1.5 Dissertation Outline
This dissertation has a total of five chapters, starting with this introductory chapter where the problem statement and research questions are presented. The second chapter includes the literature review where the main findings of previous research can be identified. This compilation focuses on the Technology Acceptance Model, the pro-environmental attitude of consumers, research regarding packaging and its environmental impact, as these are the most important variables to consider when studying the intention to use a reusable packaging technology in the market. Methodology is presented in chapter three and will comprise the
detailed techniques used to gather data in order to answer the research questions and how the statistical analysis will be conducted. Chapter four covers the obtained results and tests the validity of the proposed hypothesis. Finally, chapter five concludes the dissertation with the main findings and limitations of the study, as well as suggestions for further research to be conducted.
CHAPTER 2: LITERATURE REVIEW AND CONCEPTUAL FRAMEWORK
The following chapter aims to summarize previous research and literature regarding topics that are relevant for a better understanding of the research purpose of this thesis. The literature review begins with an overview of the Technology Acceptance Model (TAM), followed by an explanation of packaging and its sustainable alternatives. Moreover, the concept of sustainability and consumer’s pro-environmental attitude is also presented. Taking into consideration the literature, the hypotheses were defined. Finally, the conceptual framework presented summarizes the relationships between each variable and provides an overview of the study.
2.1 Technology Acceptance Model (TAM)
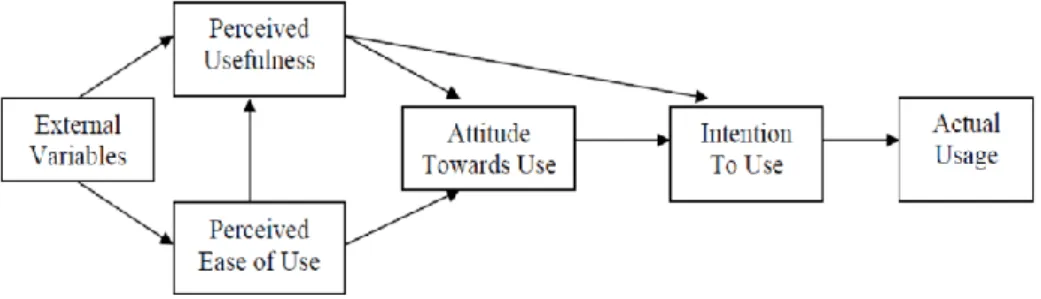
In a time where technology was quickly becoming part of the daily life, there was the growing need to create a model that forecasted how users would react to a new technology. The Technology Acceptance Model (TAM) was introduced by Fred D. Davis in 1985 with the main goal of refining the understanding of a user acceptance processes and to provide insights regarding the design and implementation of a system (Davis, 1985). This model would allow designers and creators to test how a technology or system would be perceived before proceeding with its implementation. As a starting point for the model, F. D. Davis used the Theory of Reasoned Action (TRA) (Ajzen & Fishbein, 1975) which presented a more psychological and human-centric approach that intended to discover which were the motives behind an individual’s behavior. The TRA defends that an individual’s conscious behavior is explained by their attitudes, subjective norms and beliefs and behavioral intention. In order to adapt the model, Davis eliminated the subjective norm in predicting a behavior and considered simply the attitude towards the technology. In addition, two main concepts were identified – perceived usefulness (PU) and perceived ease of use (PEOU) – which would be adequate to evaluate the attitude of a user towards a system. The Technology Acceptance Model narrows the previous application to information systems with the adoption and behavior of computer technologies (Rodrigues Pinho & Soares, 2011). The TAM has become such an important resource that it has been cited in the majority of the research regarding the acceptance of technology (Lee, Kozar, & Larsen, 2003).
TAM’s framework assumes that the adoption of a new technology will depend primarily on the Perceived Usefulness (PU) and on the Perceived Ease of Use (PEOU). Both factors will influence the Attitude Towards Use (ATU) and therefore, the Intention to Use (ITU). The final variable in the model is the Actual System Use (ASU).
Figure 1: Technology Acceptance Model (Davis, 1985)
2.1.1 Perceived Usefulness
Perceived Usefulness has been defined as “the degree to which an individual believes that using a particular system would enhance his or her job performance” (Davis, 1989). Meaning, perceived usefulness will depend on the consumers’ perception of the result of a certain system. If the system was “capable of being used advantageously”(Davis, 1989) than there is a positive perceived usefulness. Perceived usefulness derives from what extent users believe that the system or technology will increase their job performance (Davis, 1989).
Based on research concerning this variable, the following hypothesis was formulated:
H1: Perceived Usefulness and Perceived Ease of Use mediate the relationship between
packaging and intention to use.
H1a: Perceived Ease of Use mediates the relationship between packaging and Intention to
Use.
H1b: Perceived Usefulness mediates the relationship between packaging and Intention to Use.
In addition, perceived usefulness has been shown to have a stronger effect on intention to use than perceived ease of use. This effect is explained by the fact that no matter how easy a technology is to use, a user will not adopt it if considered useless. This has led to the following hypothesis:
H2: Perceived Usefulness has a stronger effect on Intention to Use than Perceived Ease of
2.1.2 Perceived Ease of Use
Perceived Ease of Use is defined as “the degree to which an individual believes that using a particular system would be free of physical and mental effort” (Davis, 1989). If a technology is perceived as useful but requires a more complicated use, the positive benefits are overshadowed by the difficulty associated with the use. Ease of use is defined by Davis as “freedom from difficulty or great effort”. Due to the fact that a part of a user’s job is to use the system, perceived ease of use is also described as the perception an individual has on how easy and simple is to use the technology (Venkatesh, 2000).
Additionally, perceived ease of use is described as having a direct effect on perceived usefulness. According to Davis (1993), a system that is easier to use is perceived as being more useful. However, the reverse relationship does not seem to have an effect. Davis states that “making a system easier to use, all else held constant, should make the system more useful. The converse does not hold however” (Davis, 1993).
Due to the mentioned interaction between perceived ease of use and perceived usefulness, the following hypothesis was assembled:
H3: Perceived Ease of Use impacts positively Perceived Usefulness.
2.1.3 Intention to Use
According to Technology Acceptance Model literature, Intention to Use reflects a user’s desire to use a technology in the future (Teo & Zhou, 2014). It is commonly used as an outcome variable since it is the single best predictor of actual system usage (Davis & Venkatesh, 1996). 2.1.4 TAM Limitation and Extensions
Being one of the most influential and used models in studying the acceptance of technologies, there are many extensions and applications of the model. One of the greatest advantages but also limitations of the model is its adaptability to variations. Some of the most relevant extensions take into consideration behavioral and social variables (Venkatesh, & Davis, 2010) and test online technologies like e-services (Featherman & Pavlou, 2003; Pavlou, 2014). Although the Technology Acceptance Model has been used in research for the past decades, there are still unexplored areas of potential application that could continue to validate the model (Marangunić & Granić, 2015) in addition to gaps that make it incomplete in certain areas.
The first limitation of the model is the self-reported use. The model fails to measure system in use and focus solely on the variance in the self-reported use (Legris, Ingham, & Collerette, 2003) which is not a precise measure. This type of study often leads to biases that may alter the relationship between variables (Agarwal & Karahanna, 2000; Podsakoff, P. M., & Organ, 2015). The second most reported limitation is the fact that the model looks simply at one task at a single point, falling then in the generalization problem in any sort of study ((Lee et al., 2003). Finally, most of the research conducted with the TAM resourced to the use of students. While this is an easy form of achieving the data, it can also deteriorate the generalization of the findings (Lee et al., 2003). Furthermore, other mentioned limitations include the use of single measurement scales, short exposure to the technology before testing and self-selection biases of the subjects (Lee et al., 2003).
2.2 Packaging
Due to the effects of globalization and the internationalization of packaged goods, companies have been forced to analyze where their competitive advantage originates. Packaging has quickly become the differencing factor and a source of both revenue and concern for businesses (Rundh, 2009). Originally, the main functions of packaging were deeply connected with practicality. Other than containing the product and ensuring its safety, packaging was also thought of as a mechanism to ease distribution and successfully present the product to consumers (Dharmadhikari, 2012; Silayoi & Speece, 2007). This concept, defined as a form of art by some researchers, has specific key words for its function in the existing literature such as protection, preservation, display and description (Dharmadhikari, 2012; Kotler & Keller, 2016). However, the role of packaging has changed through time and now it can be seen as both protective, communicative and as one of the elements of a brand (Keller, 2013). Research by Vilnai-Yavetz and Koren (Vilnai-Yavetz & Koren, 2013) believes that packaging should be thought of as having four main characteristics. It should be effective, instrumental since it protects its content, aesthetic in order to attract more consumers and symbolic by communicating the brand values properly. In addition to this, Twedt also defines four main aspects of packaging that form the acronym VIEW. This stands for visible, informative, emotional appealing (should show the product’s personality) and workable in the sense that it should still preserve its primary function (Twedt, 1968).
Products should be easily found on shelves and convey information that may be of interest to a potential customer (Maja Arslanagid, 2012). Research mentions both imagery elements
(graphics, color, shape, size) and informative elements (information regarding producer, country of origin, brand) (Silayoi & Speece, 2007). Kotler (Kotler & Keller, 2016), divides packaging features in two blocks as well, but focuses on structural elements such as form, size and material and graphic elements which are equivalent to the imagery elements in Silayoi & Speece framework.
Packaging has become an extension of the brand and of the product in the market (Ahmed, Parmar, & Amin, 2015) which is why most organizations now focus on it as a promotion tool. 2.2.1 The Relevance of Packaging
The importance of packaging and its effect in the decision-making process has been subject of research for many years. With competition continuously increasing in the world of packaged consumer goods and the proliferation of brands due to globalization, obtaining differentiation is necessary and often done with packaging (Ampuero & Vila, 2006; Underwood, 2001, 2003). With more than 70% of purchase decisions being made at the shelf, packaging is frequently the last impression on the consumer before this decision is made (Nawaz, Billoo, & Asad, 2012) as well as the first product attribute that a consumer is exposed to (Argo & White, 2012). It takes on an significant part in differentiating the brand among competitors and is one of the reasons for this phenomena is that consumers may not invest a lot of time thinking about brands before going to a physical shop to buy (Silayoi & Speece, 2007).
Packaging has shifted from a protector to a persuader (Agariya, Johari, Sharma, Chandraul, & Singh, 2012) and represents an essential part of any product today since it provides the consumer information regarding its attributes and benefits as well as a guarantee that it will satisfy wants and needs and attract customer attention (Maja Arslanagid, 2012). As proven in previous research (Silayoi & Speece, 2007), the most important attribute for a consumer’s likelihood to buy is the packaging technology. The latter conveys a message of convenience and ease of use.
In terms of the communication impact of packaging, research by Behaeghel (1991) and Peters (1994) shows that it might be the most important communication method. This is explained by the fact that it is wide spread and reaches most of the potential buyers, it is the main source to gather the information the consumer might need and it is at the most crucial moment in the decision making process (Ampuero & Vila, 2006). In order to properly take advantage of this, manufacters should work on understanding the consumer response to their packaging and merge the consumer’s perception with the product design (Nancarrow et al., 1998).
In addition, packaging development may also provide several business benefits such as an enhancement of the product experience, new distribution channels and opportunities as well as the already mentioned increased impact at the point of sale (Nawaz et al., 2012). Moreover, packaging becomes a tangible representation of the brand values (Nawaz et al., 2012) and creates a product identity in which its characteristics may display the distinctiveness and originality of the product (Maja Arslanagid, 2012; Silayoi & Speece, 2007). For a number of authors, packaging should be thought of as an extension of the brand (Agariya et al., 2012; Ahmed et al., 2015; Ampuero & Vila, 2006; Keller, 2013) and a focal point due to its great reach when compared with advertising (Agariya et al., 2012).
Research also shows that the effect of packaging is more relevant in low involvement categories where most FMCG tend to fall into. The effect of packaging is stronger in this type of product which may be due to the lack of research in the decision making process (Grossman & Wisenbilt, 1999).
The importance and strategic relevance of packaging is expected to continue a source of criticism from consumers and support the developing formats that take into consideration new options regarding ethical considerations as long as packaging plays such an important role in the decision-making process (Bone & Corey, 2000).
2.2.2 The Environmental Impact of Packaging
The rising concern with the environment has been leading both companies and consumers to change their production and consumption habits. With each inhabitant of the European Union generating on average 170 kilograms of waste in one year (Elgaaied-gambier, 2019; Eurostat -
Packaging Waste Statistics, n.d.), manufactures have been working on ways of reducing their
impact on the world. Whether by a reduction of packaging materials, the creation of returnable packaging or by increasing recycling (Kooijman, 1993), efforts have been increasing to meet consumers’ expectations.
In addition, consumers have also become more conscious of the impact of their choices and life styles in the environment (Stolz et al., 2013) and have made efforts to educate themselves and change their purchasing behaviors (Scott & Vigar-Ellis, 2014). This creates demand for more conscious products (Ampuero & Vila, 2006).
Like mentioned before, the need for sustainable living is no longer arguable. According to the Living Planet Report, the population is using 50% more resources than the earth can provide
(WWF, 2018) which has called the interest of governments, institutions and NGO’s around the world. Most countries have now introduced legislation that bans the use of certain materials and penalizes companies who do not comply with environmentally-friendly behaviors (Rundh, 2009).
One of the aspects that has received great attention is packaging sustainability (Elisa, Balta-Ozkan, & Reefke, 2017). The increase in research regarding the environmental costs of packaging (Bone & Corey, 2000; John Thogersen, 1999; Roper & Parker, 2006) suggests that this conscious feature should be a relevant attribute for any product (Pirsch, Grau, & Gupta, 2007). Therefore, the introduction of green or sustainable packaging has been one of the alternative ways of convincing the new green niche market (Magnier & Schoormans, 2015). Evidence shows that ethical product characteristics have a indistinct impact on choices made by consumers (Bech-Larsen, 1996). The increase in the number of green products available to the consumer sustains previous research and shows how traditional products are now facing a green competitor (Lin & Chang, 2012).
Besides the benefits for the environment, research shows that a sustainable business also has its own advantages. Enduring in social responsibly practices increases the consumer perception of the brand and eventually leads to higher profits (White, Lin, Dahl, & Ritchie, 2016).
2.2.3 Green Packaging
Sustainable or green packaging is often defined resourcing to the criteria specified by the Sustainable Packaging Alliance (SPA) where packaging should be safe and beneficial to individuals and communities across all phases of its life cycle; is sourced, manufactured, transported, and recycled using renewable energy; takes advantage of the use of recycled materials; manufactured using clean techniques; recovered and utilized in closed loop cycles (Jerzyk, 2016). These green products tend to be biodegradable and carry natural and nontoxic formulas. As for its packaging, green products focus on reusable, recyclable materials whose disposable or incineration does not produce a negative effect for the environment (Lin & Chang, 2012).
2.2.4 Reusable Packaging
One of the most discussed solutions for this problem has been using reusable or refillable packaging (Lofthouse & Bhamra, 2006). Reusable packaging can be defined as having the capacity of being used more than once opposed to one-way or single-use packaging (Mollenkopf, Closs, Twede, Lee, & Burgess, 2005). This reusable solution goes against the
trend of disposable products that has entered the market in the past couple of decades and that is responsible for the high number of single-use packaged goods (Mccollough, 2007).
In the study by Lofhouse and Bhamra, the main reasons that are associated with the consumer using reusable packaging are concerns with reduced waste, convenience to use and easier transportation. However, the factor that is more correlated with lack of interest to use this packaging is the inconvenience associated with reusable packaging. Consumers mention increased storage as one of the most troublesome factors since it requires keeping empty containers as well as the frustration of taking the extra time to clean and refill the package (Lofthouse, 2007). In addition to this, they associate refillable packaging with lack of flexibility since only one type of refill typically fits the dispenser (Lofthouse, Bhamra, & Trimingham, 2009).
In order to promote the use of reusable packaging, these need to be convenient as well as providing an additional incentive such as cost benefits. In terms of manufacturing, there are several issues that deserve more attention such as durability and chosen material. Research also argues that using reusable packaging actually yields in a higher cost for the producer (Kooijman, 1993). Kooijman believes that one should not take into consideration the environmental effects of single-use packaging without taking into consideration the effects in the production chain (Kooijman, 1993).
Innovative packaging is a source of competitive advantage and companies are rushing to be one of the first movers in green packaging (Dangelico, 2010). These types of products are also particularly interesting to most manufactures since study shows that there is willingness to pay a price premium for sustainability (Chaudhary, 2014).
2.2.5 Concentrated Formula to Reduce Packaging Waste
One of the alternative ways of reducing the amount of packaging in goods is through a change in its core formula however, existing literature on this topic is still rare. Packaged consumer goods are often sold in its ready to use formula which either includes a large percentage of water that could be added later by the consumer or that it could be sold more concentrated by small adjustments the formula (Dharmadhikari, 2012). FMCG companies have been looking into this as a solution for products like laundry detergents and softeners where the traditional bulky package are replaced by small and concentrated formulas that offer the same dosages (Dharmadhikari, 2012; Wever, Schermer, Smit, & Vos, 2015). In addition to this alternative, Lofthouse also approaches the use of concentrated products mixed in the original reusable
packaging. In this case, the consumer buys a concentrated refill pod and dilutes it with water in the already purchased bottle (Lilley, Lofthouse, & Bhamra, 2005). In addition to reducing the amount of packaging, smaller products can be responsible for reduced transportation costs and more shelf space (Dharmadhikari, 2012; Lofthouse et al., 2009).
In a study by Loughborough University, most respondents have enjoyed previous experiences with these concentrated products. However, consumers voiced their concerns regarding availability in the retailer, since it would become necessary to stock both the original packaging as well as the concentrated refills and health and safety concerns due to their higher involvement mixing the products. An important aspect to mention is that refills are perceived as needed to be cost effective and easy to use. The study also reinforces the need of an effective communication for these innovative products in order to teach consumers how to properly take advantage of them (Lilley et al., 2005; Lofthouse et al., 2009).
Creating new environmentally-friendly options, can be an effective way of encouraging the consumer to take a more sustainable approach to their day-to-day choices (East, Samarakoon, Pranamornkith, & Bronlund, 2015).
2.3 Sustainability and Pro-Environmental Attitude
The past decades have been extremely important for consumers to realize their individual impact on the environment and on the future of the next generations (Elgaaied-gambier, 2019; Gershoff & Frels, 2015). Therefore, consumers’ concern with purchasing goods that are substantially less harmful to the environment and that take into consideration the nature of the resources has been significantly increasing over time (Gershoff & Frels, 2015).
Even though pioneer research on sustainability dates back to 1948 (Adams, Jeanrenaud, Bessant, Denyer, & Overy, 2016), the concept remains difficult to clarify. It can be defined as an attitude that reflects the extent to which a consumer is worried about threats to the environment, consequences for the harmony of nature and future generations and the lack of human action to protect the environment for future generations (Abdul-Muhmin, 2007).Therefore, sustainable consumer consciousness is explained by behaviors that lead to a decrease in the environmental impact throughout the lifecycle of a good (Joshi & Rahman, 2015; Moisander, 2007; White, Habib, & Hardisty, 2019). However, some definitions refer to the egoistic self rather than to the social definition.
This trend is motivated by a common characteristic among today’s consumers: the desire to feel good about their chosen products and companies (Banerjee & Wathieu, 2017; Kitzmueller & Shimshack, 2012). Consequently, research shows that these consumers are willing to pay a price premium for a product that falls in these characteristics (Banerjee & Wathieu, 2017). Even though it is clear the rise in the number of sustainable consumers, there is little evidence that the market share of green products has increased as well. Research shows that the market share of green products remains in the 1-3% of the entire market (Johns, Kilburn, & Bray, 2011; Joshi & Rahman, 2015). This can be explained by the inconsistency between consumers’ attitudes and behaviors (Ferguson, Silva, & Oliveira-brochado, n.d.; Tanner & Kast, 2003). The problem is no longer availability of products and some believe that this effect is caused by the additional effort and research that green products require (Young, 2010). This gap between attitudes and behaviors is defines as the “Green Purchasing Inconsistency” or “Green Attitude-behavior Gap” (Joshi & Rahman, 2015). Even consumers that score high in the level of consciousness still experience this gap as their decision often focuses on several product attributes and not just on the environmental aspect (Rokka & Uusitalo, 2008).
While in the past, decisions were made with the main goal of increasing the benefits for the individual, sustainable choices are characterized by a long-term effect and a selfless attitude by the consumers (White et al., 2019). Furthermore, there are aspects that companies can take into consideration to promote the propagation of sustainable behaviors. White et al. define five main routes that include through social influence, habit formation, the individual self, feelings and cognition and tangibility (White et al., 2019).
One thing is for certain: sustainability is not an ephemeral trend but an important problem that affects everyone (Albino, Balice, Maria, & Iacobone, 2012).
2.3.1 Consumers’ Pro-Environmental Attitude
With today’s consumers becoming more well-informed, environmental matters escalated to the top of their social concerns (Cleveland, Kalamas, & Laroche, 2002). This has attracted many researchers to attempt and quantify this level of environmental attitude and its potential consequences. A pro-environmental attitude has been explained as attitudes that attempt to reduce the negative impact of one’s actions on the environment (Kollmuss & Agyeman, 2002). However, there is evidence that a pro-environmental attitude will not necessarily result in an environmental behavior (Cleveland et al., 2002; Pickett-Baker & Ozaki, 2008). Like mentioned
before, this attitude-behavior gap has been studied for many decades but there is still compelling evidence (Ajzen & Fishbein, 1974, 1977) that beliefs form attitudes towards behaviors that can be summarized as intention of behaviors (Theory of Planned Behavior). Consequently, pro-environmental attitudes do not guarantee pro-pro-environmental behaviors but it is highly expected that those who have a pro-environmental attitude behave in such way (Mainieri et al., 2010; Pickett-Baker & Ozaki, 2008). Therefore, attitudes are still considered the most reliable explanatory factor in predicting green behaviors (Chen & Chai, 2010).
Additionally, research has also found that environmental attitudes may vary throughout cultures. Countries who are more collectivist and less long-term orientated showed more environmental concern than those who are individualistic and long-term orientated (Sarigöllü, 2009).
Although this attitude-behavior gap, pro-environmental attitude has been proven to be a good moderator for sustainable behaviors (Dunlap, Liere, Mertig, & Jones, 2000; Tanner & Kast, 2003). Therefore, the following hypothesis were drawn:
H4a: Pro-Environmental Attitude moderates the relationship between packaging preference
and Perceived Ease of Use.
H4b: Pro-Environmental Attitude moderates the relationship between packaging preference
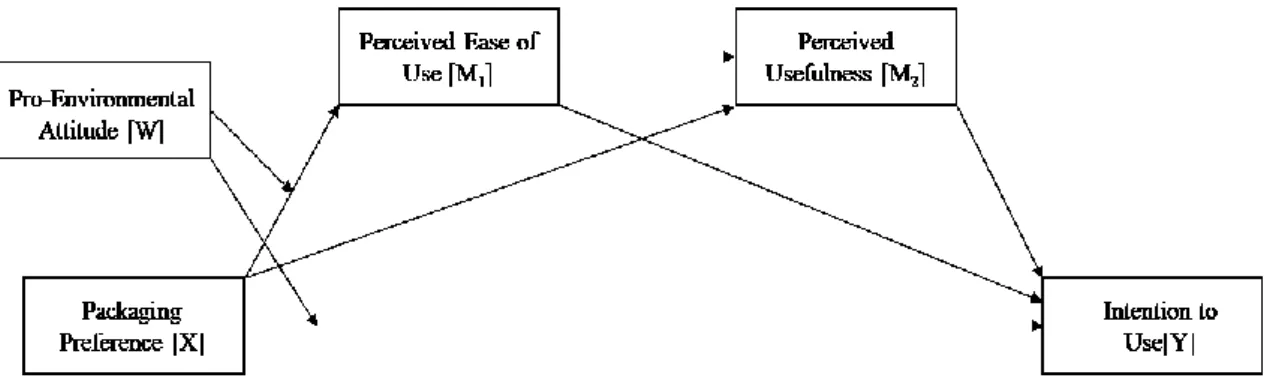
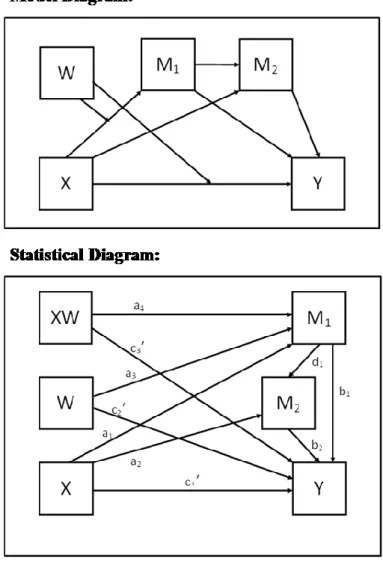
2.4 Modified TAM: Reusable Packaging Technology Acceptance Model
CHAPTER 3: METHODOLOGY
The following chapter presents and explains in detail the methodology used to answer both the research questions and the proposed hypotheses. It starts with an explanation of the research approach followed by information regarding the primary and secondary data collection. Due to the complexity of the primary data, details on data measurement and analysis are also included. 3.1 Research Approach
The objective of this dissertation is to gain insights on the drivers of the intention of consumers to use reusable packaging. This was achieved by conducting a literature review on topics such as sustainability, pro-environmental attitude, packaging and its effects on the environment, which later allowed for the conceptual framework to be developed.
In order to answer the research questions and test the validity of the proposed hypotheses, different research methods were employed. In this dissertation, two methods were favored, namely the exploratory and the explanatory methods. In the initial stage, the exploratory method was used by searching in the existing literature for information that could help determine the appropriate variables and hypothesize its connections. Regarding the explanatory method, the main goal was to test the proposed hypotheses and explain their interactions. Furthermore, this study focuses solely on quantitative data to validate the hypotheses and reach the desired conclusions.
3.2 Secondary Data
To gather information for the literature review, secondary data was collected mainly from online databases which provided academic articles from prestigious journals. The collected data was essential to provide a better understanding of the problem statement and of the variables used in the conceptual framework. Additionally, secondary research was also needed to define which constructs to use in this study.
3.3 Primary Data
The primary data was obtained through an online survey. Resourcing to this research approach may lead to great advantages but also some issues for the overall research. While low in costs, high in speed of response and convenient to analyze, there is little control over the respondent, no opportunity to clarify questions and it may not be representative of the population (Malhotra, Nunan, & Birks, 2017)
To ensure the effectiveness and comprehension of the survey, a pilot test was conducted. This took into consideration 11 responses, which led to adjustments being made, taking the feedback into consideration.
3.3.1 Online Survey 3.3.1.1 Data Collection
The main goal of this study was to obtain data regarding consumers’ willingness to use a reusable packaging technology and the chosen category to investigate this was the home care category. As seen in the literature review, plastic is one of the most polluting materials and companies have been actively trying to reduce its used amount. This category typically uses large packaging and there is little effort being put into reusable options. Most of the options that reduce the packaging amount focus on concentrated formulas, but this is mostly true for other products in the category such as laundry detergents and softeners. Therefore, the product chosen to serve as stimuli was a surface cleaner in a spray bottle. This was inspired by Unilever’s recent launch in the UK that uses the packaging technology tested in this study: reusable bottle and concentrated refills. Since this type of technology is only available in the UK (with Unilever’s CIF) and in North America (with SC Johnson’s brands like Windex), european respondents are typically not used to seeing this type of product in a reusable and refillable form, making results unbiased, which should provide a clear idea of the intention to use.
Data collection took place between the 23rd November 2019 and the 29th November 2019
through an online questionnaire that was distributed mainly through social media platforms (Facebook, LinkedIn, Instagram). Additionally, to increase respondents’ motivation to fill out the survey, a monetary giftcard from a large retailer was raffled.
As for the target population, the focus was on consumers who are regularly involved with home care products. Thus, to guarantee compliance with this premise, the control questions automatically excluded those who had not purchased any type of cleaning products in the last year nor used a surface cleaner in the last trimester. There was only one restriction in terms of nationality which was to exclude people from the UK and North America who could have already been in contact with the product. The questionnaire was available both in english and portuguese.
Overall, data was collected through a non-probability sampling technique, meaning that the sample was not randomly chosen throughout the population. This technique is reasonable due
to time and financial constraints and the difficulty in determining the correct sample. Additionally, a convenience technique (Malhotra et al., 2017) was also used, leading to less variations in the population which may be responsible for limitations in this research.
The survey was closed with a total of 479 responses of which only 402 were considered valid. This is mainly due to unrealistic response time, not complying with theprerequisites and the presence of outliers. The randomly assigned stimuli were evenly distributed, resulting in 101 being exposed to stimulus 1, 101 to stimulus 2, 100 to stimulus 3 and 100 to stimulus 4. 3.3.1.2 Research Design
The questionnaire had a cross-sectional design as data was only collected once from the given population. This model had a 2 (reusable, single-use) by 2 (brand, no brand) design.
Figure 3: Cross-Sectional Design Matrix
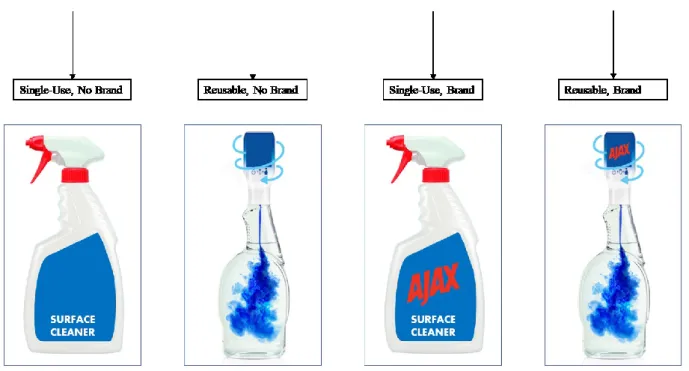
The survey (Appendix 1) is composed by four sections, starting with the control questions. As mentioned above, the latter focused on refining the sample for this analysis by excluding those who had not purchased or used a cleaning product in the last year and trimester, respectively. In the second section of the survey, respondents were asked about their pro-environmental attitude and to define how this might impact the intention to use a reusable packaging product. In the third section, they were shown one of four stimuli (Figure 4) and then inquired about its perceived usefulness, perceived ease of use as well as intention to use. To provide further detail and information, each stimulus showed a written description in addition to the visual element. The fourth and final block focused on demographic questions concerning age, gender, nationality, marital status, occupation, education and income.
Figure 4: Stimuli Shown to Different Groups of Respondents
3.3.2 Measurement / Indicators
Taking into consideration what was mentioned in the previous section, the beginning of the questionnaire analyzed the fit of the respondent to the study. The following sections – pro-environmental attitude and the chosen stimulus - were randomized to ensure the variables were not compromising the study. All items in the survey were presented in a 7-point Likert scale, ranging from “Strongly Disagree” to “Strongly Agree”.
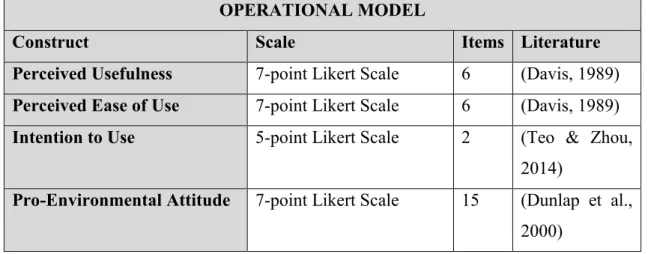
Since this conceptual framework is a modified and adapted model of the Technology Acceptance Model, two of the variables use constructs developed by F.D. Davis (1989) himself. This is the case of perceived usefulness and perceived ease of use which have six questions each and use a 7-point Likert scale in the original model. As for intention to use, the chosen construct was by T. Teo, M. Zhou (2014) whose starting point was the TAM. In this case, the scale had to be adapted from a 5-point Likert scale to a 7-point Likert scale.
To test the consumers’ pro-environmental attitude, the construct used was the New Environmental Paradigm (Dunlap et al., 2000). This model uses a 7-point Likert scale to determine where a consumer stands in terms of his/her attitudes towards the environment. This model was designed to tap on different aspects of a pro-environmental attitude such as the fragility of nature’s balance and the reality of the limits to growth. The construct is composed by 15 questions that are phrased both negatively and positively, providing more accurate responses.
OPERATIONAL MODEL
Construct Scale Items Literature
Perceived Usefulness 7-point Likert Scale 6 (Davis, 1989) Perceived Ease of Use 7-point Likert Scale 6 (Davis, 1989) Intention to Use 5-point Likert Scale 2 (Teo & Zhou,
2014)
Pro-Environmental Attitude 7-point Likert Scale 15 (Dunlap et al., 2000)
Table 1: Operational Model
Additionally, besides testing reusable packaging, the stimuli also allows to test the impact of a brand on intention to use. In order to test this, research was conducted to determine which brand is popularly used across Europe and maintains its brand elements (e.g. name, logo) in the majority of the countries. Due to the lack of available data concerning market share, AJAX was the chosen brand due to its name and brand elements’ consistency across european countries. 3.2.3 Data Analysis
All quantitative data collected was analyzed using IBM’s software, SPSS. The main objective of this analysis is to confirm the suggested hypotheses and test the statistical significance of the variables’ interactions. Firstly, the degree of reliability of each construct was checked by calculating the Cronbach’s Alpha. After generating descriptive statistics and frequencies to get an overview of the sample, the collected data was split into two sections. The first part of the analysis only considers data from stimuli that did not include the brand. During this stage, the Process Macro by Hayes (Hayes, 2013) will be the main tool as all the hypotheses are based on mediations and moderations. The used models vary according to the hypotheses but in the final stage of the analysis, model 86 was used to demonstrate the complete effect of the conceptual framework.
Additionally, the further results section analyzes the brand effect on intention to use in the reusable packaging stimuli. Finally, a k-means cluster analysis was also performed to identify any possible pattern in the level of usage, pro-environmental attitude and demographic features of consumers.
CHAPTER 4: RESULTS AND DISCUSSION
The following chapter will present the analysis of the quantitative data. It will begin with a characterization of the overall sample and a reliability test, followed by testing each hypothesis and presenting its statistical result.
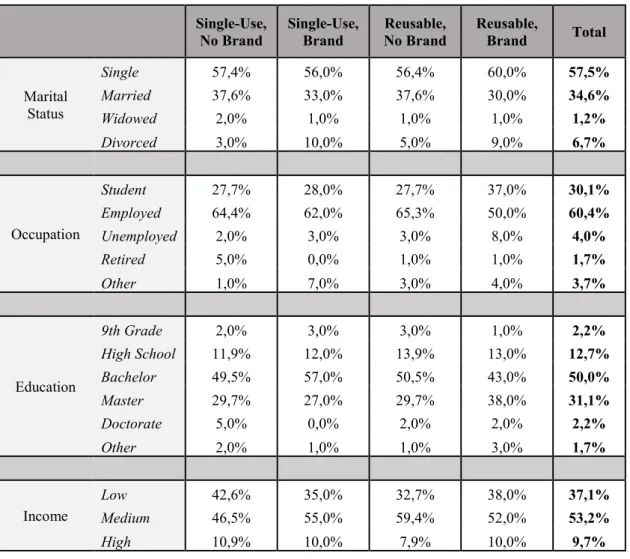
4.1 Sample Characterization
From a total of 479 answers, 77 respondents were excluded from the sample for not complying with the control questions, for having unrealistic response time or for being identified as outliers. The remaining 402 responses are presented in the table below according to their exposed stimulus. The total number of respondents was evenly divided across groups with Qualtrics randomization tool.
Due to the distribution and sampling technique used, it is possible to observe that the large majority of respondents were Portuguese with ages between 18-24. The nationalities included in other were all from European countries, mainly Italy and Germany. There is also a larger percentage of valid female answers, resulting in 61% of the sample being women.
Single-Use,
No Brand Single-Use, Brand Reusable, No Brand Reusable, Brand Total
Respondents Total 101 100 101 100 402 Male 45,5% 33,0% 41,6% 35,0% 38,8% Female 54,5% 67,0% 58,4% 65,0% 61,2% Age Less than 18 0,0% 0,0% 0,0% 1,1% 0,2% 18-24 27,5% 26,7% 31,9% 28,9% 35,8% 25-34 24,2% 16,7% 15,4% 22,2% 17,7% 35-44 17,6% 10,0% 14,3% 16,7% 13,2% 45-54 16,5% 35,6% 24,2% 16,7% 20,9% 55-64 13,2% 11,1% 14,3% 13,3% 11,7% 65-74 1,1% 0,0% 0,0% 0,0% 0,2% Over 75 0,0% 0,0% 0,0% 1,1% 0,2% Nationality Portuguese 85,1% 88,0% 90,1% 94,0% 89,3% Other 14,9% 12,0% 9,9% 6,0% 10,7%
Single-Use,
No Brand Single-Use, Brand No Brand Reusable, Reusable, Brand Total
Marital Status Single 57,4% 56,0% 56,4% 60,0% 57,5% Married 37,6% 33,0% 37,6% 30,0% 34,6% Widowed 2,0% 1,0% 1,0% 1,0% 1,2% Divorced 3,0% 10,0% 5,0% 9,0% 6,7% Occupation Student 27,7% 28,0% 27,7% 37,0% 30,1% Employed 64,4% 62,0% 65,3% 50,0% 60,4% Unemployed 2,0% 3,0% 3,0% 8,0% 4,0% Retired 5,0% 0,0% 1,0% 1,0% 1,7% Other 1,0% 7,0% 3,0% 4,0% 3,7% Education 9th Grade 2,0% 3,0% 3,0% 1,0% 2,2% High School 11,9% 12,0% 13,9% 13,0% 12,7% Bachelor 49,5% 57,0% 50,5% 43,0% 50,0% Master 29,7% 27,0% 29,7% 38,0% 31,1% Doctorate 5,0% 0,0% 2,0% 2,0% 2,2% Other 2,0% 1,0% 1,0% 3,0% 1,7% Income Low 42,6% 35,0% 32,7% 38,0% 37,1% Medium 46,5% 55,0% 59,4% 52,0% 53,2% High 10,9% 10,0% 7,9% 10,0% 9,7%
Table 2: Sample Characterization
4.2 Measure Reliability
Furthermore, to check the reliability and consistency of the variables used for this study, a Cronbach’s alpha test was conducted. Even though all constructs were extracted from previously tested literature, it is still important to guarantee viability of the data. The test was run for pro-environmental attitude, perceived ease of use, perceived usefulness and intention to use, per stimulus.
Due to the existence of both negative and positive variables in the pro-environmental attitude constructs, the negative variables were recoded to ensure the results are comparable. Out of the 15 items that make up the construct, the eight odd-numbered were framed positively, meaning agreement indicates a pro-environmental attitude and the seven even-numbered were framed negatively, where disagreement indicated a pro-environmental attitude. The seven even-numbered were recoded.
All the constructs had Cronbach’s alpha’s above 0.8, meaning that they are reliable enough to predict the variables and proceed with the data analysis.
CRONBACH’S ALPHA
Construct # of Items Total
Pro-Environmental Attitude 15 0.804
Stimulus 1: Single-Use, No brand
Perceived Ease of Use 6 0.907
Perceived Usefulness 6 0.933
Intention to Use 2 0.894
Stimulus 2: Single-Use, Brand
Perceived Ease of Use 6 0.832
Perceived Usefulness 6 0.932
Intention to Use 2 0.858
Stimulus 3: Reusable, No brand
Perceived Ease of Use 6 0.809
Perceived Usefulness 6 0.936
Intention to Use 2 0.925
Stimulus 4: Reusable, Brand
Perceived Ease of Use 6 0.853
Perceived Usefulness 6 0.938
Intention to Use 2 0.886
Table 3: Cronbach's Alpha of Constructs
4.3 Results from the Hypotheses Testing
In order to get a better understanding of the relationships between the predictor variables and the outcome variable, several statistical tests were performed to test the validity of the hypotheses. Due to the nature of the conceptual framework, the conducted tests were simple and multiple linear regressions. As the hypotheses aim to test the moderation and mediation effects, this analysis uses the Process Macro.
A preliminary analysis was conducted to ensure that none of the regression assumptions was violated and could eventually compromise the validity of the data. Regarding the independence assumption, it is possible to assume that the variables are independent since information was collected only once and was distributed across groups, making it impossible for information about one, to provide data about another. As for multicollinearity, two tests were conducted to rule out this assumption violation.
Starting with the correlation matrix, all independent variables were included, and the Pearson’s bivariate correlations were all less than 0.80. As for the Variance Inflation Factor (VIF), all values were below 2 which indicates that multicollinearity is not an issue. Regarding the remaining assumptions, it is possible to see that the residuals are normally distributed and linear. Additionally, error terms are independent from each other.
Before proceeding with the analysis, it is important to mention that the level of significance used is 5% and that packaging preference has been coded as a dummy variable where 0 corresponds to single-use packaging and 1 corresponds to reusable packaging. Only non-branded stimuli were used in the first stage of the analysis as the main goal of this dissertation is to test intention to use a reusable versus a non-reusable packaging.
4.3.1 Hypothesis 1
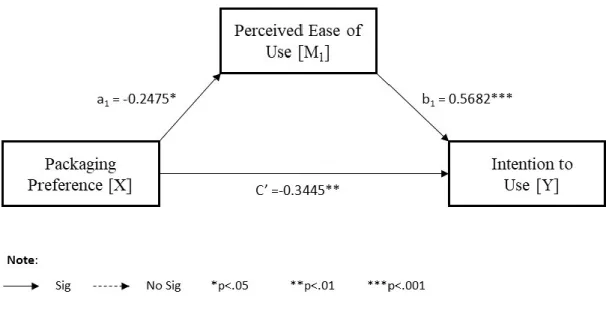
H1a: Perceived Ease of Use mediates the relationship between packaging preference and Intention to Use
With the purpose of studying the mediation effect of Perceived Ease of Use on the relationship between the package preference and the intention to use, Process’ model 4 was used. The latter accounts for a simple single mediator analysis and the results can be found on Appendix 2. Overall this model is significant and with an R-Square of 21%. Starting with the effect of the packaging preference on the perceived ease of use (path a) , it is significant and shows a negative effect of -0.2475 (p<.05). The bootstrapping confidence interval for the latter does not include zero, implying that the analysis is significant.
Regarding intention to use, the model is also significant, and it is possible to see that perceived ease of use (path b) has a significant (p<.001) positive impact of 0.5682 but that packaging preference continues to be significant with p<.01 and a direct effect of -0.3445. Due to this, the model suggests that perceived ease of use is a partial mediator since X is still explaining Y. In order to prove that there is mediation, especially partial, it is necessary to compare path c and c’. Path c’ is the direct effect of packaging type on intention to use while c is the total effect. The indirect effect represents how the dependent variable is influenced by packaging preference through a sequence where packaging preference influences perceived usefulness and how this influences intention to use. Therefore, c’ = -0.3445 and c = -0.3445+(-0.1406)=-0.4851. Therefore, despite being only a partial mediation, the proposed hypothesis is validated.
Figure 6: Statistical Model with Coefficients (H1a)
H1b: Perceived Usefulness mediates the relationship between packaging and intention to use
Once again, in order to determine the mediation effect of perceived usefulness on the relationship between the packaging preference and intention to use, model 4 was used and results can be found on Appendix 3.
Overall, this model is significant and with an R-Square of 22%. Starting with the effect of the packaging preference on the perceived usefulness (path a) , it is significant and shows a negative effect of -0.5 with p<.01. The bootstrapping confidence interval for the latter does not include zero, implying that the analysis is significant.
Regarding intention to use, it is possible to see that perceived usefulness (path b) has a significant (p<.001) positive impact of +0.3299 but that packaging preference continues to be significant with p<.05 and an effect of -0.3202. Due to this, the model suggests that perceived usefulness is a partial mediator since X is still explaining Y. In the total effect model, it is possible to see that packaging preference has an effect of -0.4851 in intention to use.
In order to prove that there is mediation, especially partial, it is necessary to compare path c and c’. Path c’ is the direct effect of packaging type on intention to use while c is the total effect. The indirect effect represents how the dependent variable is influenced by packaging preference through a sequence where packaging preference influences perceived usefulness and how this influences intention to use. Therefore, c’ = -0.3202 and c =-0.3202 + (-0.1649) = -0.4851. Therefore, despite being only a partial mediation, the proposed hypothesis is validated.
Figure 7: Statistical Model with Coefficients (H1b)
4.3.2 Hypothesis 2
H2: Perceived Usefulness has a stronger effect on Intention to Use than Perceived Ease of Use.
With the purpose of testing how the mediators work together, model 6 was run (Appendix 4). In order to test which mediator has the strongest effect, it is necessary to see their interactions working in serial model.
Overall the model is significant and explains 30% of the variance. Starting with the effect of packaging preference on perceived ease of use, it is possible to see that there is a significant (p<.05) negative effect of -0.2475. The bootstrapping confidence interval for the latter does not include zero, implying that the analysis is significant. As for the effects on perceived usefulness, packaging preference also plays a significant part (p<.05) with a negative effect of -0.3669. Additionally, the model provides more information about the relationship between perceived ease of use and perceived usefulness. This effect is significant and perceived ease of use has a positive effect on perceived usefulness of 0.5379.
Regarding the effects on intention to use, all p-values are significant and packaging preference is the only one that has a negative effect (-0.2492). This suggests that a reusable packaging has lower intention to use than a single-use packaging. Perceived ease of use and perceived usefulness have positive effects of 0.4285 and 0.2598, respectively. Therefore, it is possible to
understand which of the mediators has a stronger effect on the variable, and in this case, perceived ease of use has a stronger effect.
When looking at the direct effect, it is possible to conclude that X (packaging preference) still predicts Y (intention to use) significantly (p<.05) and has an effect of -0.2492. As for the indirect effects, all are significant as none of the bootstrapping confidence intervals includes zero. With the indirect effects, it is possible to understand that the model had two individual mediators that also cause a double mediation. This double mediation is proven by the indirect effect 3 (Packaging preference → PEOU → PU → Intention to use) that has an overall effect of -0.0346. The effects are stronger with each of the individual mediators though (PEOU has an effect of -0.1061 and PU has an effect of -0.0953).
Since the overall effect of X on Y (path c) is lessened by the inclusion of the mediators but there is still a significant relation, one can say that there is partial multiple mediation.
It is possible to conclude that perceived usefulness and perceived ease of use are partial mediators. Additionally, the proposed hypothesis is not validated since perceived ease of use has a stronger effect than perceived usefulness.
4.3.3 Hypothesis 3
H3: Perceived Ease of Use impacts positively Perceived Usefulness.
This hypothesis has been validated during the interpretation of model 6. It is possible to conclude that perceived ease of use influences perceived usefulness, which means that not only do the mediators work in series but also in parallel. Perceived ease of use causes a significant (p<.001) effect of 0.5379 on perceived usefulness. For every 1 unit increase in perceived ease of use, perceived usefulness will increase by 0.5379.
Figure 9: Statistical Model with Coefficients (H3)
4.3.4 Hypothesis 4
H4a: Pro-Environmental Attitude moderates the relationship between packaging preference and Perceived Ease of Use
In order to study the moderating effect of the pro-environmental variable between packaging preference and intention to use, a Process Macro was conducted. The latter took into consideration model 1 which accounts for a simple single moderation analysis and results can be found on Appendix 5. The main objective of this analysis is to understand how pro-environmental attitude explains how packaging preference affects intention to use on different specifications of the moderator.
Overall, the model is significant (p<.001), but only around 11% of the variance is explained by this model. Regarding the effects on perceived ease of use, it is possible to see that packaging preference has a negative effect of -1.17579 with a significant p-value (p<.001). This suggests that a reusable packaging will decrease perceived ease of use when compared to a single-use packaging. On the one hand, pro-environmental attitude does not have a significant effect on perceived ease of use (p-value=0.1867) but the interaction between pro-environmental attitude and the packaging preference is significant (p<.05), which suggests a moderation. According