Correcting for
Sampling Problems in
PISA and the
Improvement in
Portuguese Students’
Performance
Adriana Ferro
Pedro Freitas
Luís Catela Nunes
Ana Balcão Reis
Carmo Seabra
Working Paper
# 591
Correcting for sampling problems in PISA and the improvement in Portuguese
students' performance
Adriana Ferro*
Pedro Freitas*
Luís Catela Nunes*
Ana Balcão Reis*
Carmo Seabra*
1*
Nova School of Business and Economics, Universidade Nova de LisboaDecember 22, 2014
Abstract
PISA uses a complex sampling procedure based on stratification variables chosen by the participating countries’ authorities. In this paper we analyse the representativeness of the samples used in terms of the distribution of students per grade and track of studies for Portugal. For the three exam years under analysis (2006, 2009 and 2012) a meaningful bias between the effective student distribution and PISA samples was found. We provide recalculated PISA scores that correct for the sample bias. We find that from 2009 to 2012, contrary to the stagnation denoted in the PISA results, the recalculated scores show an improvement in the Portuguese student performance. We also decompose the evolution of the scores into two effects: (i) change in the student population distribution by grade and track, and type of school; and (ii) evolution in the performance of each type of student. The results show that for the whole period the evolution of the students’ scores is the main driver of the increase in PISA results, with the change in the population structure playing a weaker role. Although we focus on the Portuguese case, similar problems of representativeness are expected to arise in other countries with high retention rates, affecting the grade of study of 15-year-olds.
JEL: I20, I25
Keywords: PISA, sampling, educational achievement, age-based assessment
1 Financial support from Fundação para a Ciência e Tecnologia under grantPTDC/EGE-ECO/122754/2010 is gratefully
2
1.
Introduction
The Programme for International Student Assessment (PISA) was launched by the OECD in 2000 to test the skills and knowledge of 15-year-old students in the fields of Reading, Mathematics, and Sciences. Together with the results on the level of proficiency in the above mentioned fields, it includes surveys to the students, their families, and their schools about a considerable number of characteristics that are expected to be related with the educational achievement of students.
The results from the PISA tests together with the microdata from the PISA datasets have been extensively used to study the determinants of academic achievement, as well as to evaluate the temporal evolution of the efficiency of individual educational systems. There is also a broad literature that looks at international differences in educational achievement using the results from international tests, and in particular from PISA. Hanushek and Woessmann (2011) present a survey of the results from this research. For a recent use of the PISA dataset for the study of an educational policy issue, see Benito et al. (2014).
The attention raised by PISA results expanded well beyond the academic community, with several governments looking attentively at the results and even basing their educational policies on directions suggested by the comparative analysis of the results of participating countries. Hence, an evaluation of the credibility or generality of the results seems a most relevant exercise. One example of how problems with the way samples are constructed can lead to biased results is reported in the case of the PISA 2000 for Austria (Neuwirth, 2006).2
PISA results are based on a complex sampling procedure based on stratification variables defined by each participating country. The purpose of that process is to obtain a representative sample of the whole population of 15-year-old students, per country involved. However, the fact that an age-based population definition is used in PISA has important implications, especially when the results are contrasted with those coming from grade-based tests, as noticed by O’Leary (2001). In order to ensure the validity of the test
2
In Austria, the PISA 2000 assessment did not adequately cover students enrolled in combined school and work-based vocational programmes. As a consequence, the Austrian PISA 2003 national report erroneously reported a decline in performance in all three PISA domains (see Neuwirth, 2006).
3 results it is important that the different grades are correctly represented and weighted in the sample. This is especially important in countries with a high percentage of repeaters, as is the case of Portugal.
Portugal has been a participant country in the PISA study from the beginning. Table 1 shows the evolution of the results of Portuguese students in the PISA tests of Reading and Mathematics between 2006 and 2012. Two main facts are apparent: first, the remarkable increase occurring throughout the whole period, with score jumps of 16 points in Reading and 21 points in Mathematics; second, the whole increase seems to have occurred in the first sub-period, 2006-2009, with a stagnation or even regression being shown on the second sub-period. This peculiar path of change raises the question about whether it reflects the actual behaviour of the Portuguese educational system taking place in the period 2006 -2009 or whether it was due to specificities of the sampling procedure. This possibility is enhanced by the fact that Portuguese authorities changed the geographical stratification variable in 2009, a fact that may have affected the representativeness of the sample.
Table 1: PISA 2006-2012 - Scores for Portugal
Test PISA 2006 PISA 2009 PISA 2012
Reading 472 489 488
Mathematics 466 487 487
Our analysis of the representativeness of the PISA sample used for Portugal became possible as a result of the disclosure by the Portuguese Government, in 2014, of a rich administrative dataset with students’ population data since 2007.
In our study we observe that in the three PISA waves examined there were considerable deviations between the population represented by these PISA samples and the effective Portuguese population. Focusing on Mathematics and Reading, we recalculate PISA scores with the correct weights of each group of students, considering their grade and track of studies and type of school, and we show that there is a sizable impact on average scores: instead of the stagnation between 2009 and 2012 reported by PISA, we find an increase in both Reading and Mathematics during this period. Then, we decompose the evolution of the scores into two effects: (i) change in the student population distribution by grade and track, and type
4 of school; and (ii) evolution in the performance of each type of student. We apply this decomposition to the whole system and also separately to public and private schools. We conclude that the improvement in students’ scores prevailed over the change in the population structure as the reason to explain the positive evolution of the Portuguese PISA results from 2006 to 2012.
The organization of the paper is as follows: In section 2 we present the data; In section 3 we discuss the representativeness of the PISA samples and in section 4 the PISA scores are recalculated using a new set of weights adjusted to reflect the actual Portuguese student population, thus quantifying the implication of the sampling bias. In section 5 we provide a decomposition of the evolution of the recalculated PISA scores. Finally, section 6 concludes.
2.
Data
We use different data sources, the PISA datasets available online for the 2006, 2009, and 2012 cycles and population data from the Portuguese Ministry of Education. Population data are available from two different databases: MISI, a very comprehensive administrative dataset comprising microdata since 2007, and Estatísticas da Educação, a less detailed dataset. MISI concerns only the public system on the Portuguese mainland, thus excluding students in the islands of the Azores and Madeira,3 and information about private schools. Therefore, for public schools PISA 2009 and 2012 were compared with MISI 2009 and 2012, while for 2006 the less detailed dataset was used. For private schools the entire analysis uses the less detailed dataset.
The target population of PISA studies is 15-year-old students enrolled in or above the 7th grade.4 We obtained from the population datasets information about students’ grades, tracks of study, and types of school (public vs. private). From PISA we extracted students’ scores.
3
Azores and Madeira account for 5.8% of the total 15-year-old Portuguese population in 2012. Excluding these students from the PISA sample never affects the final PISA scores by more than one point.
4
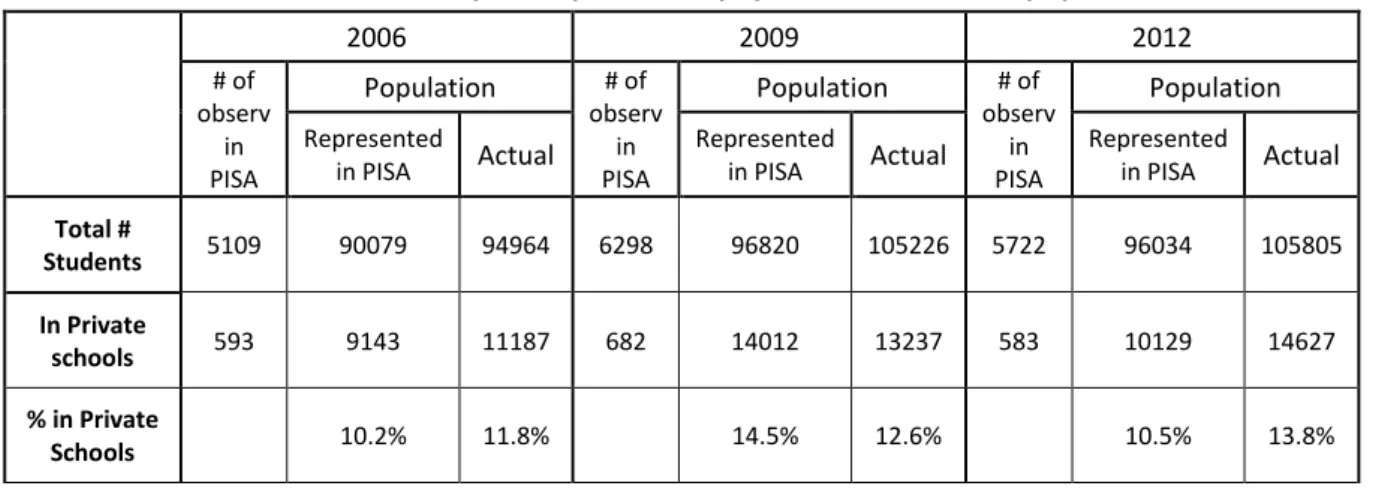
5 Table 2 summarizes the comparison between the populations represented by the PISA samples, taking into account the weight of each observation and the actual population.The weighted sample represents the student population enrolled in both the private and public system in the year of the test.5
Table 2: PISA samples, represented population and actual population
2006 2009 2012 # of observ in PISA Population # of observ in PISA Population # of observ in PISA Population Represented in PISA Actual Represented in PISA Actual Represented in PISA Actual Total # Students 5109 90079 94964 6298 96820 105226 5722 96034 105805 In Private schools 593 9143 11187 682 14012 13237 583 10129 14627 % in Private Schools 10.2% 11.8% 14.5% 12.6% 10.5% 13.8%
Table 3: PISA scores – Public Schools Grade and
track of studies
Average score PISA 2006 Average score PISA 2009 Average score PISA 2012
Reading Mathematics Reading Mathematics Reading Mathematics
7th grade 324.15 336.49 372.09 369.16 365.58 358.12 8th grade 389.45 386.52 407.14 397.03 406.57 395.37 9th grade 445.87 439.97 460.30 458.48 464.41 457.21 Lower Secondary Vocational 336.94 350.46 368.30 367.06 357.01 370.50 Upper Secondary Academic 539.58 521.12 539.32 536.04 541.05 480.47 Upper-Secondary Technological 501.38 501.41 475.53 514.55 521.02 529.33 Upper-Secondary Professional 410.27 423.32 466.93 479.61 479.37 483.28
It is clear that there are sizable differences between the population represented in PISA (weighted sample) and the Portuguese student population in the years under analysis. There are also some differences in
5All the analyses we performed with the PISA datasets used the weighted samples. The weights are available in the
6 terms of the distribution of students per private and public schools. Table 2 shows the number of observations in each PISA sample and the represented population per type of school.
Table 3 shows the scores attained in PISA, disaggregated by the grade and the track of studies the student is enrolled in for students in public schools. As can be seen, the lowest scores in the PISA tests are achieved by students in the lowest grades of the academic track or in Lower Secondary Vocational courses and the differences are large. 6 The strong dependence of the Portuguese students’ results on PISA on the grade students are enrolled in has already been shown by Pereira (2010, 2011) and Pereira and Reis (2012). Their findings corroborate O’Leary’s (2001) remarks. The table also shows a strong dependence on the track of studies, a fact that was found to have important implications in the case of Austria (Neuwirth, 2006). This justifies our focus on the variable “grade and track of studies” regarding the population representativeness of the sample.
3.
Representativeness of the PISA sample
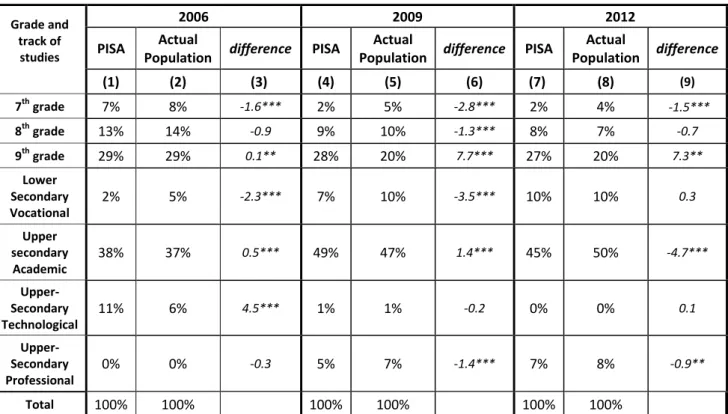
Focusing first on public school students on the Portuguese mainland, and following a student division according to the grade and track of studies in which they are enrolled, we can observe in columns 2, 5, and 8 in Table 4 important changes in the student population, particularly between 2006 and 2009. The percentage of students in the lower levels of education (7th, 8th, and 9th grades) decreased substantially. This may indicate that the number of repeaters in the system decreased in the years under analysis. We can also see the near disappearance of the Upper-Secondary Technological Courses and the increase of the Upper-Secondary Professional Courses and Lower-Secondary Vocational Courses.
Table 4 also compares the distribution of grade and track of studies according to PISA (columns 1, 4, and 7) and in the actual population (columns 2, 5, and 8). For 2006 we see some large deviations in the Upper-Secondary Technological courses, which are strongly overrepresented in the PISA dataset and in the Lower-Secondary Vocational courses, which are underrepresented. Regarding 2009, we find overrepresentation of the 9th grade and underrepresentation of the 7th grade and of the Lower-Secondary Vocational courses. In
6
7 2012 we again find overrepresentation of the 9th grade but now there is a strong underrepresentation of Upper-Secondary Academic courses. These differences are important, as we have seen that scores vary considerably according to the grade and track of studies the student is enrolled in.
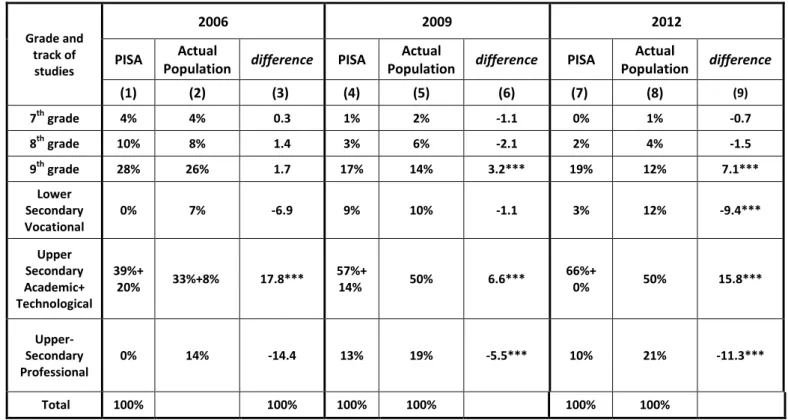
Next we perform the same analysis for private schools. Academic and Technological Upper-Secondary courses have been merged, as the available data do not allow distinguishing between these two categories. The results are shown in Table 5. The PISA 2006 sample did not include students enrolled in either the Upper-Secondary Professional courses or in Lower-Secondary Vocational courses in private schools. On the contrary, there is an overrepresentation of students enrolled in the Upper-Secondary Academic and Technological courses. In 2009 the 9th grade and Upper-Secondary Academic and Technological courses are overrepresented, while Upper-Secondary Professional courses are underrepresented. In 2012 PISA over represents 9th grade and Upper-Secondary Academic and Technological courses and underrepresents Upper-Secondary Professional courses and the Lower-Secondary Vocational courses.
Table 4: Distribution of students according to the grade and track of studies – Public Schools Grade and
track of studies
2006 2009 2012
PISA Actual
Population difference PISA
Actual
Population difference PISA
Actual Population difference (1) (2) (3) (4) (5) (6) (7) (8) (9) 7th grade 7% 8% -1.6*** 2% 5% -2.8*** 2% 4% -1.5*** 8th grade 13% 14% -0.9 9% 10% -1.3*** 8% 7% -0.7 9th grade 29% 29% 0.1** 28% 20% 7.7*** 27% 20% 7.3** Lower Secondary Vocational 2% 5% -2.3*** 7% 10% -3.5*** 10% 10% 0.3 Upper secondary Academic 38% 37% 0.5*** 49% 47% 1.4*** 45% 50% -4.7*** Upper-Secondary Technological 11% 6% 4.5*** 1% 1% -0.2 0% 0% 0.1 Upper-Secondary Professional 0% 0% -0.3 5% 7% -1.4*** 7% 8% -0.9** Total 100% 100% 100% 100% 100% 100%
*statistically significant at the 0.1 level; **statistically significant at the 0.05 level; ***statistically significant at the 0.01 level
8
Table 5: Distribution of Students according to the grade and track of studies - Private Schools Grade and
track of studies
2006 2009 2012
PISA Actual
Population difference PISA
Actual
Population difference PISA
Actual Population difference (1) (2) (3) (4) (5) (6) (7) (8) (9) 7th grade 4% 4% 0.3 1% 2% -1.1 0% 1% -0.7 8th grade 10% 8% 1.4 3% 6% -2.1 2% 4% -1.5 9th grade 28% 26% 1.7 17% 14% 3.2*** 19% 12% 7.1*** Lower Secondary Vocational 0% 7% -6.9 9% 10% -1.1 3% 12% -9.4*** Upper Secondary Academic+ Technological 39%+ 20% 33%+8% 17.8*** 57%+ 14% 50% 6.6*** 66%+ 0% 50% 15.8*** Upper-Secondary Professional 0% 14% -14.4 13% 19% -5.5*** 10% 21% -11.3*** Total 100% 100% 100% 100% 100% 100%
*statistically significant at the 0.1 level; **statistically significant at the 0.05 level; ***statistically significant at the 0.01 level
4. Recalculating PISA scores using actual population weights
Given the distortions detected, we next analyse the changes in average PISA scores that would result from the consideration of different population distributions. In particular, PISA scores were recalculated considering the average scores for each group of students shown in Table 3 and the actual distribution of students per grade and track of studies in the population shown in Table 4. We obtain lower scores for 2006 and 2009, while for 2012 the recalculated scores are slightly higher than the ones disclosed by PISA. The results from these recalculations are shown in Table 6.
Table 6: Adjusted and official PISA scores considering the grade and track of studies - Public Schools
2006 2009 2012 Reading Adjusted 461 479 484 Official 496 486 482 Mathematics Adjusted 454 477 483 Official 462 484 481
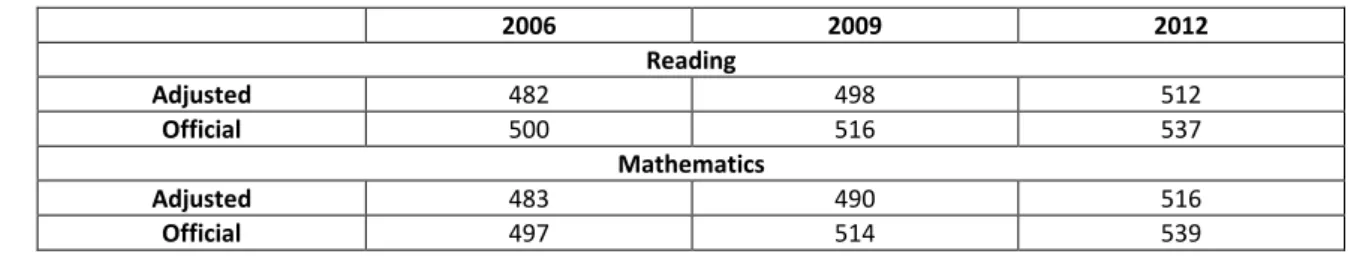
Next we recalculate PISA scores considering the student population distribution in private schools observed in population statistics. As mentioned above, for PISA 2006 there are no observations for Lower Secondary
9 Vocational courses and Upper Secondary Professional courses. The methodology used to overcome this problem is presented in the appendix. The results are shown in Table 7. It is shown that there is a significant upper bias in the scores for private schools in all three PISA tests since 2006.
Table 7: Adjusted and official PISA scores considering the grade and track of studies – Private Schools
2006 2009 2012 Reading Adjusted 482 498 512 Official 500 516 537 Mathematics Adjusted 483 490 516 Official 497 514 539
Finally, in Table 8 we show the recalculated average PISA scores for all schools considering the distribution of students in terms of grade and track of studies, and type of school.
Table 8: Adjusted PISA scores considering the grade and track of studies – All Schools
2006 2009 2012 Reading Adjusted 463.6 481.1 488.1 Official 472.3 489.3 487.8 Mathematics Adjusted 457.7 480.6 487.9 Official 466.2 486.9 487.1
The recalculated PISA scores in 2006 and 2009 are lower than the ones published by PISA, whereas in 2012 the figures are very similar. Regarding the evolution from 2006 to 2009, in Reading the score increase amounts to almost 18 points and in Mathematics the jump is around 23 points. This evolution is fairly close to the one that was reported by PISA. Between 2009 and 2012 the increase in both tests is greater than the one disclosed: the stagnation reported in this period is no longer observed.
460 470 480 490 500 2006 2009 2012
PISA Adjusted PISA
455 465 475 485 495 2006 2009 2012
PISA Adjusted PISA
10
5.
Decomposing the evolution
Next we use the recalculated scores to perform a decomposition of the evolution of the PISA scores from 2006 to 2009, and from 2009 to 2012. We assume that the evolution between any two years can be decomposed into two different components: (a) improvement in the scores of each type of student, where each type of student means students attending the same grade and track of studies and type of school; (b) change in the student population distribution according to these variables. Some studies have presented this type of exercise applying the Oaxaca-Blinder decomposition technique to PISA results. For instance, Barrera-Osorio et al. (2011) analysed the evolution of Indonesian results and Ramos, Duque, and Nieto (2012) studied the rural-urban differential in student achievement in Columbia. We use a similar although simpler approach to decompose the evolution of results. The following graphical representation illustrates our procedure.
In step 1 the PISA score for year x is reported considering the student distribution observed in the population for that same year. The same happens in step 3, for year y. Between these two years, in step 2, an intermediate computation is performed, recalculating the PISA scores at year y, but assuming the student distribution in terms of grade and track of studies observed in the previous year (x). Thus, from step 1 to step 2 we account for the effect of the improvement in the scores of each type of student, while from step 2 to step 3 the effect of the changes in the structure of the population in terms of grade and track of studies is isolated. The recalculated scores can be seen in the tables below.
(PISA Score year x| Population distribution year x)
(1)
(PISA Score year y| Population distribution year x)
(2)
(PISA Score year y| Population distribution year y)
11
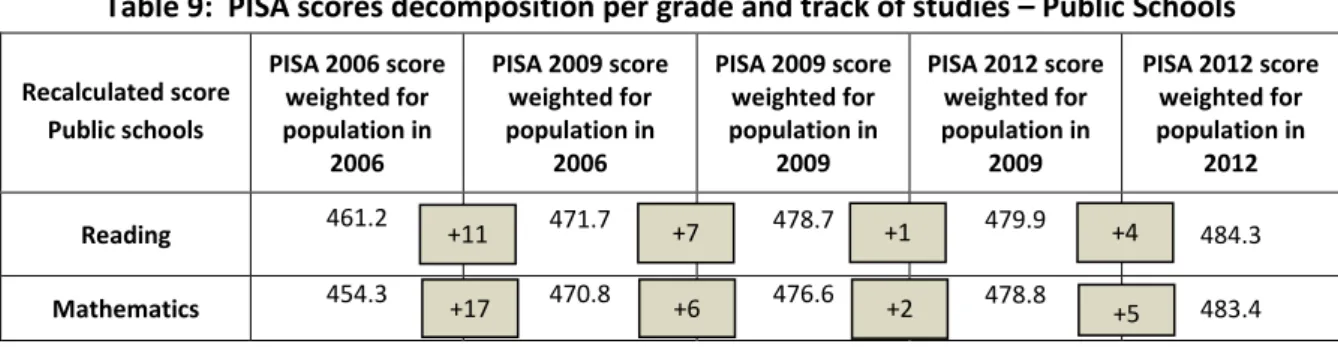
Table 9: PISA scores decomposition per grade and track of studies – Public Schools Recalculated score Public schools PISA 2006 score weighted for population in 2006 PISA 2009 score weighted for population in 2006 PISA 2009 score weighted for population in 2009 PISA 2012 score weighted for population in 2009 PISA 2012 score weighted for population in 2012 Reading 461.2 471.7 478.7 479.9 484.3 Mathematics 454.3 470.8 476.6 478.8 483.4
This decomposition presented in Table 9 for public schools shows that in Reading, from 2006 to 2009, around 7 of the 18 points of the progression are due to a population effect. From 2009 to 2012, the majority of the evolution, 4 points, is due to the population effect. In Mathematics, 6 of the 23 points can be imputed to the evolution of the population structure in terms of grade and track of studies from 2006 to 2009. From 2009 to 2012 the population effect has an impact of around 5 points.
The results of the same decomposition applied to private schools are depicted in Table 10.
Table 10: PISA scores decomposition per grade and track of studies – Private Schools Recalculated score Private schools PISA 2006 score weighted for population in 2006 PISA 2009 score weighted for population in 2006 PISA 2009 score weighted for population in 2009 PISA 2012 score weighted for population in 2009 PISA 2012 score weighted for population in 2012 Reading 481.7 491.9 497.6 513.9 512.3 Mathematics 483.4 485.0 490.2 517.2 516.5
In the Reading test, around 6 out of the 16 points overall increase registered between 2006 and 2009 are due to the change in the population distribution, while in Mathematics this same factor explains 5 out of the 7 points. From 2009 to 2012 all of the evolution is explained by the improvement in students’ scores. The population effect even has a negative effect on the scores between the two most recent PISA tests. This result is due to the increase in the percentage of students enrolled in private schools in the lower secondary vocational track, the worst performing group, as shown in Table 5.
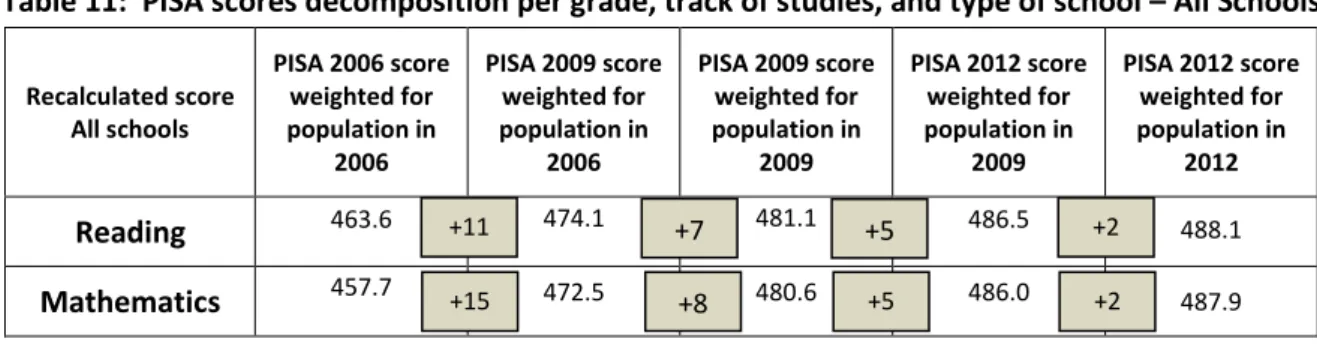
Finally, we present in Table 11 the decomposition of the evolution of scores applied to all schools, taking into account the grade, track of studies, and the type of school; the results show that for the whole period
+10 +2 +6 +5 +16 +27 -2 -1 +11 +17 +7 +6 +1 +2 +4 +5
12 the evolution of the student’s scores is the main driver of the increase in PISA results, with the change in the population structure playing a weaker role.
Table 11: PISA scores decomposition per grade, track of studies, and type of school – All Schools Recalculated score All schools PISA 2006 score weighted for population in 2006 PISA 2009 score weighted for population in 2006 PISA 2009 score weighted for population in 2009 PISA 2012 score weighted for population in 2009 PISA 2012 score weighted for population in 2012 Reading 463.6 474.1 481.1 486.5 488.1 Mathematics 457.7 472.5 480.6 486.0 487.9
6. Conclusion
This work tests the representativeness of the PISA samples for Portugal since 2006, and infers what would have been the scores and performance evolution if the PISA sample correctly reflected the Portuguese student population.
We introduce segmentation according to grade and track of studies, since this criterion has been shown to capture both the variability in PISA scores and the population representativeness problems of the PISA samples. For the three exam years under analysis a sizable bias between the effective student distribution and PISA samples was found.
We provide recalculated PISA scores that correct for the sample bias. For public schools in 2006 and 2009 the recalculated score is lower than the one officially reported by PISA. For 2012 the recalculated score is in line with the one that was published. The evolution between 2006 and 2009 is similar to the one officially observed. However, contrary to the stagnation indicated in the PISA results, from 2009 to 2012 the recalculated scores show an improvement in the Portuguese student performance. We also performed a score decomposition to determine which part of the evolution is due to the change in the student population structure and which part is related to better student performance. The results show that for the whole period the evolution of the student’s scores is the main driver of the increase in PISA results, with the change in the population structure playing a weaker role.
+11 +15 +7 +8 +5 +5 +2 +2
13 Because the PISA samples deviate in various ways from the 15-year-old Portuguese population it intends to portray, our solution consisted in recalculating the PISA scores using adjusted sample weights. An alternative solution that could be implemented in future PISA waves would be a change in the stratification variables chosen, to take into account the grade and track of studies the students are enrolled in. Both solutions could increase the representativeness of the PISA sample and thereby the political relevance of its conclusions. Although we have focused on only the Portuguese case, similar problems of representativeness are expected to arise in other countries with high retention rate, affecting the grade of study of 15-year-olds.
14
References
Barrera-Osorio, F., Garcia-Moreno, V., Anthony Patrinos, H. , Porta, E., 2011, Using the Oaxaca-Blinder Decomposition Technique to Analyze Learning Outcomes Changes over Time, Policy Research Working Paper N.5584, World Bank; http://dx.doi.org/10.1596/1813-9450-5584
Benito, Ricard, Alegre, Miquel Àngel, and Gonzàlez-Balletbò, Isaac, 2014, School Segregation and Its Effects on Educational Equality and Efficiency in 16 OECD Comprehensive School Systems, Comparative Education
Review, Vol. 58, No. 1), pp. 104-134
Hanushek, E., Woessman, L., 2011, The Economics of International Differences in Educational Achievement in Handbook of the Economics of Education, Vol. 3, North Holland, 2011
O’Leary, M., 2001, The Effects of Age-based and Grade-based Sampling on the Relative Standing of Countries in International Comparative Studies of Student Achievement, British Educational Research
Journal, Vol. 27, No.2, pages 187-200
Neuwirth, E. 2006, PISA 2000: Sample Weight Problems in Austria, OECD Education Working Papers, No. 5, OECD
OECD, The PISA International Database, http://www.oecd.org/pisa/
Pereira, Coutinho M., 2011, An analysis of the Portuguese Students' Performance in the OECD Programme for International Student Assessment (PISA), Economic Bulletin, Banco de Portugal
Pereira, Coutinho M., 2010, Educational Attainment and Equality of opportunity cost in Portugal and Europe: The role of school versus parental influence, Economic Bulletin, Banco de Portugal
Pereira, Coutinho M., Reis, H., 2012, What accounts for Portuguese regional differences in students’ performance? Evidence from OECD PISA, Economic Bulletin, Banco de Portugal
Ramos, R., Duque, J. Carlos, Nieto, S., 2012, Decomposing the Rural-Urban Differential in Student Achievement in Colombia using PISA Microdata, IZA Discussion paper series
15
Appendix
Since for PISA 2006 there are no observations relative to Lower Secondary Vocational courses and Upper Secondary Professional courses, it was necessary to define a method to assign a score to these students.
It was assumed that the proportional relationships between the scores of Upper Secondary Professional courses and the 9th grade and between the scores of Lower Secondary Vocational courses and 7th grade observed in public schools in 2006 were also verified in 2006.
(Upper Secondary Professional courses |public 2006) (9th grade |public 2006) =
(Upper Secondary Professional courses |private 2006) (9th grade |private 2006)
(Lower Secondary Vocational|public 2006) (7th grade |public 2006) =
(Lower Secondary Vocational|private 2006) (7th grade |private 2006)
Nova School of Business and Economics
Faculdade de Economia Universidade Nova de Lisboa Campus de Campolide 1099-032 Lisboa PORTUGAL Tel.: +351 213 801 600