ABSTRACT
Purpose: To correlate the morphological characteristics of diabetic retinal microaneurysms on
spectral domain optical coherence tomography (SD-OCT) with their functional leakage status on fluorescein angiography (FA) in a simultaneous assessment.
Methods: In this retrospective observational study, 88 retinal microaneurysms in 11 eyes of 6
type 2 diabetic adult patients with diabetic retinopathy (DR) (8 moderate non proliferative DR and 3 proliferative DR) were analyzed with simultaneous FA and SD-OCT imaging. Their morphological characteristics in SD-OCT, including shape, presence of a capsule-like structure, diameter, lumen reflectivity and the presence of nearby cysts were correlated with the leaking pattern (classified as absent, mild or intense).
Results: The majority of the microaneurysms were oval in shape (86,4%), with no “capsule”
(84.1%), with a heterogeneous lumen reflectivity (85.2%) and no associated cysts (65.9%). Their location in relation to the internal and external retinal boundaries (p=0.011) as well as nearby cysts (p<0.001) were correlated with angiographic leakage. No significant association was found between size, presence of a “capsule” and internal reflectivity on SD-OCT with the FA leakage status. Microaneurysms associated with cysts had larger vertical (p=0.001) and horizontal diameters (p<0.001).
Conclusions: A significant correlation was found between the presence of cystoid spaces in
SD-OCT and detectable leakage on FA. In addition, cysts were found to be more frequent in the presence of larger microaneurysms, which may add some useful information regarding the pathophysiology of diabetic macular edema. The identification of high risk microaneurysms on SD OCT may help to establish a customized and more cost-effective strategy for follow-up and
treatment in diabetic patients, without the need for invasive contrast imaging or OCT-angiography.
Keywords: Microaneurysms, Diabetic Retinopathy, Cystoid Spaces, Macular Edema, Optical
RESUMO
Objetivos: Correlacionar as características morfológicas de microaneurismas diabéticos
retinianos em estudo de imagem não-invasivo com tomografia de coerência óptica – spectral domain (SD-OCT) com a presença de difusão na angiografia fluoresceínica (FA).
Métodos: Neste estudo retrospetivo e observacional, 88 microaneurismas retinianos em 11
olhos de 6 pacientes com diabetes tipo 2 e retinopatia diabética (RD) (8 com RD moderada e 3 com RD proliferativa) foram analisados com FA e SD-OCT. As características morfológicas dos microaneurismas no SD-OCT, incluindo tamanho, forma, presença de contorno hipereflectivo simulando uma “cápsula”, refletividade do lúmen e presença de cistos adjacentes foram correlacionados com o padrão de difusão na FA (classificada como ausente, ligeira ou marcada).
Resultados: A maioria dos microaneurismas estudados apresentava uma forma oval (86,4%),
sem “cápsula” (84,1%), com lúmen de refletividade heterogénea (85.2%) e sem cistos associados (65,9%). Foi encontrada uma associação entre a localização dos microaneurismas, relativamente ao limite interno e externo da retina (p=0.011), bem como a presença de cistos (p<0.001) e a presença de difusão na FA. No entanto, não se registou uma associação estatisticamente significativa entre o tamanho, a presença de “cápsula”, a refletividade interna dos microaneurismas e a presença de difusão na FA. Os microaneurismas com cistos associados apresentavam maior diâmetro vertical (p=0.001) e horizontal (p<0.001).
Conclusões: Foi encontrada uma correlação estatisticamente significativa entre a presença de
espaços cistóides no SD-OCT e difusão na FA. Além disso, os cistos apresentaram-se mais frequentemente associados a microaneurismas de maior diâmetro, informação esta importante relativamente à fisiopatologia do edema macular secundário à diabetes. A identificação de microaneurismas de alto risco no SD-OCT poderá permitir de modo não-invasivo um seguimento e tratamento personalizado de doentes diabéticos, sem recurso a procedimentos invasivos como a angiografia ou mais dispendiosos como o OCT-angiografia.
Palavras-chave: Microaneurismas, Espaços Cistóides, Retinopatia Diabética; Edema Macular;
Tomografia de Coerência Óptica, SD-OCT; Angiografia Fluoresceínica, Difusão Angiográfica.
INTRODUCTION
Diabetic retinopathy (DR) is the first cause of vision loss in the working-age population14 and it results both from microvascular dysfunction and retinal neurodegeneration.16, 21
The clinical diagnosis relies on the presence of microaneurysms - focal dilations of the retinal capillaries- - identifiable in the fundus as dark red or white spots that are often located in the central retina.8 They can be
saccular or fusiform, mainly originating from retinal venous capillaries and are predominantly localized in the inner nuclear layer (INL).22,28 The histopathological features of these lesions include thickening of basement membrane, pericyte loss and endothelial hyperplasia or acellularity.1, 6, 12, 17
Microaneurysms increase the risk of disease progression and are associated with loss of the endothelial barrier function, vascular hyperpermeability and edema which can be recognized, to some degree, as leakage in
fluorescein angiography (FA).22,31 The definite cellular and biochemical changes that determine the breakdown of the blood-retinal barrier (BRB) in DR remain to be elucidated, however oxidative stress, cytokines, accumulation of intracellular sorbitol and advanced glycosylation end products are thought to be implicated.30,39
FA is a precious tool for detection of microaneurysms and for guiding laser treatment as it allows the detection of their perfusion and leakage status.4 However, not all microaneurysms show hyperfluorescence and FA cannot evaluate all their characteristics. Also, adverse reactions follow about 5% of angiographic procedures and can be potentially life-threatening,2 and this percentage rises to 48.6% for those who had a previous adverse event.23
In contrast, spectral domain optical coherence tomography (SD-OCT) is non-invasive, fast, safe and reliable imaging test that can provide valuable information of the retina with an axial resolution of less than 5 um.29 With the scanning laser ophthalmoscopy (SLO) technology it is possible to simultaneously co-localize SD-OCT scans with the angiographic images and this has been used by previous studies18,20,38 to evaluate morphologic features of microaneurysms and their leakage status. In fact, Ito et al.20 Were able to correlate the lack of a “capsular” structure, nearby cystoid spaces and hyperreflective spots in the lumen with fluorescein leakage. However, most of these findings have not been confirmed to date by other studies.
Optical coherence tomography angiography (OCTA) is a recent tool that allows noninvasive visualization of retinal and choroidal vasculature via motion contrast imaging.11 Despite ongoing improvements in this technology, OCTA is prone to artifacts that can arise during the acquisition or post-acquisition of images, including projection artifacts that can give false ideas about vessels location and density.35 In fact, this method was found to be inconsistent in detecting microaneurysms in FA images,9 with a sensibility being as low as 41.0% in one study.26 Blood flow inside some microaneurysms is turbulent and therefore may not be visualized with OCTA that mainly depends on the fast movement of blood cells19,26 and cannot detect retinal capillary flow of less than 0.3 mm per second using the frequently applied SSADA algorithm.37 In addition, OCT-angiograms may be more reliable in detecting microvascular changes other than microaneurysms, such as flow-void areas and perifoveal arcade disruptions.25 Overall, current OCTA
technology is still inferior to conventional SD-OCT imaging in identifying retinal diabetic microaneurysms.32 Furthermore this technology is still expensive and, at least for now, is not as available as an SD-OCT in clinical practice.
Our main goal in this study was to correlate the morphologic features of microaneurysms, using SD-OCT, with their focal fluorescein leakage in order to validate previous findings and ascertain the utility of this method in the follow-up and treatment of diabetic patients, in particular those not eligible for FA.
PATIENTS AND METHODS
Patients
Eleven eyes of 6 consecutive patients (range 72 – 79 years), 4 male and 2 female, with type 2 diabetes and DR, performing simultaneous fluorescein angiography and SD-OCT in the Medical Retinal Department of our hospital were included in this retrospective observational study. The study had the approval of the Health Ethics’ Commission of our institution, and all research adhered to the directives of the Declaration of Helsinki.
We included eyes with microaneurysms that had ocular media transparency and good quality FA and OCT images. Patients with exuberant macular edema, lipid exudation or hemorrhages were excluded because it is difficult to clearly identify microaneurysms in those cases. Also, patients presenting with other retinal diseases potentially causing macular edema were excluded as well.
Eight eyes had moderate non-proliferative DR and 3 eyes had proliferative DR (according to the Early Treatment of Diabetic Retinopathy Study (ETDRS)). One eye was excluded due to exuberant macular edema. Only 2 eyes, from the same patient, were treatment-naive. Nine eyes had been submitted to laser therapy and 3 of those also had anti-VEGF intravitreal injections. The minimum lapse of time mediating laser therapy and image acquisition was 17 days. The minimum interval between previous anti-VEGF injection and microaneurysm imaging was 56 days.
Image Acquisition
Data from simultaneous FA and SD-OCT imaging device using SLO technology was registered (Heidelberg Retinal Angiography HRA2, Heidelberg Engineering, Inc., Heidelberg, Germany). A high-resolution 30º FA assessment was made on early and corresponding late- -phase imaging (using the follow-up mode) with simultaneous high-speed SD-OCT macular cube with 20ºx20º using a dense raster protocol.
Microaneurysm Characterization
Microaneurysms were identified in FA and OCT-SD images by an experienced retinal specialist. This identification was performed in an early phase of the angiogram and the corresponding lesion was looked-up in the OCT scan crossing that same lesion. Only unequivocal images in both FA and OCT-SD were used, so other type of lesions that appear as hyperfluorescent dots could be excluded. In addition, special care was taken to avoid mistaking microaneurysms for vessel’s cross-section. Clusters of microaneurysms were excluded if their individual leakage status was uncertain.
The angiographic leakage was classified as absent (0), mild (1) and intense (2), depending on the rate of spread of surrounding hyperfluorescence from early to late-phase FA images.
A description of the morphologic OCT characteristics was made considering size and shape, the presence of a capsule-like structure (defined as an hyperreflective ring circumscribing the microaneurysm) and its thickness, internal reflectivity, intraretinal location, distance from fovea and nearby cysts. A 1: 1 vertical: horizontal aspect ratio was used to evaluate the images.
The maximal microaneurysm’s dimensions were measured on the scanning plane bisecting the presumable center of the lesion (either horizontally or vertically) and included vertical horizontal, external and internal diameters.
We further classified the microaneurysms regarding the presence or absence of a capsule-like structure, either complete or incomplete. When the “capsule” was complete, vertical and horizontal capsular thickness was calculated by dividing the difference between external and internal diameters by two.
We assessed the intraretinal location of the microaneurysms by measuring the distance from their superior and inferior poles to the innermost and outermost retinal surface, respectively. Also, the distance between the center of the microaneurysms and the center of the fovea was measured in the FA image.
Internal reflectivity of microaneurysms was categorized by their lumen appearance, as homogeneous or heterogeneous. The microaneurysms’ surrounding area was inspected for the presence of cysts.
Statistical Analysis
Continuous variables are expressed as the median, minimums (min) and maximums (max) values. Significant differences were determined using the Spearman for correlation (r) between continuous variables, and the Mann-Whitney or the Kruskall-Wallis for the nominal variables. The correlation between nominal variables was evaluated by the qui-square and a significance level of 0.05 was considered. All statistical analyses were performed using the SPSS software version 13.0 (SPSS, Chicago, Ill., USA). For the main findings, 95% confident intervals (95%CI) are presented.
RESULTS
Angiographic assessment
A total of 88 microaneurysms were evaluated. Non- -leaking microaneurysms (n=45; 51.1%) outnumbered
equally both mild (n=23; 26.1%) and severe (n=20; 22.7%) leaking ones.
Microaneurysms structure
All microaneurysms had a well-defined oval (86.4%) or round (13.6%) shape in SD-OCT imaging. The median vertical and horizontal maximal external diameters were 75.5 µm (min 34.0 µm; max 160.0 µm) and 97.0 µm (min 53.0 µm; max 238.0 µm). No differences in vertical (p = 0.547) and horizontal (p = 0.976) diameters were observed among aneurysms with no, mild, or severe leakage on FA.
Microaneurysms capsule-like structure
Regarding the external “capsular” appearance - an hyperreflective ring circumscribing the aneurysm on the sectional OCT images – 74 (86.4%) of microaneurysms did not present a surrounding “capsule” (figure 1), 9 (10.2%) presented an incomplete form (figure 2) and 5 (5.7%) displayed a complete one (figure 3). The calculated median horizontal and vertical capsular thickness were respectively 20.5 µm (range 15.0-37.5 µm) and 19.0 µm (range 0-39.0 µm) and an association between increasing “capsular” thickness and external diameter was found, that is, microaneurysms with a complete “capsule” had a statistically higher horizontal (p=0.001) and vertical (p=0.004) external diameter than those with incomplete or absent “capsule”.Leakage did not correlate with either the evidence of a surrounding “capsule” (p=0.421) or its thickness (horizontal, p=0.460, vertical, p=0.557).
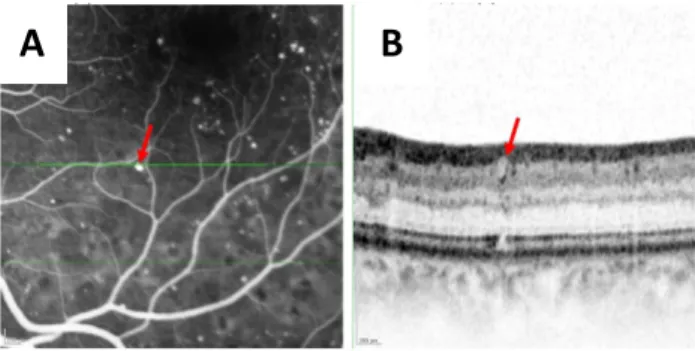
Figure 1 - A microaneurysm with no capsular structure. B. Magnified SD-OCT image corresponding to the green line in early phase FA image (A), showing the microaneurysm (red arrow) with oval shape, no capsular structure and homogeneous lumen internal reflectivity
Figure 2 - A microaneurysm with an incomplete capsular structure. B. Magnified SD-OCT image corresponding to the green line in early phase FA image (A), showing the microaneurysm (red arrow) with oval shape, incomplete capsular structure and homogeneous lumen internal reflectivity.
Figure 3 - A microaneurysm with a complete capsular structure. B. Magnified SD-OCT image corresponding to the green line in early phase FA image (A), showing the microaneurysm (red arrow) with oval shape, complete capsular structure and heterogenous lumen internal reflectivity.
Microaneurysms distribution
The median distance from microaneurysms to the inner retinal surface was 94.5 µm (min 13.0 µm; max 188.0 µm) and to the outer retina surface was 112.5 µm (min 39.0 µm; max 431.0 µm), suggesting they are preferentially located in the inner retinal layers.
The median distance from the center of the fovea was 1684.0 µm (min 406.0 µm, max 3903.0 µm). This distance had significant correlation to the angiographic leakage (p=0.011), as more centrally located lesions presented
more leakage (medians: no leakage=2217.5 µm, 95%CI=1852.1-2390.6; mild=1214.0 µm,
95%CI= 1266.2-1994.9; severe leakage=1199.0 µm, 95%CI=1149.7-1849.2)
Lumen internal reflectivity
An homogenous lumen (figure 3) was observed in 13 (14.8%) of the microaneurysms, while a heterogeneous lumen appearance (figures 1 and 2) was detected in 75 (85.2%). In this study, there was no significant correlation between reflectivity and angiographic leakage (p=0.339).
Heterogenous or homogeneous internal reflectivity was similar among microaneurysms with no, mild, or severe leakage on FA (p = 0.186).
Cysts
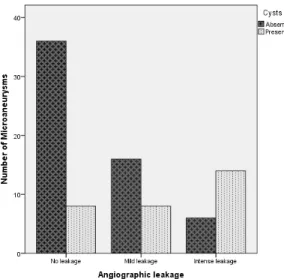
Nearby cysts were found in 30 microaneurysms (34.1%) and absent in 58 (65.9%) (Figure 4). A significant correlation was found between the presence of cysts and angiographic leakage (p<0.001) (figure 5).
A
B
A
B
Also, microaneurysms with nearby cysts had greater inferior (p=0.017) and external (p=0.002) retinal distances which is consistent with peri-aneurysm edema and increased retinal thickness surrounding leaking aneurysms.
Microaneurysms associated with cysts were significantly larger than their counterparts: median vertical external diameter (mean 94.5 µm vs 70.0 µm, p=0.001), median horizontal external diameter (mean 116.0 µm vs 86.5 µm, p<0.001).
Figure 4 - Microaneurysms (red and yellow arrows) with nearby cysts (asterisks) in magnified SD-OCT image (B) corresponding to the green line in early phase FA image (A). C. Late phase image demonstrating leakage, classified as severe.
DISCUSSION
In the present work, we studied some tomographic characteristics of diabetic microaneurysms and correlated them with fluorescein leakage as the factors determining their hyperpermeability have not been clearly defined so far.
Microaneurysms were classified according to the presence of a capsular-like structure on OCT images. Based on descriptions of histopathologic reports, previous works18,20 hypothesized that this structure may correspond to altered characteristics of the basement membrane – thickened and hyalinized, fibrous or lipid-containing - or to a multilayered endothelial layer. Another previous report considered they could represent lipid depositions either within or outside the vessel wall.5 In this study, we found that the bigger the microaneurysm the thicker its
“capsule” so it is probable that lumen dilatation is accompanied by some of the capillary wall changes cited above. Shear force, for example, promote aneurysms evolution by inducing differentiation and proliferation of endothelial cells.13 Conversely, bigger microaneurysms have a more discernible “capsule” on SD-OCT5 which is not easily identified in smaller lesions.
As expected, microaneurysms' size was not associated with leakage. Ezra et al.13 Suggested that the relationship between the MA radius and associated vessel wall could better predict the risk of leakage, however this was not evaluated in the present study.
Some studies found an association between the presence of a complete capsule-like structure and lack of hyperpermeability.18,20 This was explained either by a tendency of a thickened/hyalinized microaneurysm for obstruction, or the presence of endothelial cells with high barrier characteristics. In the present study, there was no significant correlation between the capsular integrity or capsular thickness and the angiographic leakage. This discrepancy could be explained by the design we choose for our study, as non-perfused microaneurysms in FA were not included. In addition, SD-OCT resolution, the differences between axial / transversal definition and scattering phenomena frequently compromise the observation and accurate measurement of the capsule-like structure.5 Future improvements in OCT resolution may provide unequivocal and more precise characterization of this structure and consequently valuable information for managing DR.
We also did not find a significant correlation between internal reflectivity and angiographic leakage. Presumably, hyperreflective spots inside the microaneurysm lumen could represent cell types such as erythrocytes or leukocytes36 that proved to contribute to the disruption of the blood retinal barrier by several mechanisms.15,27 Previous studies using simultaneous SD-OCT and FA have studied this association with contradicting results. Wang et al.38 Did not find a significant difference between lumen heterogeneity or homogeneity in microaneurysms with their leakage degree, while Ito et al.20 Did find an association between hyperreflective spots and focal fluorescein leakage. Interestingly, the sensitivity of the OCTA in detecting microaneurysms appearing hyporeflective on SD-OCT has recently been reported to be lower than in those with a hyperreflective lumen.32 This has been attributed either to a low retinal blood flow33 on
hyporeflective microaneurysms or to an intraluminal content deprived of erythrocytes9 and hence, not detected by OCTA. The true meaning of intraluminal reflectance of microaneurysms awaits further clarification, however it does not seem to effectively predict microaneurysms hyperpermeability.
The presence of nearby cysts was associated with leakage and presumable retinal thickening. Taking into account other reported results,11,30,33 peri-aneurysmal cysts appear to be the most reliable sign of leakage on SD-OCT and can be used to assess patients with a contraindication to FA. However, not all leaking microaneurysms demonstrated this feature (figure 5). One of the possible reasons may be an insufficient accumulation of fluid to form cysts detectable by conventional SD-OCT studies.3 This limitation may be overcome in the future by applying strategies of automated analysis of the retinal extracellular fluid. Cunha-Vaz et al.10 have recently described a method of detecting leakage by OCT, through the detection of a relative reduction in the optical reflectivity of the retinal layers, naming it OCT-leakage. This could allow the automatic identification and tracking of both clinical and sub-clinical diabetic macular edema.34
Figure 5 - Angiographic leakage profile of microaneurysms with and without nearby cysts.
Recently, Spaide defined retinal edema as the difference between the production and removal of fluid, with cystoid spaces representing areas of regional excess of fluid accumulation that are dependent on the surrounding tissue compliance.34
As it was mentioned, microaneurysms hyperpermeability is not associated with their size, however larger leaking microaneurysms had a greater chance of presenting with cysts. We can therefore conclude that, if microaneurysms' size does not contribute to fluid overproduction (as evaluated by FA), other mechanical mechanisms might be involved. Larger aneurysms can facilitate the formation of cysts by: 1) disturbing retinal tissue architecture/compliance and/or 2) by interfering with mechanisms of fluid clearance. First of all, microaneurysms of larger diameters may disrupt the integrity of natural barriers against fluid movement - such as the synaptic portion of outer plexiform layer (OPL)7 and cause fluid accumulation. Secondly, they can potentially affect the functioning of nearby glial cells, particularly Muller cells, which are believed to play a central role in the interstitial flow of fluid by a K+ dependent mechanism.34 Finally, microaneurysms represent regions of anormal/turbulent flow19 and larger microaneurysms may diminish flow substantially within the deep retinal plexus, restricting normal fluid transportation and leading to cystoid edema.34 However, despite the putative role of microaneurysms size in the formation of cysts, it is possible that cysts themselves may contribute to the microaneurysms expansion due to the presence of weak points in their vessel wall.18 It should be interesting to further address these hypothesis in future clinical / histopathological studies.
We acknowledge some limitations of this study. First, it was of retrospective and cross-sectional nature and consisted of a small sample of patients with different severity and duration of disease. Also, all findings were evaluated by a single masked retinal specialist and we studied microaneurysms that were visible on FA, so non-perfused lesions were not included. Laser-photocoagulated microaneurysms become less prominent on SD-OCT from one month to two months,40 consequently, the inclusion of recently laser-treated eyes (min 17 days) might have influenced the leakage in some of the identified lesions. Eyes treated with anti-VEGF had a longer interval to examination (min 56 days), minimizing its influence on their leaking properties, however this treatment could have potentially influenced the microaneurysms' angiographic behavior.24 We also recognize some limitations related to the SD-OCT evaluation of lesions. First, it was not possible to assure that the single OCT sectional image passed through the center of the microaneurysms, so the
measurements may not correspond to their exact dimensions. Despite the use of a dense raster protocol, the reliable identification of the lesions, especially those in proximity with vessels or hemorrhages, was sometimes impossible. Moreover, the discrimination of microaneurysms lumens and “capsules” was challenging at times, particularly when their diameter was rather small.
CONCLUSION
We conclude that the identification of cysts surrounding microaneurysms is the most accurate and reproducible sign of leakage in SD-OCT. Evaluating the leakage status of individual microaneurysms is crucial to identify lesions representing a risk to the retinal integrity, in order to establish a customized follow-up assessment plan or to establish a more cost-effective therapeutic approach. In spite of the current and growing interest in the OCTA technology, it seems that SD-OCT is still the most sensitive non-invasive method of assessing microaneurysms, especially in patients with a contrast dye contraindication. In the future, the use of an OCT automated analysis of retinal extracellular fluid detection may play an important role in the detection of sub-clinical diabetic macular edema.
BIBLIOGRAPHY
1. Ashton N. STUDIES OF THE RETINAL
CAPILLARIES IN RELATION TO DIABETIC AND OTHER RETINOPATHIES. Br J Ophthalmol. 1963;47:521-38.
2. Bearelly S, Rao S, Fekrat S. Anaphylaxis following intravenous fluorescein angiography in a vitreoretinal clinic: report of 4 cases. Canadian Journal of Ophthalmology.44(4):444-5.
3. Blair NP, Shahidi M, Lai WW, Zelkha R. Correlation Between Microaneurysms and Retinal Thickness in Diabetic Macular Edema. Retina (Philadelphia, Pa). 2008;28(8):1097-103.
4. Bolz M, Ritter M, Schneider M, Simader C, Scholda C, Schmidt-Erfurth U. A systematic correlation of angiography and high-resolution optical coherence tomography in diabetic macular edema. Ophthalmology. 2009;116(1):66-72.
5. Bolz M, Schmidt-Erfurth U, Deak G, Mylonas G, Kriechbaum K, Scholda C. Optical coherence tomographic hyperreflective foci: a morphologic sign of lipid extravasation in diabetic macular edema. Ophthalmology. 2009;116(5):914-20.
6. Bresnick GH, Davis MD, Myers FL, de Venecia G. Clinicopathologic correlations in diabetic retinopathy. II. Clinical and histologic appearances of retinal capillary microaneurysms. Archives of ophthalmology (Chicago, Ill : 1960). 1977;95(7):1215-20.
7. Byeon SH, Chu YK, Hong YT, Kim M, Kang HM, Kwon OW. New insights into the pathoanatomy of diabetic macular edema: angiographic patterns and optical coherence tomography. Retina (Philadelphia, Pa). 2012;32(6):1087-99.
8. Chen SJ, Chou P, Lee AF, Lee FL, Hsu WM, Liu JH, et al. Microaneurysm number and distribution in the macula of Chinese type 2 diabetics with early diabetic retinopathy: a population-based study in Kinmen, Taiwan. Acta Diabetol. 2010;47(1):35-41.
9. Couturier A, Mane V, Bonnin S, Erginay A, Massin P, Gaudric A, et al. CAPILLARY PLEXUS ANOMALIES IN DIABETIC RETINOPATHY ON OPTICAL COHERENCE TOMOGRAPHY ANGIOGRAPHY. Retina (Philadelphia, Pa). 2015;35(11):2384-91.
10. Cunha-Vaz J, Santos T, Ribeiro L, Alves D, Marques I, Goldberg M. OCT-Leakage: A New Method to Identify and Locate Abnormal Fluid Accumulation in Diabetic Retinal Edema. Investigative ophthalmology & visual science. 2016;57(15):6776-83.
11. de Carlo TE, Bonini Filho MA, Chin AT, Adhi M, Ferrara D, Baumal CR, et al. Spectral-domain optical coherence tomography angiography of choroidal neovascularization. Ophthalmology. 2015;122(6):1228-38.
12. De Venecia G, Davis M, Engerman R. Clinicopathologic correlations in diabetic retinopathy. I. Histology and fluorescein angiography of microaneurysms. Archives of ophthalmology (Chicago, Ill : 1960). 1976;94(10):1766-73.
13. Ezra E, Keinan E, Mandel Y, Boulton ME, Nahmias Y. Non-dimensional analysis of retinal microaneurysms: critical threshold for treatment. Integr Biol (Camb). 2013;5(3):474-80.
14. Fong DS, Aiello LP, Ferris FL, 3rd, Klein R. Diabetic retinopathy. Diabetes Care. 2004;27(10):2540-53.
15. Gao BB, Clermont A, Rook S, Fonda SJ, Srinivasan VJ, Wojtkowski M, et al. Extracellular carbonic anhydrase mediates hemorrhagic retinal and cerebral vascular permeability through prekallikrein activation. Nat Med. 2007;13(2):181-8.
16. Gardner TW, Antonetti DA, Barber AJ, LaNoue KF, Levison SW. Diabetic retinopathy: more than meets the eye. Survey of ophthalmology. 2002;47 Suppl 2:S253-62.
17. Garner A. Histopathology of diabetic retinopathy in man. Eye (London, England). 1993;7 ( Pt 2):250-3.
18. Horii T, Murakami T, Nishijima K, Sakamoto A, Ota M, Yoshimura N. Optical coherence tomographic characteristics of microaneurysms in diabetic retinopathy. American journal of ophthalmology. 2010;150(6):840-8.
19. Ishibazawa A, Nagaoka T, Takahashi A, Omae T, Tani T, Sogawa K, et al. Optical Coherence Tomography Angiography in Diabetic Retinopathy: A Prospective Pilot Study. American journal of ophthalmology. 2015;160(1):35-44.e1.
20. Ito H, Horii T, Nishijima K, Sakamoto A, Ota M, Murakami T, et al. Association between fluorescein leakage and optical coherence tomographic characteristics of microaneurysms in diabetic retinopathy. Retina (Philadelphia, Pa). 2013;33(4):732-9.
21. Klein BE, Klein R, McBride PE, Cruickshanks KJ, Palta M, Knudtson MD, et al. Cardiovascular disease, mortality, and retinal microvascular characteristics in type 1 diabetes: Wisconsin epidemiologic study of diabetic retinopathy. Arch Intern Med. 2004;164(17):1917-24.
22. Klein R, Meuer SM, Moss SE, Klein BE. Retinal microaneurysm counts and 10-year progression of diabetic retinopathy. Archives of ophthalmology (Chicago, Ill : 1960). 1995;113(11):1386-91.
23. Kwiterovich KA, Maguire MG, Murphy RP, Schachat AP, Bressler NM, Bressler SB, et al. Frequency of adverse systemic reactions after fluorescein angiography. Results of a prospective study. Ophthalmology. 1991;98(7):1139-42.
24. Lumbroso B, Rispoli M, Savastano MC.
LONGITUDINAL OPTICAL COHERENCE TOMOGRAPHY-ANGIOGRAPHY STUDY OF TYPE 2 NAIVE CHOROIDAL NEOVASCULARIZATION EARLY RESPONSE AFTER TREATMENT. Retina (Philadelphia, Pa). 2015;35(11):2242-51.
25. Lupidi M, Coscas G, Coscas F, Fiore T, Spaccini E, Fruttini D, et al. Retinal Microvasculature in Nonproliferative Diabetic Retinopathy: Automated
Quantitative Optical Coherence Tomography Angiography Assessment. Ophthalmic research. 2017.
26. Miwa Y, Murakami T, Suzuma K, Uji A, Yoshitake S, Fujimoto M, et al. Relationship between Functional and Structural Changes in Diabetic Vessels in Optical Coherence Tomography Angiography. Scientific reports. 2016;6:29064.
27. Miyamoto K, Khosrof S, Bursell SE, Moromizato Y, Aiello LP, Ogura Y, et al. Vascular endothelial growth factor (VEGF)-induced retinal vascular permeability is mediated by intercellular adhesion molecule-1 (ICAM-1). Am J Pathol. 2000;156(5):1733-9.
28. Moore J, Bagley S, Ireland G, McLeod D, Boulton ME. Three dimensional analysis of microaneurysms in the human diabetic retina. J Anat. 1999;194 ( Pt 1):89-100.
29. Nassif N, Cense B, Park B, Pierce M, Yun S, Bouma B, et al. In vivo high-resolution video-rate spectral-domain optical coherence tomography of the human retina and optic nerve. Opt Express. 2004;12(3):367-76.
30. Nishikawa T, Edelstein D, Du XL, Yamagishi S, Matsumura T, Kaneda Y, et al. Normalizing mitochondrial superoxide production blocks three pathways of hyperglycaemic damage. Nature. 2000;404(6779):787-90.
31. Nunes S, Pires I, Rosa A, Duarte L, Bernardes R, Cunha-Vaz J. Microaneurysm turnover is a biomarker for diabetic retinopathy progression to clinically significant macular edema: findings for type 2 diabetics with nonproliferative retinopathy. Ophthalmologica. 2009;223(5):292-7.
32. Parravano M, De Geronimo D, Scarinci F, Querques L, Virgili G, Simonett JM, et al. Diabetic Microaneurysms Internal Reflectivity on Spectral-Domain Optical Coherence Tomography and Optical Coherence Tomography Angiography Detection. American journal of ophthalmology. 2017;179:90-6.
33. Seidel G, Aschinger G, Singer C, Herzog SA, Weger M, Haas A, et al. Estimating Retinal Blood Flow Velocities by Optical Coherence Tomography. JAMA ophthalmology. 2016;134(10):1104-10.
34. Spaide RF. RETINAL VASCULAR CYSTOID
MACULAR EDEMA: Review and New Theory. Retina (Philadelphia, Pa). 2016;36(10):1823-42.
35. Spaide RF, Fujimoto JG, Waheed NK. Image Artifacts in Optical Coherence Angiography. Retina (Philadelphia, Pa). 2015;35(11):2163-80.
36. Stitt AW, Gardiner TA, Archer DB. Histological and ultrastructural investigation of retinal microaneurysm development in diabetic patients. Br J Ophthalmol. 1995;79(4):362-7.
37. Tokayer J, Jia Y, Dhalla AH, Huang D. Blood flow velocity quantification using split-spectrum amplitude-decorrelation angiography with optical coherence tomography. Biomedical optics express. 2013;4(10):1909-24.
38. Wang H, Chhablani J, Freeman WR, Chan CK, Kozak I, Bartsch DU, et al. Characterization of diabetic microaneurysms by simultaneous fluorescein angiography and spectral-domain optical coherence tomography. American journal of ophthalmology. 2012;153(5):861-7 e1.
39. Wautier JL, Guillausseau PJ. Advanced glycation end products, their receptors and diabetic angiopathy. Diabetes Metab. 2001;27(5 Pt 1):535-42.
40. Yamada Y, Suzuma K, Fujikawa A, Kumagami T, Kitaoka T. Imaging of laser-photocoagulated diabetic microaneurysm with spectral domain optical coherence tomography. Retina (Philadelphia, Pa). 2013;33(4):726-31.
CONTACT
João Esteves Leandro
Department of Ophthalmology of São João Hospital, Avenida Prof. Hernâni Monteiro
4202 – 451 Porto, Portugal E-mail: joaoedpl@gmail.com