Global J. Environ. Sci. Manage., 1(3):199-204, Summer 2015
Phytotoxicity of methylene blue to rice seedlings
*X.Z. Yu; Y.X. Feng; D.M. Yue
The Guangxi Key Laboratory of Theory and Technology for Environmental Pollution Control, College of Environmental Science & Engineering, Guilin University of Technology, Guilin 541004, People’s Republic
of China
A B S T RA C T: Methylene blue is widely used in various industrial branches. Due to insufficient treatment, its occurrence in wastewater is frequently detected, which may result in serious environment problems to aquatic organisms. Hydroponic experiments were conducted with rice seedlings (Oryza sativa L. cv. XZX 45) exposed to methylene blue to determine the effective concentration using relative growth rate and water use efficiency as response endpoints. Results showed that acute toxicity of methylene blue to rice seedlings was evident. Although a linear decrease in relative growth rate and water use efficiency was observed in rice seedlings with increasing methylene blue concentrations, relative growth rate of rice seedlings was more sensitive to change of methylene blue than water use efficiency. Using non-linear regression, EC-48 h values for 10%, 20% and 50% inhibition of the relative growth rate were estimated to be 1.54, 3.22 and 10.13 mg MB/L for rice seedlings exposed to methylene blue, respectively, while smaller EC were obtained for 96 h exposure. In conclusion, the toxic response of young rice seedlings to methylene blue is obvious and inhibitory effects are highly dependent on response endpoints and the duration of exposure period.
Keywords: Effective concentration, Methylene blue, Relative growth rate, Rice, Water use efficiency Global J. Environ. Sci. Manage., 1(3):199-204, Summer 2015
ISSN 2383 - 3572
*Corresponding Author Email:yuxiaozhang@hotmail.com
Tel.: (+86) 773-5897016; Fax: (+86) 773-5896285 Note. This manuscript was submitted on February 7, 2015; approved on April 5, 2015; published online on June 1, 2015. Discussion period open until October 1, 2015; discussion can
be performed online on the Website “Show article” section
for this article. This paper is part of the Global Journal of Environmental Science and Management (GJESM).
Received 7 February 2015; revised 3 April 2015; accepted 5 April 2015; available online 1 June 2015
INTRODUCTION
Most colored effluents from various industrial branches are discharged into the environment mainly from dye manufacturing and textile finishing industries (Vadivelan and Kumar, 2005).
The presence of coloring substance in water, even at low concentrations, limits light diffusion and consequently the photosynthesis processes are inhibited (Hajjajiet al., 2006). It has become one of the most problematic sources of aesthetic pollution, eutrophication, and perturbation in aquatic ecosystems. Indeed, more than ten thousands different kind of dyes presently used in textile industry with an annual production over 7×10⁵ tons (Murugesan et al.,2007;
Ahmadet al., 2009). Recent estimates indicate that approximately 12% of synthetic textile dyes used each year are lost during manufacture and processing operations and 20% of these lost dyes enter the environment through effluents that result from the treatment of industrial wastewaters (Saueret al., 2002; Banerjee and Dastidar, 2005; Senthilkumaaret al.,2005b). It is evident that the complex aromatic structures of dyes make them more stable and more difficult to remove from wastewater since most of them are non-biodegradable aerobically (Banerjee and Dastidar, 2005), whereas anaerobic degradation of dyes is also non-suggestive due to the intermediate formation of toxic amines through incomplete destruction by bacteria in the sediment (Hamdaoui, 2005; Ahmad et al.,2009).
inks (Nasuhaet al., 2010). Due to its extensive use, occurrence in wastewater without proper treatment is problematic because MB impedes light penetration into water, reduces photosynthetic activity, and depletes dissolved oxygen in water, thereby seriously causes difficulties in the ecosystems of the receiving water (Bulut and Aydm, 2006; Ahmadet al., 2009). Although MB is not strongly hazardous but on inhalation, it can show various harmful effects (Ahmadet al., 2009). The dye may cause permanent eye injury to humans and animals (Senthilkumaaret al.,2005a). The ingestion of MB causes irritation to the gastrointestinal tract with symptoms of nausea, vomiting, and diarrhea (Banerjee and Dastidar, 2005; Senthilkumaaret al.,2005b; Tanet al., 2008). It may also cause methemoglobinemia, cyanosis, convulsions, tachycardia, and dyspnea, if inhaled (Senthilkumaaret al., 2005a,b).
In our previous work, phytotoxic effects of MB on the accumulation of hydrogen peroxide (H2O2), activities and gene expression of antioxidant enzymes in rice seedlings were investigated (Yuet al., 2014). We found that MB-induced accumulation of H2O2 was evident in both roots and shoots and the activities of enzymes related to the ascorbate-glutathione cycle were more sensitive to MB treatments than other antioxidative enzymes (Yuet al.,2014). Trappet al., (2000) specially developed an acute hydroponic phytotoxicity for chemicals using growth, transpiration and water use efficiency to evaluate the impacts of pollutants to plants. Stress reduces the water use efficiency (Larcher, 1995), and a change in the water use efficiency can be used as indicator for chemical stress to the trees on a sublethal level (Trapp et al., 2000). Our objective was to quantify the effective concentration (EC) based on different response parameters, using hydroponic experiment with rice seedlings exposed to MB. Two response endpoints, relative growth rate and water use efficiency, were studied and EC values were estimated using non-linear regression method at the respective time intervals. This work was conducted at the College of Environmental Sciences & Engineering, Guilin University of Technology, P. R. China from October 2013 to April 2014.
MATERIALS AND METHODS
Test chemicals and experiment design
Plant material and exposure regime were identical to our previous work (Yu and Zhang, 2013). Seeds of rice (Oryza sativa L. cv. XZX 45) were obtained
commercially from the Hunan Academy of Agricultural Sciences, P.R. China. Fifteen-days old rice seedlings with similar height and weight were transplanted to a pre-treatment solution containing 1 mM CaCl2 + 2 mM MES-Tris buffer (pH 6.0) for 4 h to clear the ions from cell wall space (Ebbset al., 2008), and then ten rice seedlings were transferred into a 50 mL Erlenmeyer flask filled with 50 mL modified ISO 8692 nutrient solution (Yu and Zhang, 2013) with an addition of 10 µM Fe-EDTA. The plants were kept for 24 h in modified ISO 8692 solution to adapt new environmental condition. The flasks were wrapped with aluminum foil up to the flask mouth to prevent escape of water, and to inhibit potential growth of algae inside. All flasks were housed in a plant growth chamber with constant temperature of 25 ± 0.5 °C and a relative humidity of 60 ± 2% under continuous artificial light. Then, the nutrient solutions in each flask were replaced by respective spiked solutions, except control.
Methylene blue (MB, Sinopharm Chemical Reagent Co., Ltd., Shanghai, PR China) of analytical grade with > 98.5% purity were used. Nominal concentrations were used in this study. Eight different concentrations were used for each testing chemical. Each treatment concentration was conducted in four independent biological replicates. Two test series (2-d and 4-d exposure period) were conducted.
Relative growth rate
Rice seedlings were weighed prior to application and at termination of exposure. The relative growth rate (RGR, %) was calculated using the formula
100
) (
) ( ) (
I I F
M
M
M
RGR
Where,M(I) andM(F)are the initial and final weight (g) of rice seedlings, respectively.
Water use efficiency
Water use efficiency (WUE) (mg biomass/g water) is the ratio between produced biomass and water transpired (Trappet al., 2000).
transpired I F
V
M
M
WUE
( )
( )WhereM(I)andM(F) are the initial and final weight (mg) of rice seedlings.Vtranspired is the transpiration (g water) of seedlings calculated by the weight loss of the plant-flask system.
(1)
Global J. Environ. Sci. Manage., 1(3):199-204, Summer 2015
Inhibition rate
Percent inhibition rate (IR, %) on each parameter was calculated using the equation
100
)
1
1
1
(
1 ( ,) 1 ( ,) ) , (
mj Ot
n
i Ct
t C
m
n
IR
µ
µ
WhereC is concentration (mg MB/L),t is time period (d), is different measured parameter,i is replicate 1,
2,…,n and jis control 1, 2,…,m.
Effective concentration
Effective concentration (EC) was determined by measurement endpoints of acute toxicity using different parameters of treated plants. The EC values at the respective time intervals were estimated by non-linear regression using the statistical program MATLAB v.2008a with 95% confidence intervals.
In order to evaluate the goodness of all correlations from different selected parameters, the residual root mean square error (RMSE) was derived using the following equation.
n i i iir
IR
n
RMSE
1 2)
(
2
1
Where IRi is the calculated IR values from the phytotoxicity tests, iri is the estimate from the simulated curves for corresponding IRi andn is the number of replicates for treatments.
Statistical method
Analysis of variance (ANOVA) and Tukey’s multiple
range test was used to determine the statistical significance at 0.05 between the treatments (Sachs, 1992).
RESULTS AND DISCUSSION
Phytotoxicity of MB to rice seedlings
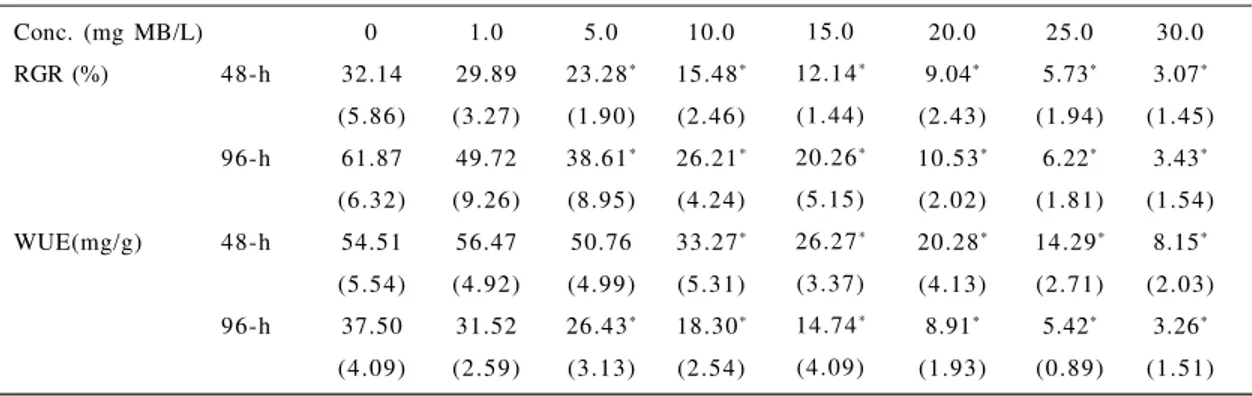
Table 1 shows the measured relative growth rate and water use efficiency of rice seedlings grown hydroponically. All rice seedlings showed a positive growth response after 2-d incubation, however a linear decrease in relative growth was observed with increasing MB concentrations (R2=0.947, n=8). A significant decrease in relative growth rate was observed with rice seedlings exposed to 5.0 mg MB/L onwards (p<0.05) in comparison to control. Water use efficiency in MB-treated rice seedlings also showed a dose-dependent decrease (R2=0.968, n=8). Decrease in water use efficiency was significant at higher than or equal to 10.0 mg MB/L (p<0.05). Visible toxic symptoms of chlorosis were not observed in any of the treatments after 2-d exposure.
The change of relative growth rate also presented a negative linear correlation (R2=0.921, n=8), with increasing MB concentration in the treatment solution after 4-d exposure. MB caused significant decrease in relative growth rate at 5.0 mg MB/L or higher concentrations (p<0.05). Similarly, a dose-d e p en dose-d en t dose-d e cre ase in wa ter us e effic ien cy (R2=0.952, n=8) was observed in MB-treated rice seedlings after 4-d exposure.
Effective concentrations of MB to rice seedlings The corresponding inhibition rate of different response parameters at different exposure periods are
Conc. (mg MB/L)
RGR (%)
WUE(mg/g)
Conc. (mg MB/L)
48-h 96-h 48-h 96-h 0 32.14 (5.86) 61.87 (6.32) 54.51 (5.54) 37.50 (4.09) 1.0 29.89 (3.27) 49.72 (9.26) 56.47 (4.92) 31.52 (2.59) 5.0 23.28* (1.90) 38.61* (8.95) 50.76 (4.99) 26.43* (3.13) 10.0 15.48* (2.46) 26.21* (4.24) 33.27* (5.31) 18.30* (2.54) 15.0 12.14* (1.44) 20.26* (5.15) 26.27* (3.37) 14.74* (4.09) 20.0 9.04* (2.43) 10.53* (2.02) 20.28* (4.13) 8.91* (1.93) 25.0 5.73* (1.94) 6.22* (1.81) 14.29* (2.71) 5.42* (0.89) 30.0 3.07* (1.45) 3.43* (1.54) 8.15* (2.03) 3.26* (1.51) Table 1: Effects of various MB concentrations (mg/L) on relative growth rate (RGR, %) and water use efficiency (WUE,
mg biomass/g water transpired) of rice seedlings. Values are mean of 4 independent biological replicates. Numerical values in brackets represent standard deviation. Asterisk symbol refers to the significance difference between MB treatment and control (p < 0.05).
(3)
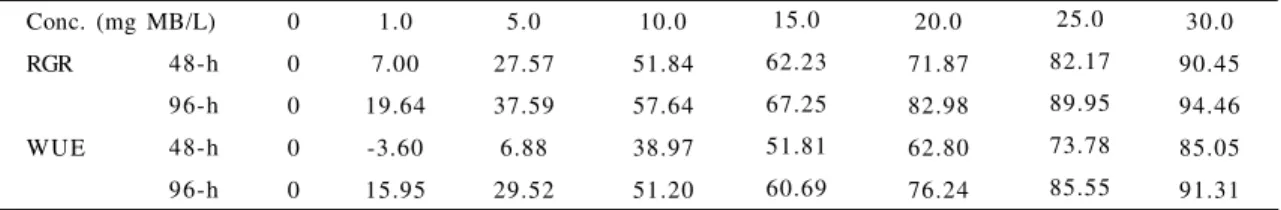
shown in Table 2. It is obvious that inhibition rates of both variables increased with the dose of MB supplied, but the rates between the two parameters were found to be different. Rice seedlings grown in the MB treatment at 1.0 mg MB/L showed only a 7.0% inhibition rate in the relative growth rate after 2-d exposure, where a positive increase of 3.60% was observed in the inhibition rate of water use efficiency. When exposed to 5.0 mg MB/L onwards, the effect on inhibition rates occurred more severe, in which more than 27% inhibition rate of both variables was observed. However, the inhibition rate of relative growth rate was always higher than that of water use efficiency at the respective concentration. It is worthwhile to note that the both inhibition rates at the 4-d treatments significantly increased in comparison to the 2-d treatments, but the inhibition rates were found to be different at different MB concentrations. The inhibition rate of relative growth rate was also higher than that of water use efficiency at all MB-treated rice seedlings.
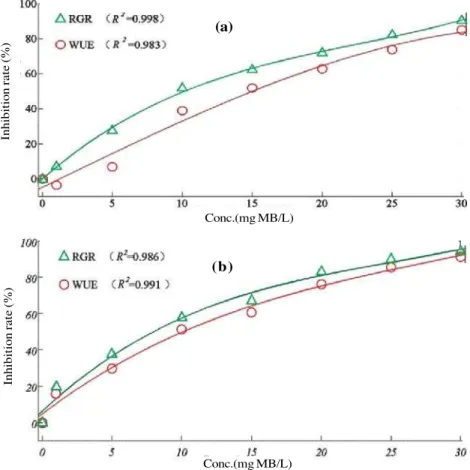
The effective concentration (EC) is defined by the concentration of a chemical, which produces percentage inhibition of the maximum possible response for that chemical (Yuet al., 2006). In our study, the EC10, EC20 and EC50 correspond to the dose, at which the relative growth rate and water use efficiency are inhibited 10%, 20% or 50%. Non-linear regression was conducted to calculate the effective concentration (EC) values using the statistical program MATLAB. The simulation curves of concentration-response model shown in Fig. 1 indicated that all trends yielded were significant, judged by the critical R for givenn ( = 0.05). Therefore, the EC values for different parameters at the respective time interval can be estimated using the fitting equations. Results of the EC values depict in Table 3. It is obvious that the smaller EC value was obtained from relative growth rate than that from water use efficiency, suggesting that the former is more sensitive to the change of MB treatments than the latter.
Reliability of EC estimation
Here, we have an interest to evaluate the reliability of EC values yielded by using non-linear regression. Usually, the significance of simulation curve is judge by regression coefficient (R2) and RMSE. It is known that the higherR2 value the better fit curve, while the smaller RMSE value the better fit curve. Therefore, it is apparent that RGR showed a better fit than WUE for the 48-h treatment. For the 96-h treatment, a different result was obtained in which WUE had a better fit than RGR. It is suggestive that MB had a stronger influence on RGR of rice seedlings than WUE over a 48-h period of exposure. When rice seedlings were exposed to MB even longer, reduction in WUE of rice seedling was largely due to an outcome of MB causing reduction in transpiration rate. This is also judged by the ratio of EC (WUE) to EC (RGR), in which the ratios for EC10, EC20 and EC50 were determined to be 1.74, 1.37 and 1.26 for the 96-h treatment while the respective values for the 48-h treatment were 2.48, 2.01, and 1.48, respectively. It is obvious that the effect of MB on RGR gradually decreased when exposure periods increased, suggesting that MB may be degradable by rice seedlings through an undefined degradation pathway. Further studies on the presence of possible enzymes involved in and their expression quantitatively in the assimilation processes of MB in plants using DNA based molecular analyses is needed to unravel the complete picture of the assimilation pathways of MB in plants.
Comparison to other findings
Anthropogenic inputs result in a significant release of MB into the environment on a continuous basis. Plants have been considered as one of the candidate receivers for MB. Plant assays with MB are required to measure ultimate adverse responses of plants, which is useful for field trial for phytoremediation. This current study suggests that phyto-assimilation of MB
Table 2: Inhibition rate of relative growth rate (RGR, %) and water use efficiency (WUE, mg biomass/g water transpired) of rice seedling exposed to MB. Values are mean of 4 independent biological replicates.
Conc. (mg MB/L)
RGR
WUE
48-h
96-h
48-h
96-h 0
0
0
0
0
1.0
7.00
19.64
-3.60
15.95
5.0
27.57
37.59
6.88
29.52
10.0
51.84
57.64
38.97
51.20
15.0
62.23
67.25
51.81
60.69
20.0
71.87
82.98
62.80
76.24
25.0
82.17
89.95
73.78
85.55
30.0
90.45
94.46
85.05
Global J. Environ. Sci. Manage., 1(3):199-204, Summer 2015
is a possible removal process involved in phytoremediation. Moreover, if plants are able to remove MB from the contaminated media due to degradation in the presence of specific enzymes responsible for degrading MB, the complete destruction of MB by plants can be expected. In this current study, we also observed that transpiration rates are also sensitive to change of MB when exposure period increased. It is known that plants transpire considerable amounts of water and thus can reverse
the downward migration of water-soluble chemicals (Schnooret al.,1995). Therefore, screening appropriate trees has become the key for the design of phytoremediation systems in field application. Additionally, other factors need to be considered, e.g., water regime of the site, temperature regime, soil conditions, resistance to local pathogens and parasites, growth rate of the plants, growth period, use of the harvest product, beauty of the plants, and of course the MB elimination capacity.
Fig. 1: Simulation curves of inhibition rates of various parameters of rice seedlings exposed to different MB concentrations at different exposure periods (Fig. 1a: 48-h, Fig. 1b: 96-h; RGR: relative growth rate, WUE: water use efficiency; Values are mean of 4 independent biological replicates).
(a)
(b)
Chemicals
MB (mg/L) 48-h
96-h RGR
EC10
1.54
0.54 EC20
3.22
2.08 EC50
10.13
8.09
R2
0.998
0.986
RMSE
1.69
5.21
WUE
EC10
3.82
0.94 EC20
6.47
2.85 EC50
15.02
10.16
R2
0.983
0.991
RMSE
5.86
4.25 Table 3: Estimation of the EC (mg MB/L) of MB to rice seedlings using different endpoints for phytotoxicity
Conc.(mg MB/L)
In
h
ib
it
io
n
r
at
e
(
%
)
In
h
ib
it
io
n
r
at
e
(
%
)
CONCLUSION
The results presented here indicated that acute phytotoxicity of MB on rice seedlings was apparent. Both parameters of relative growth rate and water use efficiency in MB-treated rice seedlings showed a dose-dependent decrease. The estimation of EC values revealed that the relative growth rate was more susceptible to the change of MB than water use efficiency at both treatments.
ACKNOWLEDGEMENTS
This work was financially supported by the research foundations from Guilin University of Technology (Grant No.:GUTRC2011007) and The Guangxi Key Laboratory of Theory and Technology for Environmental Pollution Control (Grant No.: 1201Z029) and The Guangxi Talent Highland for Hazardous Waste Disposal Industrialization.
CONFLICT OF INTEREST
The authors declare that they have no conflict of interest.
REFERENCES
Ahmad, A.; Rafatullah, M.; Sulaiman, O.; Ibrahim, M.H.; Hashim, R., (2009). Scavenging behaviour of meranti sawdust in the removal of methylene blue from aqueous solution, J. Hazard.
Mater., (170): 357–365 ( 9 pages).
Banerjee, S.; Dastidar, M.G., (2005). Use of jute processing wastes for treatment of wastewater contaminated with dye and other
organics, Bioresour. Technol., (96): 1919–1928 (10 pages).
Bulut,Y.; Aydm, H., (2006). A kinetics and thermodynamics study of methylene blue adsorption on wheat shells,
Desalination, (194): 259–267(9 pages).
Ebbs, S.D.; Piccinin, R.C.; Goodger, J.Q.D.; Kolev, S.D.; Woodrow, I.E.; Baker, A.J.M., (2008). Transport of ferrocyanide by two eucalypt species and sorghum, Int. J. Phytorem., (10):
343–357 (15 pages).
Hamdaoui, O., (2005). Batch study of liquid-phase adsorption of methylene blue using cedar sawdust and crushed brick, J.
Hazard. Mater., (B135): 264–273 (10 pages).
Hajjaji, M.; Alami, A.; Bouadili, A.E., (2006). Removal of methylene blue from aqueous solution by fibrous clay minerals,
J. Hazard. Mater., (B135): 188–192 (5 pages).
Larcher, W., (1995). Physiological plant ecology, 3d ed. Springer, Berlin.
Murugesan, K.; Dhamija, A.; In-Hyun, N.; Young, M.; Yoon-Seok, C., (2007). Decolourization of reactive black 5 by laccase: optimization by response surface methodology,
Dyes Pigments., (75): 176–184 (9 pages).
Nasuha, N.; Hameed, B.H.; Moha-Din, A.T., (2010). Rejected tea as a potential low-cost adsorbent for the removal of
methylene blue, J. Hazard. Mater., (175): 126–132(7 pages).
Sachs, L., (1992). Angewandte Statistik, Springer, Berlin. Sauer, T.; Cesconeto Neto, G.; Jose, H.J.; Moreira, R.F.P.M.,
(2002). Kinetics of photocatalytic degradation of reactive dyes in a TiO2slurry reactor, J. Photochem. Photobiol. A.,
(149): 147–154 (8 pages).
Schnoor, J.L.; Licht, L.A.; McCutcheon, S.C.; Wolfe, N.L.; Carreira, L.H., (1995). Phytoremediation of organic and nutrient contaminants, Environ. Science. Technol., (29):
318–323 (6 pages).
Senthilkumaar, S.; Porkodi, K.; Vidyalaksmi, R., (2005a). Photodegradation of a textile dye catalyzed by sol-gel derived nanocrystalline TiO2 via ultrasonic irradiation, J.
Photochem. Photobiol. A., (170):225–232 (8 pages).
Senthilkumaar, S.; Varadarajan, P.R.; Porkodi, K.; Subbhuraam, C.V., (2005b). Adsorption of methylene blue onto jute fiber carbon: kinetics and equilibrium studies, J. Colloid
Interf. Sci., (284): 78–82(5 pages).
Tan, I.A.W.; Ahmad, A.; Hameed, B.H., (2008). Adsorption of basic dye using activated carbon prepared from oil palm
shell: batch and fixed bed studies, Desalination, (225):13–
28 (16 pages).
Trapp, S.; Zambrano, K.C.; Kusk, K.O.; Karlson, U., (2000). A phytotoxicity test using transpiration of willows, Arch.
Environ. Contam. Toxicol., (39):154–160 (7 pages).
Vadivelan, V.; Kumar, .K.V., (2005). Equilibrium, kinetics, mechanism, and process design for the sorption of methylene blue onto rice husk, J. Colloid Interf. Sci., (286):
90–100 (11 pages).
Yu, X.Z.; Trapp, S.; Zhou, P.H.; Peng, X.Y.; Cao, X., (2006). Response of weeping willows to linear alkylbenzene
sulfonate, Chemosphere, (64): 43–48 (6 pages).
Yu, X.Z.; Zhang, F.Z., (2013). Effects of exogenous thiocyanate on mineral nutrients, antioxidative responses and free amino acids in rice seedlings, Ecotoxicology, (22):
752–760 (9 pages).
Yu, X.Z.; Zhang, X.H.; Yue, D.M., (2014). Alternation of antioxidative enzyme gene expression in rice seedlings exposed to methylene blue, Environ. Sci. Pollut. Res., (21): 14014–14022 (9 pages).
AUTHOR (S) BIOSKETCHES
Yu, X.Z.,Ph.D., Professor; The Guangxi Key Laboratory of Theory and Technology for Environmental Pollution Control, College of
Environmental Science & Engineering, Guilin University of Technology, Guilin 541004, People’s Republic of China.
Email:yuxiaozhang@hotmail.com
Feng, Y.X., M.Sc. Student; The Guangxi Key Laboratory of Theory and Technology for Environmental Pollution Control, College of Environmental
Science & Engineering, Guilin University of Technology, Guilin 541004, People’s Republic of China. Email:fjgzfyx@163.com
Yue, D.M., M.Sc. Student; The Guangxi Key Laboratory of Theory and Technology for Environmental Pollution Control, College of Environmental
Science & Engineering, Guilin University of Technology, Guilin 541004, People’s Republic of China. Email:925169764@qq.com
How to cite this article: (Harvard style)