1 Departamento de Fitotecnia/UFSM, Av. Roraima, Prédio 77, CEP 97105-900, Camobi, Santa Maria, RS. Fone: (55) 3220-8179. E-mail: [email protected]; [email protected]; [email protected]
Leaf development of cultivated rice and weedy red
rice under elevated temperature scenarios
Nereu A. Streck1, Lilian O. Uhlmann1 & Luana F. Gabriel1
ABSTRACT
The objective of this study was to simulate leaf development of cultivated rice genotypes and weedy red rice biotypes in climate change scenarios at Santa Maria, RS, Brazil. A leaf appearance (LAR) model adapted for rice was used to simulate the accumulated leaf number, represented by the Haun Stage, from crop emergence to flag leaf appearance (EM-FL). Three cultivated rice genotypes and two weedy red rice biotypes in six emergence dates were used. The LAR model was run for each emergence date using 100 years of synthetic daily weather data and six climate scenarios, including current, +1, +2, +3, +4 and +5 °C increase in mean air temperature, with symmetric and asymmetric increase in daily minimum and maximum temperature. The increase in air temperature scenarios decreased the duration of the EM-FL phase in the earlier emergence dates (08/20, 09/20, 10/20) whereas in mid (11/20) and late emergence dates (12/20 and 01/20) the longest EM-FL phase was in the symmetric +5 °C scenario and the shortest duration was in the asymmetric +3 and +4 °C scenarios. The timing of the onset of flooding irrigation and nitrogen dressing may be altered if global warming takes place and weedy red rice has a potential to enhance its competitiveness with cultivated rice in future climates.
Key words: Oryza sativa, global warming, plant competition, climate change, nitrogen management
Desenvolvimento foliar de arroz cultivado
e arroz vermelho em cenários de aumento de temperatura
RESUMO
Objetivou-se com este estudo simular o desenvolvimento foliar de genótipos de arroz cultivados e biótipos invasores de arroz vermelho em cenários de mudança climática em Santa Maria, Rio Grande do Sul, Brasil. Um modelo de aparecimento de folhas foi usado para simular o número de folhas acumuladas, representadas pelo Estádio de Haun, a partir da emergência da cultura até o aparecimento da folha bandeira (EM-FB). Foram utilizados três genótipos de arroz cultivados e dois biótipos de arroz vermelho, em seis épocas de emergência. O modelo foi rodado em cem anos de seis cenários climáticos: atual, +1, +2, +3, +4 e +5 °C, com aumentos simétricos e assimétricos na temperatura mínima e máxima diária do ar. O aumento da temperatura nos cenários ocasiona uma redução da duração da fase EM-FB nas datas de emergência mais cedo (20/08, 20/09, 20/10) enquanto no período intermediário (20/11) e nas datas de emergência tardias (20/12 e 20/01) a maior duração da fase EM-FB foi no cenário simétrico +5 °C e a menor duração foi nos cenários assimétricos de +3 e +4 °C. O momento do início da irrigação por inundação e manejo do nitrogênio em cobertura pode ser alterado com o aquecimento global e o arroz vermelho tem potencial para aumentar sua competitividade com arroz cultivado em climas futuros.
Palavras-chave: Oryza sativa, aquecimento global, competição entre plantas, mudança climática, manejo do nitrogênio
v.17, n.2, p.190–199, 2013
IntroductIon
There is a growing consensus among scientists that climate is changing and that global temperature has increased during the 20th century and will continue to rise by the end of the 21st
century as a consequence of an increase in greenhouse gases concentration in the atmosphere (Vose et al., 2005; IPCC, 2007; Easterling & Wehner, 2009). In many locations, including in Brazil, the rise in air temperature has been asymmetric, with greater increase in minimum than in maximum daily temperature (Peng et al., 2004; Vose et al., 2005; Marengo & Camargo, 2008; Sansígolo & Kayano, 2010).
Rice (Oryza sativa L.) is one of the three major cereals produced and consumed worldwide (USDA, 2010). Brazil is the largest rice producer outside Asia and Rio Grande do Sul (RS) is the main rice producing State in Brazil (IRGA, 2010). The average rice yield in RS (about 7 t ha-¹) is well above the average
yield of Brazil (about 4 t ha-1), but still below the potential
yield, greatly due to biotic factors, among them weedy red rice (Marchezan et al., 2004). Because agriculture is a vulnerable sector to climate change (IPCC, 2007; Fagundes et al., 2010a, b), the response of crops yield to climate change scenarios, including rice, has been addressed (Streck, 2005; Walter et al., 2010). However, in order to fully understand how crops will respond to climate change, in addition to yield, more basic plant processes, such as leaf development, need to be studied both in crops and in weeds, because leaf development, represented by leaf appearance and leaf number accumulation is related to leaf area index and, in rice, to some reproductive development stages as vegetative development overlaps reproductive development (Counce et al., 2000), but such studies have not been addressed in Brazil, which constituted a rationale for this effort. The objective of this study was to simulate leaf development of cultivated rice genotypes and weedy red rice biotypes in climate change scenarios at Santa Maria, RS, Brazil, considering symmetric and asymmetric increases in daily minimum and maximum air temperatures.
MaterIal and Methods
A numerical study was performed for Santa Maria, RS, Brazil (latitude: 29º 43’ S, longitude: 53 º43’ W, and altitude: 95 m). This site is located in a major rice production region of the Rio Grande do Sul State (Depressão Central Region) and has a Cfa (warm and wet subtropical) climate formula according to the Köppen Climate System (Kuinchtner & Buriol, 2001).
Three cultivated rice genotype (IRGA 417, EEA 406, and a hybrid) and two weedy red rice biotypes (awned yellow-hull and awned black-hull) were used in this study IRGA 417 is a modern short, early, indica type cultivar developed by the Instituto Rio Grandense do Arroz (IRGA) well adapted and currently grown in Rio Grande do Sul State, with high yield and excellent milling and cooking properties whereas EEA 406 is an old, tall, late, japonica type cultivar also developed by IRGA and cultivated in the Rio Grande do Sul State in the 60’s and 70’s. The hybrid is an unreleased genotype developed by IRGA and included here to broaden the genotype range of cultivated rice due to heterosis, hereafter referred as HYBRID.
The two weedy red rice biotypes, referred hereafter as YHRR (yellow-hull red rice) and BHRR (black-hull red rice), are representative of the major pool of red rice biotypes found in commercial rice fields in Rio Grande do Sul State and are tall, with broad and light green leaves, and high and early kernel shattering rates (Streck et al., 2009).
Leaf appearance rate (LAR) was estimated with the Wang & Engel (1998) model adapted for rice by Streck et al. (2008a):
LAR=LAR ⋅f T
( )
⋅f C( )
maxwhere:
LAR is the daily leaf appearance rate (leaves d-1), where
LARmax is the maximum daily leaf appearance rate (leaves d-1),
and f(T) and f(C) are temperature and chronology response functions respectively, varying from 0 to 1. The f(T) is a version of the beta function:
f T
T T T T T T
T T opt opt
( )
=(
−)
(
−)
−(
−)
−(
)
2 2 2min min min
min
α α α
α
for Tmin ≤ T ≤ Tmax
f T
( )
=0for T < Tmin or T > Tmax
α = − − ln
ln max min min
2
T T
Topt T
where:
Tmim, Topt and Tmax are the cardinal temperatures (minimum, optimum, and maximum, respectively) for LAR and T is the daily air temperature. The f(C) is:
f C
( )
=1 for HS<2f C HS HS
b
( )
= ≥ 2 2 for where:HS is the Haun Stage, calculated as HS = Σ LAR and updated each day of the simulation of LAR, and b is a shape factor coefficient
The coefficient LARmax (Eq. 1) is genotype-specific and for
the rice genotypes and weedy red rice biotypes. The LARmax used in this study were obtained by Streck et al. (2008b), and include: IRGA 417= 0.349 leaves d-1, EEA 406 = 0.277 leaves
d-1, HYBRID = 0.323 leaves d-1, YHRR = 0.316 leaves d-1,
BHRR= 0.219 leaves d-1. The cardinal temperatures for LAR
(Eqs. 2, 3 e 4) were Tmin = 11 ºC, Topt = 26 ºC and Tmax = 40 ºC, and the coefficient “b” in Eq. (6) is -0.3 for all rice genotypes
(Streck et al., 2008b). The f(T) was calculated for minimum (TM) and for maximum (TX) daily air temperatures and then averaged (Lago et al., 2008). The accumulated leaf number (LN), represented by the Haun Stage (HS), was calculated starting at crop emergence by accumulating daily LAR values, that is, HS = Σ LAR.
Six emergence dates were considered in the simulations: 08/20, 09/20, 10/20, 11/20, 12/20 and 01/20. This wide range of emergence dates were selected to have plants developing before, during, and after the currently recommended sowing period for rice in this location, which is from 10/01 to 12/10 (SOSBAI, 2010). The LAR calculations started at the above emergence dates and ended at the day when the flag leaf emerged, which was defined by the main stem final leaf number (FLN). The FLN depended on genotype and on emergence date, and was based on Streck et al. (2006; 2009) and presented in Table 1.
in rice (Streck et al., 2008a). The LAR model (Eq. 1) was run for each of the eleven one-hundred years climate scenarios. Simulations started during the second semester and ended in the first semester of the following year, and therefore, there were ninety-nine growing seasons in the one hundred years of each climate scenario.
The variable of interest was the duration (days) of the crop emergence to the flag leaf appearance (EM-FL) phase. Mean and standard deviation of the duration of the EM-FL phase were calculated for each climate scenario. ANOVA was performed considering a three-factor experiment, with main effects being genotypes (five levels), emergence dates (six levels) and climate scenarios (eleven levels) in a completely randomized design, and considering each year of the simulations as a replication (Weiss et al., 2003). Means of the variable EM-FL phase were distinguished using the Tukey test at 0.05 probability. Furthermore, as in the currently used phenological scale in rice by Counce et al. (2000), vegetative development is coded as main stem V-stages, varying from V1 (first leaf is expanded) to Vn (flag leaf is expanded) and the date of the V3 stage (Counce et al., 2000) was also estimated when the onset of flooding irrigation and nitrogen dressing are recommended in rice paddies (SOSBAI, 2010). To go from HS simulated with the LAR model to the V-Staging system of Counce et al. (2000) is simply to round down the HS, i.e., the V3 stage is when 3.0 ≤ H < 4.0.
results and dIscussIon
The ANOVA for the variable duration of the EM-FL phase indicated significant main effects and significant genotype
× emergence date × climate scenarios interaction at 0.05 probability. Therefore, further analyses (Tukey test) were split accordingly in order to test the effect of climate scenarios within each genotype and emergence date (Figures 1 to 3) as well as the effect of genotype within each climate scenarios and emergence date (Figures 4 to 9). Among the main effects, ANOVA showed a larger mean square for emergence date (1269141.5) followed by genotype (429142.3) and climate scenarios (18791.9), suggesting that, in this experiment, the emergence date has a larger effect on leaf development than genotypes and climate scenarios. This is important as sowing period currently recommended for rice in this subtropical location is short 10/01 to 12/10 (SOSBAI, 2010) and therefore it is of great interest to growers and extensionists how climate change scenarios may affect leaf development when emergence date changes either within and outside the current recommended sowing period.
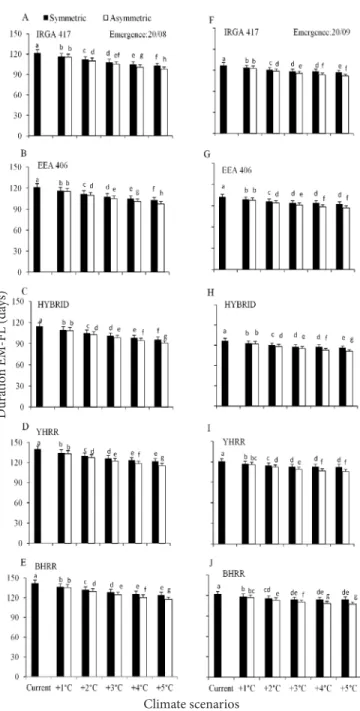
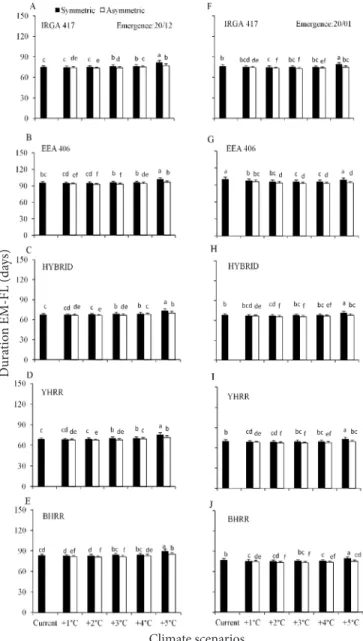
Among climate scenarios, the longest EM-FL phase was under current climate in the early emergence dates 08/20 (Figure 1A to 1E), 09/20 (Figure 1F to 1J), and 10/20 (Figure 2A to 2E) with decreasing duration as temperature increased, whereas in mid (11/20) and late emergence dates (12/20 and 01/20) the longest EM-FL phase was in the symmetric +5 °C scenario and the shortest duration was in the asymmetric +3 and +4 °C (Figure 2F to 2J, and Figure 3A to 3J). Comparing the duration of the EM-FL phase between symmetric and asymmetric increases in air temperature scenarios,
Table 1. Values of main stem final leaf number (FLN
leaves) for each cultivated rice genotype (IRGA 417, EEA 406, and Hybrid) and weedy red rice biotypes (YHRR and BHRR) and emergence dates used in the simulations*
Climate change scenarios used in this study were one hundred years of daily minimum and maximum temperatures of current climate and with increased daily mean temperature of +1, +2, +3, +4 and +5 °C. The increased temperature scenarios were further divided into symmetric and asymmetric increases in minimum and maximum daily temperatures totaling eleven climate scenarios. For the asymmetric increase scenarios, daily minimum temperature increase was 20% greater than daily maximum temperature increase to mimic a greater increase in minimum than in maximum daily temperature reported in different parts of the world (Peng et al., 2004; Vose et al., 2005; Marengo & Camargo, 2008; Sansígolo & Kayano, 2010). These climate change scenarios are synthetic time series created with the LARS-WG Weather Generator (Semenov et al., 1998) using a 1969-2003 data base of daily minimum and maximum air temperature measured at a conventional meteorological station in Santa Maria, RS, and that have been used previously in climate change studies (Lago et al., 2008; Fagundes et al., 2010b). These scenarios represent the range of climate scenarios projected by the IPCC (2007) at the end of the 21st century for the south-east
South America. Changes in other climate variables such as precipitation and solar radiation were not considered in the climate scenarios because of uncertainties in the projections of these variables by the IPCC (2007), and because these variables are assumed not to be major factors affecting LAR
Figure 1. Simulated duration of the crop emergence to flag leaf appearance (EM-FL) phase of three cultivated rice genotypes (IRGA 417, EEA 406 and HYBRID) and two weedy red rice biotypes (yellow-hull red rice- YHRR, and black- (yellow-hull red rice- BHRR) in climate scenarios (current and elevated temperature with symmetric and asymmetric increases) at two emergence dates (08/20-left hand side panels, 09/20- right hand side panels)
Figure 2. Simulated duration of the crop emergence
to flag leaf appearance (EM-FL) phase of three cultivated rice genotypes (IRGA 417, EEA 406 and HYBRID) and two weedy red rice biotypes (yellow-hull red rice- YHRR, and black- (yellow-hull red rice- BHRR) in climate scenarios (current and elevated temperature with symmetric and asymmetric increases) at two emergence dates (10/20-left hand side panels, 11/20- right hand side panels)
the duration of the phase was almost always lower in the asymmetric scenarios. These results indicate that warmer nights (asymmetric scenarios) have a greater potential to fasten the rice leaf development than cooler nights (symmetric scenarios). A shorter leaf development phase and warmer nights have the potential of decreasing the accumulation of photosyntates in the culm that are available for grain filling
because of increasing respiration rates, which ultimately may reduce grain growth and yield.
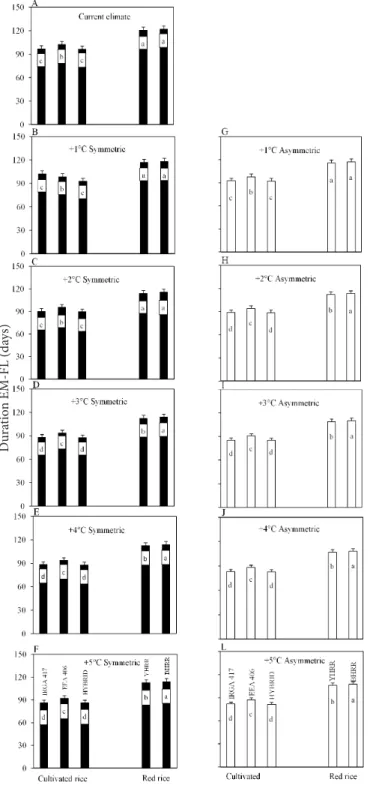
Among cultivated rice genotypes and weedy rice biotypes, the two red rice biotypes had the longest duration of the EM-FL phase in the early emergence dates 08/20 and 09/20 (Figure 4 and 5). For the late emergence dates (11/20, 12/20 and 01/20), the longest duration was for the EEA 406 cultivar
Bars are the mean of 99 growing seasons and error bars are one standard deviation of the mean. Bars linked by the same letter inside each panel are not different according to the Tukey test at 0.05 error
Bars are the mean of 99 growing seasons and error bars are one standard deviation of the mean. Bars linked by the same letter inside each panel are not different according to the Tukey test at 0.05 error
D
ura
tio
n EM-FL (d
ays)
Climate scenarios Climate scenarios
D
ura
tio
n EM-FL (d
Figure 3. Simulated duration of the crop emergence to
flag leaf appearance (EM-FL) phase of three cultivated
rice genotypes (IRGA 417, EEA 406 and HYBRID) and two weedy red rice biotypes (yellow-hull red rice- YHRR, and black- hull red rice- BHRR) in climate scenarios (current and elevated temperature with simetric and asymmetric increases) at two emergence dates (12/20-left hand side panels, 01/20- right hand
side panels) Figure 4. Simulated duration of the crop emergence to
flag leaf appearance (EM-FL) phase of threecultivated rice genotypes (IRGA 417, EEA 406, and HYBRID) and two weed red rice biotypes (yellow-hull red rice, YHRR, and black-hull red rice, BHRR) in current climate and elevated temperature scenarios with symmetric and asymmetric increases at the 08/20 emergence date
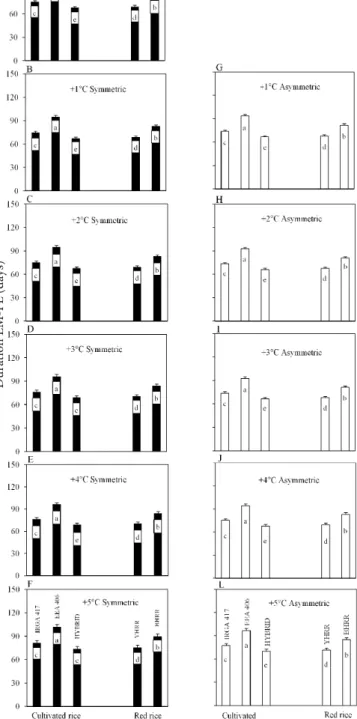
(Figure 7 to 9). In the mid emergence date (10/20) the longest EM-FL phase was for YHRR and EEA 406) (Figure 6). The shortest EM-FL phase in the early and mid emergences dates (08/20, 09/20, 10/20, 11/20) was for the HIBRID followed by IRGA 417 (Figures 4 to 7), which are modern, early rice genotypes. Only in the very late emergence dates (12/20 and 01/20) the YHRR had shorter EM-FL phase than the IRGA 417 (Figure 8 and 9). The longer duration of the EM-FL phase of red rice biotypes and the cultivated rice EEA 406 cultivar in the early and mid emergence dates reflects the genetic background
of old, late rice genotypes (Streck et al., 2008c). Among the two red rice biotypes, BHRR had the longest EM-FL phase in the two earlier emergence dates (Figure 4 and 5) and in
Bars are the mean of 99 growing seasons and error bars are one standard deviation of the mean. Bars linked by the same letter inside each panel are not different according to the Tukey test at 0.05 error
Bars are the mean of 99 growing seasons and error bars are one standard deviation of the mean. Bars linked by the same inside within each panel are not different according to the Tukey test at 0.05 error
D
ura
tio
n EM-FL (d
ays)
D
ura
tio
n EM-FL (d
ays)
Figure 5. Simulated duration of the crop emergence to
flag leaf appearance (EM-FL) phase of threecultivated rice genotypes (IRGA 417, EEA 406, and HYBRID) and two weedy red rice biotypes (yellow-hull red rice, YHRR, and black-hull red rice, BHRR) in cur-rent climate and elevated temperature scenarios with symmetric and asymmetric increases at the 09/20 emergence date
Figure 6. Simulated duration of the crop emergence to
flag leaf appearance (EM-FL) phase of threecultivated rice genotypes (IRGA 417, EEA 406, and HYBRID) and two weedy red rice biotypes (yellow-hull red rice, YHRR, and black-hull red rice, BHRR) in current climate and elevated temperature scenarios with symmetric and asymmetric increases at the 10/20 emergence date
the very late emergence date (Figures 8 and 9), indicating different environment × genotype interaction among weedy red rice biotypes.
The shortening of the EM-FL phase at elevated temperature scenarios, mainly in asymmetric (Figure 1 and 2) is in agreement with the results reported by Lago et al. (2008) who also simulated
Bars are the mean of 99 growing seasons and error bars are one standard deviation of the mean. Bars linked by the same letter inside each panel are not different according to the Tukey test at 0.05 error
Bars are the mean of 99 growing seasons and error bars are one standard deviation of the mean. Bars linked by the same letter inside each panel are not different according to the Tukey test at 0.05 error
D
ura
tio
n EM-FL (d
ays)
D
ura
tio
n EM-FL (d
Figure 7. Simulated duration of the crop emergence to
flag leaf appearance (EM-FL) phase of threecultivated rice genotypes (IRGA 417, EEA 406, and HYBRID) and two weedy red rice biotypes (yellow-hull red rice, YHRR, and black-hull red rice, BHRR) in current climate and elevated temperature scenarios with symmetric and asymmetric increases at the 11/20 emergence date
Figure 8. Simulated duration of the crop emergence to
flag leaf appearance (EM-FL) phase of threecultivated rice genotypes (IRGA 417, EEA 406, and HYBRID) and two weedy red rice biotypes (yellow-hull red rice, YHRR, and black-hull red rice, BHRR) in current climate and elevated temperature scenarios with symmetric and asymmetric increases at the 12/20 emergence date
a decrease in the emergence to panicle initiation phase in rice in warmer climates. Among uncertainties for projected future climates is if minimum and maximum temperature will rise at the same rate
or not (IPCC, 2007). If trends of greater increase in minimum than in maximum daily temperature observed in some locations in Rio Grande do Sul State (Marengo & Camargo, 2008; Sansígolo & L
Bars are the mean of 99 growing seasons and error bars are one standard deviation of the mean. Bars linked by the same letter inside each panel are not different according to the Tukey test at 0.05 error
Bars are the mean of 99 growing seasons and error bars are one standard deviation of the mean. Bars linked by the same letter inside each panel are not different according to the Tukey test at 0.05 error
D
ura
tio
n EM-FL (d
ays)
D
ura
tio
n EM-FL (d
Figure 9. Simulated duration of the crop emergence to
flag leaf appearance (EM-FL) phase of threecultivated rice genotypes (IRGA 417, EEA 406, and HYBRID) and two weedy red rice biotypes (yellow-hull red rice, YHRR, and black-hull red rice, BHRR) in current climate and elevated temperature scenarios with symmetric and asymmetric increases at the 01/20 emergence date
Kayano, 2010) will confirm in the future, than leaf development of rice and weedy red rice may also respond differently, confirming
the high vulnerability of agroecosystems to climate change (IPCC, 2007).
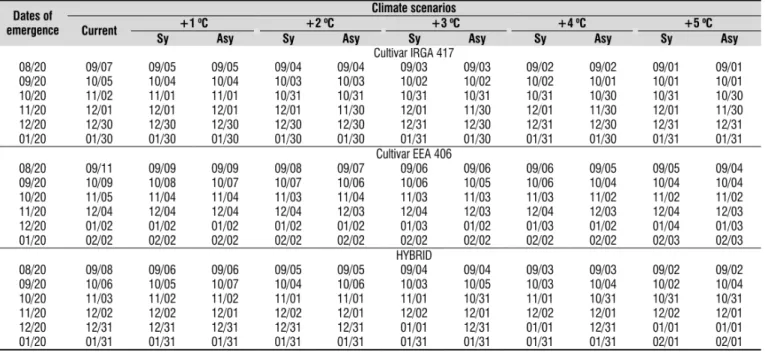
Two important field management practices in rice, the onset of flooding irrigation and nitrogen dressing, are recommended at the, V3 stage. The simulated average date of V3 for the three cultivated rice genotypes in the six emergence dates and in the eleven climate scenarios is in Table 2. Under current climate, the number of days from emergence to V3 was 18, 22, and 19 days for IRGA 417, EEA 406, and the HYBRID, respectively, in the 08/20 emergence date and decreased as emergence date was delayed, reaching 10, 12, and 11 days respectively, in the 12/20 and 01/20 emergence dates. This fastening of leaf development for the latest emergence dates is a result of the increase in air temperature from the end of winter to beginning of summer in this Subtropical location. As temperature increased in the elevated temperature scenarios, the date of V3 was anticipated in the early emergence dates (08/20, 09/20, and 10/20) and little or no change in the V3 stage was estimated for the 11/20, 12/20 and 01/20 emergence dates. The greatest anticipation in days was for the 08/20 emergence dates at the +5 °C scenario, (6, 7 and 6 days for IRGA 417, EEA 406 and the HYBRID, respectively). These results indicate that if rice is sown from November to January, increased temperature will not affect the timing of the onset of flooding irrigation and nitrogen dressing. However, if rice is sown early in August and September, future climate change may change the timing of these management practices in rice fields. This is an important mitigation strategy for decision makers and producers.
An important question for rice growers is whether the weeds competitiveness with crops will change in a future if climate changes? Because weedy red rice belongs to the same genus of the cultivated rice (Vaughan et al., 2001), i.e. they are morphologically and physiologically similar, its control is difficult (Noldin et al., 1999). Red rice biotypes has demonstrated a greater physiological plasticity than cultivated rice genotypes in elevated carbon dioxide environments, suggesting that weedy red rice may enhance its competitiveness with the crop in the future (Ziska & McClung, 2008). Our results also point towards this direction if temperature rises, as the time for flag leaf appearance is more accelerated in the red rice biotypes than in modern rice genotype at elevated temperatures (+3 to +5 °C), mainly the YHRR in the late emergence dates (12/20, 01/20) (Figure 8D, 8E, 8F, 8I, 8J, 8L, 9D, 9E, 9I, 9J, 9L). A shorter time for flag leaf appearance of weedy red rice compared to cultivated rice leads to earlier heading and kernel shattering, which ultimately leads to the maintenance and increase of seed bank in the soil.
The vulnerability of agroecosystems to projected future climates has been in the agenda of several studies. Rice has been reported to be benefited in future climate in Rio Grande do Sul (Walter et al., 2010) but these studies have not considered the effect of biotic factors, i.e., they consider only the potential yield. Our results indicate that if temperature rises, weedy red rice may respond differently in terms of development compared to cultivated rice. This is of high concern for the sustainability of the rice chain in Southern Brazil. Therefore, the next step in understanding how rice will respond to climate change in Rio Grande do Sul is to incorporate the effect of weeds on yield in the rice simulation models.
Bars are the mean of 99 growing seasons and error bars are one standard deviation of the mean. Bars linked by the same letter inside each panel are not different according to the Tukey test at 0.05 error
D
ura
tio
n EM-FL (d
Sy - symmetric increase in daily minimum and maximum air temperatures; Asy - asymmetric increase in daily minimum and maximum air temperatures
Table 2. Date (day/month) of V3 Stage (Counce et al., 2000) of three rice genotypes estimated for different climate scenarios and emergence dates
conclusIons
1. Elevated temperature scenarios accelerate leaf development in rice and weedy red rice in early and mid emergence dates. For late emergence dates, an increase of 5 °C in daily temperature delays leaf development.
2. An asymmetric increase in temperature, with warmer nights, has a greater effect on leaf development of rice and weedy red rice than a symmetric increase.
3. The timing of two important field management practices in rice, the onset of flooding irrigation and nitrogen dressing, is anticipated in warmer climates at early emergence dates.
4. Weedy red rice has a potential to enhance its competitiveness with cultivated rice in future climates.
lIterature cIted
Counce, P.; Keosçong, T. C.; Mitchell, A. J. A uniform, objective, and adaptive system for expressing rice development. Crop Science, v.40, p.436-443, 2000.
Easterling, D. R.; Wehner, M. F. Is the climate warming or cooling? Geophysical Research Letters, v.36, p.1-3, 2009. Fagundes, J. Paula, G. M.; Lago, I.; Streck, N. A.; Bisognin, D.
A. Global warming: effects on growth, development, and yield of potato. Ciência Rural, v.40, p.1-7, 2010a.
Fagundes, J. D.; Streck, N. A. Bisognin, D. A.; Schwantes, A. P.; Alberto, C. M. 2010. Potato tuber simulated yield in climate change scenarios. Pesquisa Agropecuária Brasileira, v.45, p.351-360, 2010b.
IPCC - Intergovernmental Panel on Climate Change. Climate Change 2007: The Physical Science Basis. Contribution of Working Group I to the Fourth Assessment Report of the Intergovernmental Panel on Climate Change. Cambridge: University Press, United Kingdom and New York, 2007. 996p.
IRGA - Instituto Rio Grandense do Arroz. Dados de safra. Porto Alegre: IRGA. Available at: http:www.irga.rs.gov.br/index. php?action=dados_safra 30 Jun. 2010.
Kuinchtner, A.; Buriol, G. A. The climate of the Rio Grande do Sul State according to the Köppen e Thornthwaite systems. Disciplinarum Scientia, v.2, p.171-182, 2001.
Lago, I.; Streck, N. A.; Alberto, C. M.; Oliveira, F. B; Paula, G. M. de. Impact of increasing mean air temperature on the development of rice and red rice. Pesquisa Agropecuária Brasileira, v.43, p.1441-1448, 2008.
Marchezan, E.; Ávila, L. A.; Magalhães Júnior, A. M.; Machado, S. L.; Petrini, J. A. Controle do arroz vermelho. In: Gomes, A. S.; Magalhães Júnior, A. M. Arroz irrigado no Sul do Brasil. Brasília: Embrapa Informação Tecnológica, 2004. p.547-573.
Marengo, J. A.; Camargo, C. Surface air temperature trends in Southern Brazil for 1960-2002. International Journal of Climatology, v.28, p.893-904, 2008.
Noldin, J. A.; Chandler, J. M.; McCauley, G. N. Red rice (Oryza sativa) biology. I. Characterization of red rice ecotypes. Weed Technology, v.13, p.12-18, 1999.
Peng, S.; Huang, J.; Sheehy, J. E.; Laza, R. C.; Visperas, R. M.; Zhong, X.; Centeneo, G. S.; Khush, G. S.; Cassman, K. G. Rice yields decline with higher night temperature from global warming. National Academy of Sciences of the USA, v.101, p.9971-9975, 2004.
Sansígolo, C. A.; Kayano, M. T. Trends of seasonal maximum and minimum temperatures and precipitation on Southern Brazil for the 1913-2006 period. Theoretical and Applied Climatology, v.101, p.209-216, 2010.
SOSBAI - Sociedade Sul Brasileira de Arroz Irrigado. Arroz irrigado: Recomendações técnicas da pesquisa para o Sul do Brasil. Bento Gonçalves: SOSBAI, 2010. 188p.
Streck, N. A. Climate change and agroecosystems: the effect of elevated CO2 and temperature on crop growth, development, and yield. Ciência Rural, v.35, p.730-740, 2005.
Streck, N. A.; Bosco, L.; Michelon, S.; Rosa, H. T. Walter, L. C.; Paula, G. M.; Camera, C.; Lago, I.; Marcolin, E. Avaliação da resposta ao fotoperíodo em genótipos de arroz irrigado. Bragantia, v.65, p.533-541, 2006.
Streck, N. A.; Bosco, L. C.; Lago, I. Simulating leaf appearance in rice. Agronomy Journal, v.100, p.490-501, 2008a.
Streck, N. A.; Bosco, L.; Lucas, D. D. P.; Lago, I. Modelagem da emissão de folhas em arroz cultivado e em arroz-vermelho. Pesquisa Agropecuária Brasileira, v.43, p.559-567, 2008b.
Streck, N. A.; Lago, I.; Bosco, L.; Paula, G. M.; Oliveira, F. B.; Gabriel, L. F.; Schwantes, A. P. Relationship between panicle differentiation and main stem leaf number in rice genotypes and red rice biotypes. Scientia Agricola, v.66, p.195-203, 2009.
Streck, N. A.; Michelon, S.; Kruse, N. D.; Bosco, L. C.; Lago, I.; Marcolin, E.; Paula, G. M. de; Samboranha, F. K. Comparação de parâmetros de crescimento e de desenvolvimento de dois biótipos de arroz vermelho com genótipos de arroz irrigado. Bragantia, v.67, p.349-360, 2008c.
USDA - United States Department of Agriculture. Production, supply and distribution online: Custom query. 2009. <http://www.fas.usda.gov/psdonline/psdQuery.aspx>. 8 Aug. 2010.
Vaughan, L. K.; Ottis, B. V.; Havey, A. M. P.; Bormans, C. A.; Sneller, C.; Chandler, J. M.; Park, W. D. Is all red rice found in commercial rice Oryza sativa? Weed Science, v.49, p.468-476, 2001.
Vose, R. S.; Easterling, D. R.; Gleason, B. Maximum and minimum temperature trends for the globe: An uptade through 2004. Geophysical Research Letters, v.32, L23822, 2005.
Walter, L. C.; Rosa, H. T.; Streck, N. A. Simulação do rendimento de grãos de arroz irrigado em cenários de mudanças climáticas. Pesquisa Agropecuária Brasileira, v.45, p.1237-1245, 2010.
Wang, E.; Engel, T. Simulation of phenological development of wheat crops. Agricultural Systems, v.58, p.1-24, 1998. Weiss, A.; Hays, C. J.; Won, J. Assessing winter wheat response
to climate change scenarios: a simulation study in the U.S. Great Plains. Climatic Change, v.58, p.119-147, 2003. Ziska, L. H.; McClung, A. Differential response of cultivated