Acid Composition of Broiler Abdominal Fat
Pilar Teresa Garcia. ITA CAI INTA CC 77 BB1708WAB MORON Provincia de Buenos Aires, Argentina Phone: +54 11 4629 1216 Fax: +54 11 4629 1216
E-mail: [email protected] Mail Address
Keywords
Abdominal fatty acids, carcass composition, PUFA.
Rondelli SG1,3
Martinez O1
García PT2
1 Universidad Nacional de Lujan (Bs. As.
-Argentina).
2 Instituto de Tecnología de Alimentos
Centro de Investigaciones de Agroindustria, INTA Bs As Argentina.
3 Thiswork is part of a doctoral thesis.
Author(s)
Arrived: june / 2004 Approved: september / 2004
ABSTRACT
The effect of three different lipid sources (soybean oil, chicken oil or bovine fat) on the abdominal fat fatty acid composition in 50 day-old broiler chickens was evaluated. A completely randomized design was used, with 4 treatments, 8 repetitions and 40 Arbor Acres broiler chicks of each sex. The four treatments were isocaloric and isoproteic with the following characteristics: T1 Control (Soybean-corn); T2 Control + 3% soybean oil; T3 Control + 3% chicken oil; and T4 Control + 3% bovine fat. The lipids from the diets had significantly statistical effects (p<0,05) on the fatty acid composition of broiler abdominal fat. Multivariate techniques also showed differences in fatty acid composition within treatments due to sex. The studied dietary lipids affected the polyunsaturated/saturated fatty acid ratio (P/S) but had only small effects on the n-6: n-3 fatty acid ratio.
INTRODUCTION
An increasing supplementation of diets with lipids from oilseeds for intensive poultry production has been observed. These contain predominantly n-6 PUFAs and, consequently, poultry lipids have comprised higher levels of such fatty acids and lower levels of n-3 PUFAs. With the generally very high n-6: n-3 ratios seen in these diets, chain elongation of any existing small amounts of linolenic acid would be unlikely. Current evidences point to an n-6:n-3 fatty acid ratio of around 5:1 as being optimal. Linolenic acid (18:3 n-3) is important, but long chain EPA (20:5 n-3) and DHA (22:6 n-3) are the most effective. When the ratio n-6:n-3 is above 5:1, the effectiveness of linolenic acid is further reduced (British Nutrition Foundation, 1992).
In recent years, besides the technological aspects related to the susceptibility of meats to oxidation, the effects of dietary fat sources with different degrees of unsaturation and double bond positioning on the lipid composition of meat are specially considered.
Chicken lipids are a good source of essential n-6 fatty acids for humans but generally have high n-6/n-3 fatty acid ratio. Decreasing this ratio could be one desirable aspect in poultry lipids. Ruminant fats are one of the few lipid sources poor in n-6 and their inclusion in poultry diets could contribute to lower the concentrations of n-6 in poultry lipids.
Fat inclusion in broiler diets affects carcass fat quality because dietary fatty acids are incorporated with little change into the bird body fats (Scaife et al., 1994). Thus, the type of fat used in the feed influence the
composition of broiler body lipids. Abdominal fat is a good indicator of chicken body fats because it is very sensitive to changes in dietary fatty acid composition (Yau et al., 1991; Pinchasov & Nir, 1992; Saenz et al.,
The purpose of this experiment was to analyse the effect of three different dietary fat sources, soybean oil, chicken oil or bovine fat, on the abdominal fat fatty acid composition of male and female broiler chickens.
MATERIALS AND METHODS
A total of 2,000 birds aged four weeks were used as experimental animals. The tails were discarded according to a live weight curve of normal distribution. A completely randomized design of 4 treatments, with 8 repetitions and 40 Arbor Acres broiler chicks of each sex was used. The four treatments were isocaloric and isoproteic with the following characteristics:
T1 Control (Soybean-corn); T2 Control + 3% soybean oil; T3 Control + 3% chicken oil; and T4 Control+ 3% bovine fat.
The composition of the diets and the fatty acid composition of supplemented lipids are shown in Tables 1 (A&B) and 2, respectively. When the birds were 50 days old, two males and two females were taken at random from each repetition for abdominal fat analysis, resulting in a total of 16 birds per treatment. To assess carcass composition, two males from each repetition were randomly chosen. Total abdominal fat was weighed, carefully minced, and aliquot samples were extracted with chloroform. Crude lipids were purified using TLC (hexane:ethyl ether:acetic acid 80:20:1 v/v/ v) and the triglyceride fraction converted to methyl-esters and analysed by GLC (gas liquid chromatography). Fatty acid composition was determined using a 50 m CP Sil 88 capillary column with an inner diameter of 0.25 mm and 0.20 µm film thickness. (Chrompack, Middelburg, the Netherlands).
Data were statistically analysed using one-way ANOVA, and means with significant F ratio were compared by Tukeys multiple range test. Multivariate techniques such as factor analysis and linear discriminant analysis were performed by means of the statistical software SYSTAT version 6.1 (1996).
RESULTS AND DISCUSSION
No differences (p>0.05) were detected in carcass composition and abdominal fat weight due to treatment (Table 3). These results were as expected and similar to the reported by other authors (Hrdinka et al., 1996).
Concentrations of all fatty acids were significantly different (p<0.05) among treatments, showing the
importance of dietary lipids in poultry lipid composition (Table 4). The differences were important, and for some fatty acids the changes were higher than 50%.
Table 1 A Composition of diets (22 to 35 days).
Ingredients (g/kg) T1 T2 T3T4
Maize grain 593.2 430.0 418.9 413.8 Soybean meal 199.4 69.1 120.1 118.0 Soybean grain 114.0 226.9 227.8 229.0
Fat 3.0 3.0 3.0
Gluten meal 26.9 3.0 4.4
Wheat starch 60.0 60.0 60.0 60.0 Meat meal 20.0 20.0 20.0 20.0
DL-methionine 1.9 6.4 2.0 2.0
Sodium chloride 3.0 3.0 3.0 3.0 Dicalcium phosphate 1.2 1.7 1.7 Vitamin*
Calculated composition (per kg)
Protein, g196.0 196.0 196.0 196.0
Fat, g50.0 64.0 64.0 64.0
Lysine, g11.4 11.0 11.0 10.5
Methionine, g5.1 5.1 5.1 5.1
Methionine plus cystine, g8.3 8.3 8.3 8.3 Metabolizable energy (MJ) 12.7 12.7 12.7 12.7 * Vitamin and mineral mixture supplying (mg/kg): 3.3 retinol, 0.13 cholecalciferol, 50 dl-tocopheryl acetate, 3 menadione, 2 thiamine, 6 riboflavin, 3 pyridoxine, 0.01 cyanocobalamin, 1.75 folic acid, 0.2 biotin, 1000 choline chloride, 70 niacin, 20 calcium pantothenate, 100 Mn, 80 Zn, 80 Fe, 8 Cu, 15 Se, 160 Na, 400 K, 160-220 choride, 100 Mn, 1 Mo.
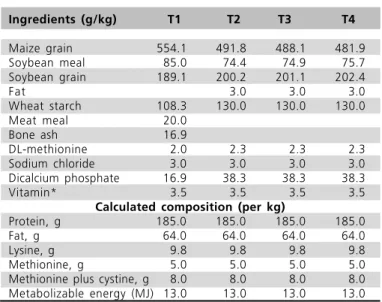
Table 1 B Composition of diets (36 to 49 days).
Ingredients (g/kg) T1 T2 T3T4
Maize grain 554.1 491.8 488.1 481.9 Soybean meal 85.0 74.4 74.9 75.7 Soybean grain 189.1 200.2 201.1 202.4
Fat 3.0 3.0 3.0
Wheat starch 108.3 130.0 130.0 130.0 Meat meal 20.0
Bone ash 16.9
DL-methionine 2.0 2.3 2.3 2.3
Sodium chloride 3.0 3.0 3.0 3.0 Dicalcium phosphate 16.9 38.3 38.3 38.3
Vitamin* 3.5 3.5 3.5 3.5
Calculated composition (per kg)
Protein, g185.0 185.0 185.0 185.0
Fat, g64.0 64.0 64.0 64.0
Lysine, g9.8 9.8 9.8 9.8
Methionine, g5.0 5.0 5.0 5.0
Methionine plus cystine, g8.0 8.0 8.0 8.0 Metabolizable energy (MJ) 13.0 13.0 13.0 13.0 * Vitamin and mineral mixture supplying (mg /kg ): 3.3 retinol, 0.1 cholecalciferol, 50 dl-tocopheryl acetate, 2 menadione, 2 thiamine, 5 riboflavin, 2 pyridoxine, 0.01 cyanocobalamin, 1.5 folic acid, 0.05 biotin, 1000 choline chloride, 40 niacin, 20 calcium pantothenate, 100 Mn, 60 Zn, 80 Fe, 8 Cu, 15 Se, 160 Na, 400 K, 160-220 choride, 100 Mn, 1 Mo.
showed differences due to sex. Classification based on fatty acid composition was performed and the factor loading matrix obtained for the three factors and the variance explained by each of them are presented in Table 6. These three factors accounted for 92% of the total variability. Linear discriminant analysis showed a percentage correctly classified between 75 and 100% (Table 7) These results differ from the results of a previous study that has reported no effect of chicken sex on abdominal fat fatty acid patterns (Olumo & Baracos, 1991).
The incorporation of soybean oil produced the smallest changes in fatty acid composition (Table 4). Dietary soybean oil decreases the percentages of
Table 3 Carcass composition. Values represent mean±SD.
T1 T2 T3T4
Carcass, g3215±147a 3198±121a 3230±172a 3224±194a
Carcass, % live-weight 67.0±2.54a 67.0±1.96a 66.9±3.96a 66.5±2.13a
Breast without bones % live-weight 14.7±0.78a 15.3±1.23a 15.0±1.07a 14.9±0.82a
Leg and thigh, % live-weight 20.4±1.75a 20.1±0.68a 20.9±1.23a 20.9±0.57a
Abdominal fat, % live-weight 2.3±0.29a 2.1±0.40a 2.2±0.47a 2.2±0.30a
a Similar superscripts in the row indicate non-significant differences (p >0.05).
Table 4 Fatty acid composition of abdominal fat (% total fatty acids). Male (M), female (F). Values represent mean ± SD.
Fatty acid T1 T2 T 3T 4
14:0 M 0.4±0.04a 0.4±0.09a 0.6±0.07b 1.1±0.09c
F 0.5±0.07a 0.5±0.03a 0.6±0.06b 1.0±0.06c
15:0 M 0.2±0.03a 0.2±0.06a 0.2±0.05a 0.5±0.05b
F 0.2±0.01a 0.2±0.07a 0.3±0.04b 0.4±0.05c
16:0 M 21.8±1.01a 22.5±0.74a,b 23.3±1.15b 23.4±0.86b
F 21.8±1.60a 21.7±0.79a 22.8±1.35a,b 23.2±0.56b
16:1 M 3.8±0.77a 5.9±0.91b 5.1±0.29b 5.2±0.76b
F 4.3±0.59a 6.5±0.93b 5.9±0.61b,d 5.5±0.56c,d
18:0 M 6.0±0.65a 5.9±0.91a 5.9±0.61a 6.9±0.98b
F 5.8±0.47a 6.5±0.93a.c 5.9±0.74a 6.9±0.58b,c
18:1 M 38.4±0.93a 40.6±1.81b 42.7±1.14c 45.0±1.01d
F 37.8±0.93c 40.9±1.68c 42.8±1.34c 45.9±1.09d
18:2 M 26.8±1.88a 23.8±2.03b 20.7±0.93c 16.4±1.10d
F 26.2±1.93a 24.7±2.28b 20.8±1.30c 15.91.23d
18:3 M 2.4±0.22a 2.1±0.18b 1.6±0.14c 1.4±0.13d
F 2.3±0.15a 2.1±0.21b 1.6±0.13c 1.3±0.15d
a b c d - Similar superscripts in the row indicate non-significant differences (p > 0.05).
Table 5 Abdominal fat data of nutritional and technological interest.
T1 T2 T3T4
14:0+16:0 M 22.3±1.04a 22.9±0.77a,c 23.9±1.18b,c 24.4±0.82b
F 22.3±1.66a 22.2±0.78a,c 23.4±1.34c,d 24.2±0.53d
14:0+16:0+18:0 M 28.3±1.06a 28.8±1.30a,c 29.8±1.51a,b 31.3±1.50b
F 28.1±1.52a 28.7±1.30a 29.3±1.61a,b 31.0±0.98b
18:2:18:3 M 11.4±0.65a 11.2±0.35a 13.3±1.23b 12.1±0.85a,b
F 11.3±0.57a 12.0±0.72a,c 12.8±0.57b 12.2±0.56b,c
P/S M 1.03±0.10a 0.91±0.09b 0.75±0.06c 0.57±0.05d
F 1.02±0.12a 0.93±0.11b 0.77±0.08c 0.56±0.04d
MUFA M 42.3±1.63 44.9±2.23 47.8±1.19 50.2±1.55
F 43.0±1.19 44.8±2.00 48.0±1.44 51.4±1.16
(MUFA+PUFA) / SFA 2.52±0.13 2.49±0.15 2.35±0.16 2.17±0.15
F 2.55±0.19 2.49±0.16 2.40±0.19 2.21±0.10
a b c d - Similar superscripts in the row indicate non-significant differences (p > 0.05). Table 2 Fatty acid composition of the three lipid sources.
Fatty acid % Soybean oil Chicken oil Bovine fat
14:0 0.1 0.7 2.2
16:0 11.9 25.1 29.2
16:1 0.1 6.1 5.3
18:0 4.6 4.8 12.2
18:1 21.5 41.8 36.2
18:2 54.7 19.4 7.4
18:3 7.2 1.6 5.3
SFA1 16.6 30.6 43.6
MUFA2 21.6 47.9 41.5
PUFA3 61.9 21.0 12.7
(MUFA+PUFA)/SFA 5.0 2.3 1.2
PUFA/SFA 3.7 0.7 0.3
n-6/n-3 7.6 12.1 1.4
Table 7 Classification matrix of samples from linear discrimi-nant analysis of abdominal fat fatty acids. Male (M), Female (F).
T1 M T1 F T2 M T2 F T3 M T3 F T4 M T4 F% correct
T1 M 7 1 0 0 0 0 0 0 88
T1 F 1 7 0 0 0 0 0 0 88
T2 M 2 1 4 1 0 0 0 0 50
T2 F 2 0 0 5 0 1 0 0 79
T3 M 0 0 0 0 8 0 0 0 100
T3 F 0 0 0 0 1 7 0 0 88
T4 M 0 0 0 0 0 0 6 2 75
T4 F 0 0 0 0 0 0 1 7 88
Total 12 9 4 6 9 8 7 9 80
should be less than 4. (Department of Health and Social Security, 1994).
From a technological point of view, the differences in total SFA and (MUFA+PUFA)/SFA were very important (Table 5). Several researchers consider that they represent the best estimation of both the slip point and the clarification point for poultry adipose tissues (Hrdinka et al., 1996).
The present paper shows that the two animal fats used were effective in decreasing linoleic acid, but it is necessary to increase linolenic acid through other dietary components to fulfil present nutritional requirements.
The human diet and that of intensively reared animals have become unbalanced in terms of the make-up of fat. The intake of n-6 polyunsaturated fatty acids (n-6 PUFAs) must be decreased, whereas n-3 intake must be increased. Bovine fats, with naturally low levels of linoleic acid, can effectively decrease the concentrations of this fatty acid in poultry lipids, but it is necessary to supplement with a good source of linolenic acid to reduce the n-6: n-3 ratio in broiler lipids.
CONCLUSIONS
Dietary fat composition affected significantly p<0.05) the concentrations of all fatty acids in broiler abdominal fat. Such differences were important, and the changes were higher than 50% for some fatty acids. The application of a multivariate analysis also showed differences due to sex.
Bovine fat had the most important effects and increased significantly (p<0.05) 14:0, 15:0, 16:0, 16:1, 18:0 and 18:1 and decreased 18:2 and 18:3 fatty acids. The incorporation of soybean oil produced the smallest changes in fatty acid composition, whereas chicken 18:2 and 18:3 and increases the percentages of 16:1
and 18:1 when compared with the control treatment. Changes due to dietary chicken oil were lower but quite similar to the bovine fat. Dietary chicken oil increased the percentages of 14:0, 16:0, 16:1 and 18:1 and decreased the percentages of 18:2 and 18:3 % compared with the control treatment.
Bovine fat had the most important effects and increased significantly 14:0, 15:0, 16:0, 16:1, 18:0 and 18:1, while 18:2 and 18:3 decreased compared with the control, T2 and T3.
Table 5 shows some data of nutritional and technological interest. The three dietary fats significantly decreased (p<0.05) the P/S ratio, but effects on the n-6/n-3 ratio were small. N-6/n-3 ratios were lower in T1 and T2 compared with T3 and T4. P/S ratios were statistically different among the four treatments. Major nutritional recommendations have indicated to decrease fat intake to a mean level of 30% and to decrease the intake of saturated fatty acids to 10% or less. The ratio of polyunsaturated to saturated fatty acids (P/S) should be between 0.4 and 1.0, and the n-6:n-3 ratio
Table 6 Factor loading, and explained and cumulative variance1.
Fatty acids Factor 1 Factor 2 Factor 3
14:0 0.886 0.246 0.189
15:0 0.858 0.189 0.282
16:0 0.640 -0.237 -0.711
16:1 0.754 -0.61 0.079
18:0 0.351 0.895 -0.236
18:1 0.897 -0.52 0.221
18:2 -0.983 0.029 0.054
18:3 -0.944 0.008 0.081
Variance explained for components 5.285 1.329 0.741
Cumulative % of total variance explained 66.0 82.7 91.9
oil changes were lower but quite similar to bovine fat changes.
The three dietary fats significantly decreased (p<0.05) the P/S ratio compared with the control. Effects on the n-6/n-3 ratio were small in spite of the big differences in 18:3 and 18:2 fatty acid concentrations between diets and abdominal fats.
The present study shows that the two animal fats used were effective in decreasing percentages of linoleic acid, but it is necessary to increase linolenic acid through other dietary components to fulfil present nutritional requirements for the n-6/n-3 fatty acid ratio.
REFERENCES
British Nutrition Foundation. Unsaturated fatty acid: Nutritional and physiological significance. London(UK): Chapman & Hall; 1992.
Department of Health and Social Security. Nutritional aspects of cardiovascular disease. London(UK): HMSO, 1994. (Report on Health and Social Subjects, n.46).
Hrdinka C, Zollitsch W, Knaus W, Lettttner F. Effects of dietary fatty acid pattern on melting point and composition of adipose tissues and intramuscular fat of broiler carcasses. Poultry Science 1996; 75: 208-215.
Olomu JM, Baraco VE. Influence of dietary flaxseed oil on the performance, muscle protein deposition and fatty acid composition of broiler chicks. Poultry Science 1991; 70:1403-1411.
Pinchasov Y, Nir I. Effect of dietary polyunsaturated fatty acid concentration on performance, fat deposition and carcass fatty acid composition in broiler chickens. Poultry Science 1992; 71: 1504-1512.
Saenz M, Flores A, Lopez-Bote J. Effect of fatty acid saturation in broiler diets on abdominal fat and breast muscle fatty acid composition and susceptibility to lipid oxidation. Poultry Science 1999; 78:378-382.
Scaife JR, Moyo J, Galbraith M, Michie M, Campbell V. Effect of different dietary supplemental fats and oils on the tissue fatty acid composition and growth of female broilers. British Poultry Science 1994; 35:107-118.
SYSTAT version 6.1. Chicago(IL.): SPSS; 1996.