PAGAMUNICI, L.M. et al.
270
DEVELOPMENT, CHARACTERIZATION AND CHEMOMETRIC
ANALYSIS OF A GLUTEN-FREE FOOD BAR CONTAINING
WHOLE FLOUR FROM A NEW CULTIVAR OF AMARANTH
Desenvolvimento, caracterização e análise quimiométrica de barra alimentícia
sem glúten contendo farinha de um novo cultivar de amaranto
Lilian Maria Pagamunici1, Aloisio Henrique Pereira Souza1, Aline Kirie Gohara1, Nilson Evelázio Souza1, Sandra Terezinha Marques Gomes2, Makoto Matsushita3
ABSTRACT
Food bars are consumed heavily, especially because of their practicality; however they cannot be ingested by celiac patients and present low contents of essential nutrients. The goal of this study was the development and physical-chemical, nutritional and sensory evaluation of a gluten-free food bar containing amaranth and linseed. Gluten fractions were not detected in the food bar formulations. Crude protein and total lipid contents ranged from 68.32 to 76.60 and 74.56 to 82.06 g kg-1 of food, respectively. The
polyunsaturated/saturated and n-6:n-3 fatty acid ratios ranged from 0.45:1 to 0.55:1 and 1.44:1 to 2.50:1, respectively. Calcium, magnesium, copper, iron, manganese and zinc were the principal minerals. Application of multivariate analysis enabled sample B to be distinguished according to its mineral and alfa-linolenic acid content. All food bar formulations had good sensory acceptance and high purchase intent.
Index terms: Principal component analysis, pseudo-cereals, linseed, fatty acids.
RESUMO
Barras alimentícias são muito consumidas, especialmente por sua praticidade; no entanto apresentam baixos teores de nutrientes essenciais e, em sua maioria, não podem ser ingeridas por pessoas celíacas. O objetivo deste estudo foi o desenvolvimento, avaliação físico-química, nutricional e sensorial de barras alimentícias sem glúten contendo amaranto e linhaça. As barras alimentícias formuladas não apresentaram frações de glúten. Os teores de proteína bruta e lipídios totais variaram entre 68,32-76,60 e 74,56-82,06 g kg-1 de alimento, respectivamente. As razões entre ácidos graxos poli-insaturados/
saturados e n-6:n-3 variaram de 0,45:1 para 0,55:1 e 1,44:1 para 2,50:1, respectivamente. Os principais minerais foram o cálcio, magnésio, cobre, ferro, manganês e zinco. Aplicação de análise multivariada permitiu diferenciar a amostra B das demais em relação ao seu conteúdo mineral e teor de ácido alfa-linolênico. Todas as barras formuladas tiveram boa aceitação sensorial e intenção de compra elevada.
Termos para indexação: Análise de componentes principais, pseudocereal, linhaça, ácido graxo.
1Universidade Estadual de Maringá/UEM – Maringá – PR – Brasil
2Universidade Tecnológica Federal do Paraná/UTFPR – Londrina – PR – Brasil
3Universidade Estadual de Maringá/UEM – Departamento de Química – Avenida Colombo – n. 5790 – 87020 -900 – Maringá – Paraná – Brasil – mmakoto@uem.br
Received in september 30, 2013 and approved in april 8, 2014
INTRODUCTION
Celiac disease, intolerance to the intake of gluten protein, arises from its resistance to digestive enzymes and affects genetically predisposed individuals by
triggering an inflammatory response (Arendt et al., 2008).
The amaranth (Amaranthus spp.) from the Andean region
is classified as a pseudo-cereal. Cultivar Amaranthus cruentus BRS Alegria was genetically modified for central-western Brazil climate conditions and to remove saponins while still maintaining its chemical composition
(Spehar et al., 2003). Levels of 20.92% crude protein, 64.80% carbohydrate, 8.68% total lipids and 3.42%
minerals, respectively, have been reported for this
cultivar of amaranth (Palombini et al., 2013). Levels of
12.2–13.8% crude protein, 67.4–69.2% carbohydrate, 9.7–12.9% dietary fiber, 5.0–6.3% total lipids and 2.5–3.4% minerals, respectively, have been reported for amaranth (Arendt et al., 2008; Gutiérrez et al.,
2010). The linseed (Linum usitatissimum L.), high
levels of crude fiber and total lipids, 8.3 and 43.9%, respectively, are also found in linseed (Gutiérrez et al., 2010). Food bars or cereal bars normally have high contents of soluble and insoluble fibers, lipids and carbohydrates, but low protein content, thus being an
energy source (Mahanna; Lee, 2010). The goal of this
MATERIAL AND METHODS
Sampling and formulations
The grains of A. cruentus BRS Alegria were provided by Embrapa. The other ingredients were
purchased from local shops in Maringá, Paraná state. The food bar formulations (Table 1) consisted of a binder phase (syrup) and a solid phase (grains, nuts and raisins). The
binder phase was heated under stirring and the soluble
sugar content was measured until it reached 85–89ºBrix on a digital refractometer (Leica Microsystems Inc., USA).
The phases were mixed and pressed to obtain a form with
dimensions 90 mm X 30 mm X 15 mm weighing 25 g.
These bars were then covered with melted chocolate
(0.1–0.2mm thickness).
Fatty acid composition, mineral quantification and chemical analysis
The moisture, ash and crude protein contents were
determined according to Cunniff (1998) using a factor of 5.80 (Arendt et al., 2008 ; Palombini, 2013) to convert the percentage of nitrogen into crude protein content. The total lipids were determined according to Bligh and
Dyer (1959).
To determine the fatty acid composition, the lipids were converted into fatty acid methyl esters
(FAME) and methylated according to Hartman and Lago (1973). The FAME were separated in a gas chromatograph CP-3380 (Varian, USA) fitted with a flame ionization detector and a CP 7420-select Fame fused-silica capillary column (100 m x 0.25 mm x 0.25 µm cyanopropyl). The gas flows were 1.4 mL min-1
carrier gas hydrogen, 30 mL min-1 make-up gas nitrogen,
300 mL min-1 synthetic air and 30 mL min-1 flame gas hydrogen; the sample was injected in a split ratio of 1:100. The injector and detector temperatures were both 235 °C. The column temperature was maintained at 165 °C for 4 min, then increased 4 °C min-1 to 185
°C and maintained for 5 min, then raised to 225 ºC at
10 °C min-1 and maintained for another 10 min. (Souza et al., 2013). The retention times were compared to
those of standard methyl esters (Sigma, USA). The fatty acids were identified using tricosanoic acid methyl ester (Sigma, USA) as an internal standard, following Joseph and Ackman (1992). The peak areas were determined with Star 5.0 software (Varian, USA) and
the concentrations were expressed in mg kg-1 of food. For the mineral composition analysis, the samples were digested by the dry method (AOAC, 1995) and Ca,
Cu, Fe, Mg, Mn and Zn were quantified in an atomic absorption spectrophotometer AA240FS (Varian, USA) as
mg of mineral per kg of product using standard solutions and analytical curves.
Indices of the nutritional quality of lipids and gluten test
The gluten fractions in the final products were determined using a commercial ELISA kit
(Enzyme-linked immunosorbent assay)-R5 Ridascreen® Gliadin
(R-Biopharm, Germany), a Sunrise spectrophotometer (Tecan, Switzerland) at 450 nm, and Rida-Win software (R-Biofarm, Germany). The limits of detection and quantification of the method were 1.50 ng gliadin mL-1 (or
3.00 ng gluten mL-1) and 2.50 ng gliadin mL-1 (or 5.00 ng
gluten mL-1), respectively, with a sensitivity greater than 2.00 mg gluten 100 g-1 of food, as recommended by the
Codex Food Commission (1983).
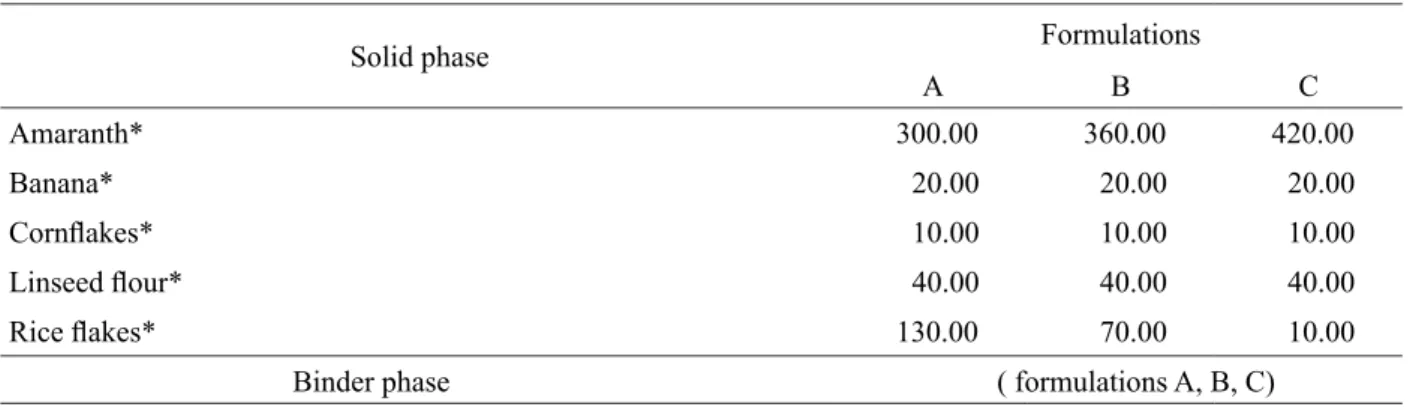
Table 1 – Food bar formulations.
Solid phase Formulations
A B C
Amaranth* 300.00 360.00 420.00
Banana* 20.00 20.00 20.00
Cornflakes* 10.00 10.00 10.00
Linseed flour* 40.00 40.00 40.00
Rice flakes* 130.00 70.00 10.00
Binder phase ( formulations A, B, C)
Brown sugar* 100.00, Canola oil* 10.00, Glucose syrup* 200.00, Honey* 100.00, Invert sugar* 30.00, Water* 60.00.
PAGAMUNICI, L.M. et al. A better approach to the nutritional evaluation of fat
is utilization of indices based on the functional effects of fatty acid composition. These indices were available as the
index of atherogenicity (IA) = [(12:0 + (4 x 14:0) + 16:0)] / (ΣMUFA + Σn-6 +Σn-3), and index of thrombogenicity (IT) = (14:0 + 16:0 + 18:0) / [(0.5 x ΣMUFA) + (0.5 x Σn-6) + (3 x Σn-3) + (Σn-3/Σn-6)], by Ulbricht and Southgate (1991), as well as the hypocholesterolemic/ hypercholesterolemic fatty acid ratio (HH) = (18:1n-9 + 18:2n-6 + 20:4n-6 + 18:3n-3 + 20:5n-3 + 22:5n-3 + 22:6n-3) / (14:0 +16:0), according to Santos-Silva, Bessa and Santos-Silva (2002).
Ethical aspects and sensory analysis
A group of 80 untrained volunteer panelists and potential consumers of the products developed participated in the sensory analysis, which consisted of acceptance testing, preference ordering and intent of
purchase of the formulations developed. In the acceptance test, appearance, flavor, texture, crispness and overall acceptance of the food bar were assessed using a 9-point hedonic scale (1 = extremely dislike to 9 = extremely
like). The samples were presented in random complete
blocks for comparison. The index of acceptability (IA) of the products was calculated as (global aspect grade x 100%) / 9, where nine was the maximum score on the hedonic scale. The lowest IA value for considering the products well accepted by the consumers was 70%.
The ordering test assessed the preference for each formulation; the results were obtained by summing the order values of each sample. The purchase intent test
was determined using a 5-point scale (1 = definitely would not buy and 5 = definitely would buy) (Lawless; Heymann, 2010).
The sensory testing in this study was approved by
the Standing Committee on Ethics in Research Involving Human Beings of Maringá State University, CAAE File No. 0433.0.093.000-10.
Statistical analysis
Fatty acid composition, mineral, instrumental and physical-chemical analyses were carried out in triplicate. The results were submitted to variance analysis
(ANOVA) and the means were compared using Tukey’s post hoc. Friedman’s test was used only for the Preference Ordering test, according to Lawless and Heymann (2010).
The multivariate analysis was performed by applying
Principal Component Analysis (PCA). The average of
three individual batches was used with respect to the sums and ratios of fatty acids, mineral composition and sensory
attributes. The averages were autoscaled using NIPALS
algorithm. The statistical software SAS, version 7.0, was
used with a 5% (p < 0.05) significance level for rejection
of the null hypothesis.
RESULTS AND DISCUSSION
Gluten fractions were not detected by the ELISA
test in either the grains or the gluten-free food bar formulations developed, corroborating studies that have shown the absence of gluten in other varieties of the
same species of grains (Alvarez-Jubete et al., 2010). The results of the physical-chemical analyses are shown in
table 2. The crude protein content showed significant differences (p <0.05) because it increased progressively
and proportionally with increasing grain concentrations in the food bar formulations, corroborating studies
accomplished by Enriquez et al. (2003).
According to Brasil, (1998) the food bars can be
considered a “source of protein” because they presented
10% of the DRI (Recomended Daily Intake) for adults (50 g day-1) in 100 g of product. According to Gutierrez et
al. (2010), linseed has a mineral content of 2.66%, while pseudo-cereals have approximately 3% (Palombini et al.,
2013), which contributed to the high mineral content of the
products developed. There was a difference (p < 0.05) in
total lipids between the samples. The food bar formulations
Table 2 – Moisture, ash, crude protein and total lipid contents of food bar formulations.
Parameters (wet basis) Formulations
A B C
Moisture (g 100g-1) 9.58a±0.02 8.94b±0.07 8.84b±0.11
Ash (g 100g-1) 1.34c±0.03 1.35b±0.04 1.37a±0.06
Crude protein (g 100g-1) 6.83b±0.09 6.87b±0.08 7.66a±0.05
presented proximal composition and percent energy
similar to those of Freitas and Moretti (2006), Souza et. al. (2014) and (Pagamunici et al., 2014).
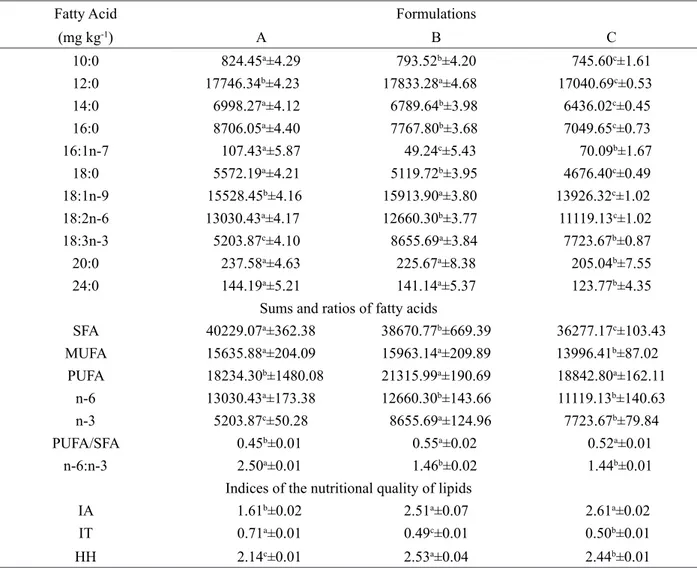
Table 3 presents thrombogenicity and atherogenicity
indices. The major ratios HH and PUFA:SFA (Table 3) are
important due to their hypocholesterolemic effect and the prevalence of polyunsaturated fatty acids are related to
lowered risk of cardiovascular disease (Ratnayake; Galli, 2009). The saturated fatty acid contents of food bars A, B and C were 4.02, 3.87 and 3.63%, respectively (Table 3).
Excessive consumption of lipids and an unbalanced n-6:n-3 ratio are related to a higher frequency of myocardial
infarction cases, hypercholesterolemia, increased low
density lipoprotein (LDL) cholesterol and blood pressure,
atheroma, lipid disorders and other disorders. The n-6:n-3 ratio of the food bars ranged from 1.4:1 to 2.5:1, which is
near the ideal value of 1:1 (Simopoulos, 2011). These fatty
acids ratios and indexes were similar to those reported by
Souza el al. (2014).
As shown in table 4, the major mineral component
was Mg and Ca for all the formulations. The first
plays a vital role in a wide range of biochemical and physiological processes and the presence of calcium in the diet contributes to increasing the bioavailability
Table 3 – Absolute quantification of fatty acids in food bar formulations.
Fatty Acid Formulations
(mg kg-1) A B C
10:0 824.45a±4.29 793.52b±4.20 745.60c±1.61
12:0 17746.34b±4.23 17833.28a±4.68 17040.69c±0.53
14:0 6998.27a±4.12 6789.64b±3.98 6436.02c±0.45
16:0 8706.05a±4.40 7767.80b±3.68 7049.65c±0.73
16:1n-7 107.43a±5.87 49.24c±5.43 70.09b±1.67
18:0 5572.19a±4.21 5119.72b±3.95 4676.40c±0.49
18:1n-9 15528.45b±4.16 15913.90a±3.80 13926.32c±1.02
18:2n-6 13030.43a±4.17 12660.30b±3.77 11119.13c±1.02
18:3n-3 5203.87c±4.10 8655.69a±3.84 7723.67b±0.87
20:0 237.58a±4.63 225.67a±8.38 205.04b±7.55
24:0 144.19a±5.21 141.14a±5.37 123.77b±4.35 Sums and ratios of fatty acids
SFA 40229.07a±362.38 38670.77b±669.39 36277.17c±103.43
MUFA 15635.88a±204.09 15963.14a±209.89 13996.41b±87.02
PUFA 18234.30b±1480.08 21315.99a±190.69 18842.80a±162.11
n-6 13030.43a±173.38 12660.30b±143.66 11119.13b±140.63
n-3 5203.87c±50.28 8655.69a±124.96 7723.67b±79.84
PUFA/SFA 0.45b±0.01 0.55a±0.02 0.52a±0.01
n-6:n-3 2.50a±0.01 1.46b±0.02 1.44b±0.01
Indices of the nutritional quality of lipids
IA 1.61b±0.02 2.51a±0.07 2.61a±0.02
IT 0.71a±0.01 0.49c±0.01 0.50b±0.01
HH 2.14c±0.01 2.53a±0.04 2.44b±0.01
PAGAMUNICI, L.M. et al.
Table 4 – Mineral composition of food bar formulations.
Mineral (mg kg-1 of sample)
Formulations
A B C
Ca 2606.97a±86.76 2648.20a±85.33 2380.11b±47.71
Cu 27.46a±0.13 26.85a±2.74 23.74b±0.96
Fe 115.61b±5.91 127.48a±5.77 124.43a±10.98
Mg 2801.95b±521.35 3001.86a±128.22 2594.19c±170.89
Mn 38.77b±3.73 41.05a±0.90 40.04a±0.52
Zn 53.43b±6.57 67.64a±1.67 54.43b±1.73
Means followed by the same letters in rows do not differ by Tukey’s test (p < 0.05). and absorption of Mg, Mn and Zn. The content of the
trace mineral Zn in the samples varied significantly (p <
0.05). These minerals are essential for the maintenance of biological systems because they participate as cofactors
in metabolic reactions (Hathcock, 2004). Studies about cookie (Pagamunici et al., 2014), and granola (Souza
et al., 2014) found similar results for mineral contents. Besides, the levels of all minerals were much bigger than the levels found in chocolate cakes using psudocereal
chia (Gohara et al., 2013).
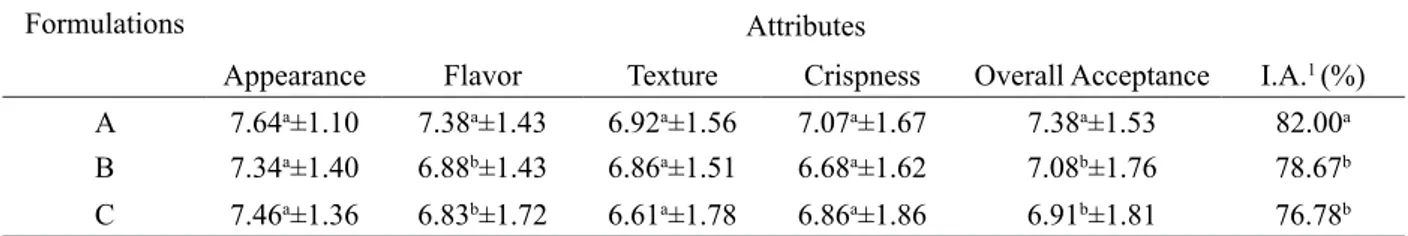
The acceptance test results are shown in table 5. The
attributes flavor and acceptance ranged from slightly liked to moderately liked with a significant difference (p < 0.05).
The food bars were considered well accepted when the
acceptance rate was above 70%, as proposed by Lawless and Heymann (2010). The formulations showed no differences (p < 0.05) in preference ordering by the Friedman’s test. As
to the purchase intent results, ranging from probably buy to surely buy, the consumption potentials of the gluten-free
food bars were above 85% for all the formulations.
Figures 1, 2 and 3 show the principal component
analysis (PCA). The NIPALNS algorithm enabled selection of PC1, PC2 and PC3, which were significant (p < 0.05) and explained 99.67, 89.81 and 99.87% of
the data variance, respectively, in fatty acids/nutritional indices, mineral and sensory attributes. Figure 1A on PC1 enabled formulation A to be distinguished due to
the positive contributions of SFA, MUFA, n-6, n-6:n-3 and IT. By analyzing PC2 and PC3 (Figures 1A and 1B),
formulation C obtained positive contributions in the sums
of SFA, MUFA and n-6, and in the PUFA:SFA ratio, which
was different from the others.
As shown in figure 2A, all minerals made a positive
contribution in PC1, but only copper and iron presented
positive contributions in PC3 (Figure 2B). The minerals Ca and Cu in PC2 (Figure 2A) were responsible for the
differentiation of formulation A.
In a multivariate analysis of all sensory attributes, all of them were highly significant in PC1, as shown in
Figure 3A, distinguishing sample A, which recorded the
highest scores for all attributes (Table 5). In PC2 and PC3 (Figures 3A and 3B), respectively, texture and flavor
attributes made positive contributions to samples B and A.
Although there was no significant difference (p <
0.05) in some of the parameters analyzed, the principal component analysis allowed apparently equal samples
to be distinguished according to loadings (studied parameters) and scores (samples).
Table 5 – Means and standard deviation of acceptance test attributes of food bar formulations.
Formulations Attributes
Appearance Flavor Texture Crispness Overall Acceptance I.A.1 (%)
A 7.64a±1.10 7.38a±1.43 6.92a±1.56 7.07a±1.67 7.38a±1.53 82.00a
B 7.34a±1.40 6.88b±1.43 6.86a±1.51 6.68a±1.62 7.08b±1.76 78.67b
C 7.46a±1.36 6.83b±1.72 6.61a±1.78 6.86a±1.86 6.91b±1.81 76.78b
Figure 1 – Principal component (PC) analysis of fatty acid and nutritional indices. SFA: total saturated fatty acids, MUFA: total monounsaturated fatty acids, PUFA: total polyunsaturated fatty acids, n-6: total omega-6 fatty acids and n-3: total omega-3 fatty acids, IA: Index of atherogenicity, IT: Index of thrombogenicity, HH: Hypocholesterolemic/
hypercholesterolemic fatty acid ratio.
Figure 2 – Principal component (PC) analysis of mineral composition in food bar formulations.
Figure 3 – Principal component (PC) analysis of sensory analysis in food bar formulations. 1 Appearance, 2 Flavor, 3
PAGAMUNICI, L.M. et al. CONCLUSIONS
The use of naturally gluten-free ingredients allowed the development of food bar formulations for celiac disease patients. Promising grains like amaranth and linseed contributed to increasing the protein, lipid and mineral contents in the products. The evaluation of the nutritional
indices in the lipid fraction verified their anti-atherogenic,
anti-thrombogenic and hypocholesterolemic effects and
good ratios for PUFA:SFA and n-6:n-3, corroborating other
studies. All formulations are good sources of minerals.
With respect to sensory analysis, there was no preference for a specific formulation and the purchase intent indices
were high. Application of multivariate analysis allowed sample B to be distinguished due to the contributions of alpha-linolenic acid and mineral content to the weights of its constituents.
REFERENCES
ALVAREZ-JUBETE, L. et al. Polyphenol composition
and in vitro antioxidant activity of amaranth, quinoa buckwheat and wheat as affected by sprouting and baking. Food Chemistry.119(2):770-778, 2010.
AOAC. Association of Official Analytical Chemists.
Method 985.35. In: _____. Official methods of
analysis of AOAC international. 16 ed. Washington:
AOAC, 1995. 14p.
ARENDT, E.K. et al. Gluten-free cereal products and beverages. London: Elsevier, 2008, p. 289-311.
BLIGH, E.G.; DYER, W.J. A rapid method of total lipid extraction and purification. Canadian Journal of Biochemistry and Physiology. 37(8):911-917, 1959.
BRASIL. Regulamento técnico Mercosul sobre
informação nutricional complementar. RDC n°54.
Brasília: Diário Oficial da República Federativa do
Brasil, 2012.
CODEX FOOD COMISSION. Codex Committee on Nutrition and Food for Special Dietary Uses. Codex standard for “gluten-free foods”. Rome: Codex, 1983.
CUNNIFF, P.A. Official methods of analysis of AOAC
international. 16 ed. Washington: AOAC, 1998.
ENRIQUEZ, N. et al. Characterization of wheat and quinoa flour blends in relation to their breadmaking
quality. Journal of the Argentine Chemical Society.
91(4/6):47-54, 2003.
FREITAS, D.G.; MORETTI, R.H. Characterization and
sensorial evaluation of functional cereal bar. Ciência e Tecnologia de Alimentos. 26(2):318-324, 2006.
GOHARA, A.K. et al. Chemometric methods applied
to the mineral content increase in chocolate cakes containing chia and azuki. Journal of the Brazilian Chemical Society. 24(5):771-776, 2013.
GUTIÉRREZ, C. et al. Flaxseed and flaxseed cake as a
source of compounds for food industry. Journal of Soil Science and Plant Nutrition.10(4):454-463, 2010.
HARTMAN, L.; LAGO, R.C. Rapid preparation of fatty
acid methyl esters from lipids. Laboratory Practice.
22(6):475-477, 1973.
HATHCOCK, J.N. Vitamin and mineral safety. 2.ed.
Washington: Council for Responsible Nutrition, 2004. 169p.
JOSEPH, J.D.; ACKMAN, R. Capillary column gas
chromatographic method for analysis of encapsulated
fish oils and fish oil ethyl esters: collaborative study.
Journal of AOAC International. 75(3):488-506, 1992.
LAWLESS, H.T.; HEYMANN, H. Sensory evaluation
of food: principles and practices. 2.ed. Berlin: Springer. 2010. 586p.
MAHANNA, K.; LEE, S.Y. Consumer acceptance of
food bars. Journal of Sensory Studies. 25(1):153-170, 2010.
PAGAMUNICI, M.P. et al. Using chemometric
techniques to characterize gluten-free cookies
containing the whole flour of a new quinoa cultivar.
Journal Brazilian of the Chemical Society. 25(2):219-228, 2014.
PALOMBINI, S.V. et al. Evaluation of nutritional
compounds in new amaranth and quinoa cultivars. Food Science and Technology. 33(2)339-344, 2013.
RATNAYAKE, W.M.; GALLI, C. Fat and fatty acid
SILVA, J.; BESSA, R.J.; SANTOS-SILVA, F. Effect of genotype, feeding system and slaughter weight on the quality of light lambs. II. Fatty
acid composition of meat. Livestock Production Science.77(2-3):187-194, 2002.
SIMOPOULOS, A. Evolutionary aspects of diet: the
omega-6/omega-3 ratio and the brain. Molecular Neurobiology.44(2):203-215, 2011.
SOUZA, A.H.P. et. al. Development, characterization and
chemometric analysis of gluten-free granolas containing
whole flour of pseudo-cereals new cultivars. Acta Scientiariarum. Techonology. 36(1):157-163, 2014.
________. Sacha inchi as potencial source of essential fatty
acids and tocopherols: multivariate study of nut and shell. Acta Scientiariarum. Techonology. 35(4):757-763, 2013.
SPEHAR, C.R. et al. Amaranth BRS Alegria: alternative for diversification of croppings systems. Pesquisa Agropecuaria Brasileira. 38(5):659-663, 2003.
ULBRICHT, T.L.; SOUTHGATE, D.A. Coronary heart disease:
seven dietary factors. Lancet. 338(8773):985-992, 1991.