RESUMO
ABSTRACT
Divergência genética nas progênies de cacau no programa de retrocruzamento visando
resis-tência à vassoura-de-bruxa
O retrocruzamento tem sido pouco usado no melhoramento do cacaueiro, particularmente devido ao longo tempo requerido para transferir genes e recuperar o genoma do pai recorrente. O objetivo deste estudo foi selecionar indiví-duos resultantes do retrocruzamento de CEPEC-42 x SIC-19, geneticamente relacionado ao pai recorrente SIC 19 por meio do uso de marcador molecular RAPD, dentre aqueles com resistência à vassoura-de-bruxa. Das 31 plantas que agruparam com SIC-19, 18 das replantadas permanecem sem a vassoura-de-bruxa no campo, com bom aspecto vegetativo. Essas 18 plantas podem ser usadas em retrocruzamento para alcançar o objetivo desejado.
Palavras-chave: Retrocruzamento, melhoramento, marcador molecular, seleção assistida por marcadores, genótipo gráfico.
Recebido para publicação em novembro de 2008 e aprovado em setembro de 2009
1 Engenheiros-Agrônomos, Ph.Doctor. Centro de Pesquisas do Cacau (CEPEC), CEPLAC, Caixa Postal 7, 45600-970, Itabuna, Bahia, Brasil. [email protected] 2 Engenheiro-Agrônomo, Doutor. Centro de Pesquisa Agropecuária dos Cerrados, EMBRAPA, Caixa Postal 08223, 73301-970, Planaltina, Distrito Federal, Brasil. [email protected]
3 Bióloga. Centro de Pesquisas do Cacau (CEPEC), CEPLAC, Caixa Postal 7, 45600-970, Itabuna, Bahia, Brasil.
4 Engenheiro-Agrônomo, Doutor. Centro de Pesquisas do Cacau (CEPEC), CEPLAC, Caixa Postal 7, 45600-970, Itabuna, Bahia, Brasil. 5 Engenheiro-Agrônomo, Mestre. Centro de Pesquisas do Cacau (CEPEC), CEPLAC, Caixa Postal 7, 45600-970, Itabuna, Bahia, Brasil.
Milton Macoto Yamada¹ , Fábio Gelape Faleiro², Uilson Vanderlei Lopes¹, Acassi Batista Flores3,
José Luis Pires4, Gilson Roberto Pires Melo5
Genetic divergence in cocoa progenies for backcrossing program to
witches’ broom disease resistance
Backcrossing has been little used in cacao breeding, particularly due to the long time required to transfer genes and recover the genetic background of the recurrent parent. The objective of this study was to select individuals, resulting from the backcross CEPEC-42 x SIC-19, genetically related to the recurrent parent SIC-19 by using RAPD molecular markers, among those with resistance to witches’ broom. Of the 31 plants that clustered with SIC-19, 18 from the replanted material remained free of the disease in the field, with good vegetative aspect and, therefore can be used for backcross to reach the desired objective.
INTRODUCTION
Backcrossing has been little used in cacao breeding, particularly due to the long time required to transfer genes and recover the genetic background of the recurrent parent.
In general, it is necessary seven to nine backcross generations (Allard, 1960) to recover the genome of recurrent parent, which in cacao represents more than 20 years. The use of molecular markers and the concept of graphical genotypes (Young and Tanksley, 1989) can considerably accelerate this process, reducing to three or four backcross generations (Faleiro et al., 2004).
In Bahia’s cocoa region, a large portion of the farm fields are planted with a group of varieties called “Co-mum” or “Local”, introduced in 1700s. These varieties, despite well-adapted to the region and quite productive, are susceptible to witches’ broom (Moniliophthora per-niciosa, formely Crinipellis perniciosa (Aiwe and Phillips-Mora, 2005) and black pod rot (Phytophthora spp.). After the introduction of the witches’ broom in Bahia, in 1989 (Pereira et al., 1989), plantations with the variety Comum were almost completely destroyed in areas where the disease was very severe, because of its high susceptibility to the disease and considerable genetic uniformity.
The main sources of resistance to witches’ broom in cacao are the clones of the Scavina series, selected in Peru near the River Ucayali, by Pound (Bartley, 2005). One of these clones, particularly the Scavina-6, has been
involved in many crosses, including backcrosses, aiming to transfer its resistance genes. For example, recently, several cocoa plants have been obtained from the cross CEPEC-42 x SIC-19. SIC-19 is a clone selected from the variety Comum and CEPEC-42 is a clone selected from progenies of the cross TSA-644 (=Sca-6 x IMC-67) x SIC-19 (Figure 1), for its resistance to witches’ broom.
The objective of this study was to identify individuals, resulting from the backcross CEPEC-42 x SIC-19, genetically related to the recurrent parent SIC-19 through the use of RAPD molecular markers, among those with resistance to witches’ broom.
MATERIAL AND METHODS
Genetic material
The progenies used in this study, resulting from the cross CEPEC 42 x SIC 19, were planted at the “Joaquim Bahiana” Experimental Station (JOBES), in Itajuípe, Bahia, Brazil. The objective of the experiment was to select genetic material with resistance to main diseases (witches’ broom, black pod rot, Ceratocystis). The CEPEC 42 x SIC 19 cross is highly resistant to witches’ broom and 160 seeds were planted in the greenhouse. Of these plants, only 109 survived to infection by witches’ broom and were transplanted to the field in JOBES in 02/2006. In this experiment, evaluations of witches’ broom were carried out by counting the number of brooms in field conditions for four times. Also, since around the experimental area there were many trees heavily infected with witches’ broom, the selection pressure continued in the field, killing more trees in this progeny. Therefore, it is expected that overall the remaining plants show a higher level of resistance to witches’ broom. Seventy-eight of these 109 plants, which showed a higher level of resistance to witches’ broom, were evalueted.
DNA extraction
Leaves were collected for DNA extraction from 78 plants among the survived plants showing a higher level of resistance to witches’ broom and five plants were used as control (SIC 19,CEPEC 42, Sca6, IMC67 and TSA 644). Leaves of each accession were collected for DNA extraction using the CTAB method (Doyle and Doyle, 1990) with some modifications (Faleiro et al.,2002). After the extraction, the DNA concentration was estimated by spectrophotometer at 260 nm (Sambrook et al., 1989). The total genomic DNA was evaluated through electrophoresis in 0.8% agarose gel that was used as indicative of integrity and purity of the extracted DNA. After the quantification, the samples of DNA were diluted to the concentration of 10 ng/μL.
RAPD markers
DNA samples of each genetic material were amplified by PCR (Polimerase Chain Reaction) to obtain RAPD (Random Amplified Polymorphic DNA) markers. To improve the genotyping accuracy, the work was done in two stages. In the first stage with 42 plants, and in the second with 36 plants (Table 2). Five accessions were used as control (CEPEC 42, SIC 19, TSA 644, Sca6 and IMC 67) for the two groups, in a total of 88 plants (47 + 41). For each stage, the samples were run in the same gel using 2 combs. The amplification reactions were made in a total volume of 25 μl, containing Tris-HCl 10 mmo.L-1 (pH 8.3), KCl 50 mmo.L-1, MgCl
2 2 mmo.L -1, 100 μmol.L-1 each of desoxiribonucleotides (dATP,
dTTP, dGTP and dCTP), 0.4 μmol.L-1 of a decamer
primer, 1U of Taq DNA polymerase and approximately
30 ng of DNA. The decamers primers used in the amplification to obtain RAPD markers were N16, P15, I 10, N6, V2, V3, Y8, T 18, S18, V4 and T5 (Table 3). The amplifications were run in termocycler programmed for 40 cycles in the following sequence: 15 seconds at 94 ºC, 30 seconds at 35 ºC and 90 seconds at 72 ºC, and a final extension step of 7 minutes at 72 ºC, and finally the temperature was reduced to 4 ºC. After the amplification, 3 μL of a mixture of bromophenol blue (0.25%) and glycerol (60%) in water were added to each sample. The samples were loaded in agarose gel (1.2%) in TBE buffer (Tris-Borato 90 mmol.L-1, EDTA 1 mmol.L -1). The electrophoretic separation was carried out in
approximately four hours, at 90 volts. At the end of run, the gels were stained with ethidium bromide and photographed under ultraviolet light.
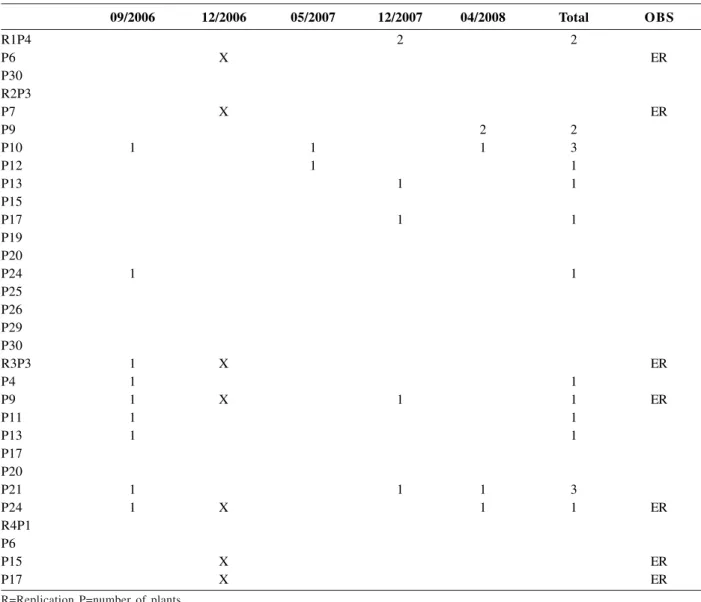
Table 1. Number of brooms per plant of the CEPEC 42 x SIC 19 family of 31 plants that clustered with SIC 19
09/2006 12/2006 05/2007 12/2007 04/2008 Total OBS
R1P4 2 2
P6 X ER
P30 R2P3
P7 X ER
P9 2 2
P10 1 1 1 3
P12 1 1
P13 1 1
P15
P17 1 1
P19 P20
P24 1 1
P25 P26 P29 P30
R3P3 1 X ER
P4 1 1
P9 1 X 1 1 ER
P11 1 1
P13 1 1
P17 P20
P21 1 1 1 3
P24 1 X 1 1 ER
R4P1 P6
P15 X ER
P17 X ER
R=Replication P=number of plants
X- replanted material in 12/2006 due to death caused by witches´broom
Evaluation of witches´broom in 09/2006, 05/2007, 12/2007 and 04/2008.
Table 2. Number of samples and code of analyzed cacao accessions
GROUP 1 GROUP 2
Number Accessions Number Accessions
1 SIC 19 1 SIC 19
2 CEPEC 42 2 CEPEC 42
3 SCA 6 3 SCA 6
4 IMC 67 4 IMC 67
5 TSA 644 5 TSA 644
6 to 47 42 Plants 48 to 83 36 Plants
Statistical analyses
The generated RAPD markers were converted to a matrix of binary data and genetic distances were calculated on the basis of the complement of Nei and Li’s (1979) similarity coefficient using the Genes Software (Cruz, 2001). The genetic distance matrix was used for cluster analysis using the UPGMA method (Unweighted pair-group arithmetic average). Conversion of genetic distances into graphic distances was based on multidimensional scales using the principal components method performed with the SAS (SAS,1989) and Statistica (STATSOFT, 1999) software.
RESULTS AND DISCUSSION
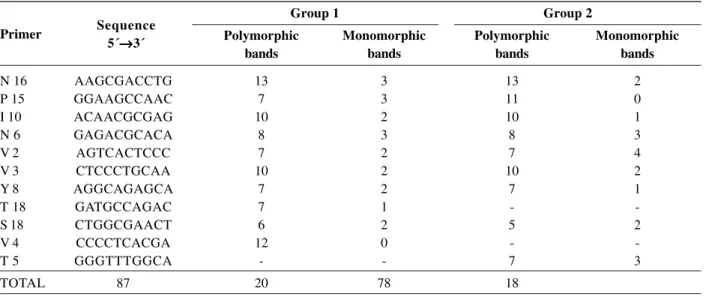
The percentage of polymorphic bands obtained in the two groups of material were similar (Table 3), in which 81.30% (87 out of 107) and 81.95 % (78 out of 96) of the bands were polymorphic, although some primers were not common to the two groups (Table 3).
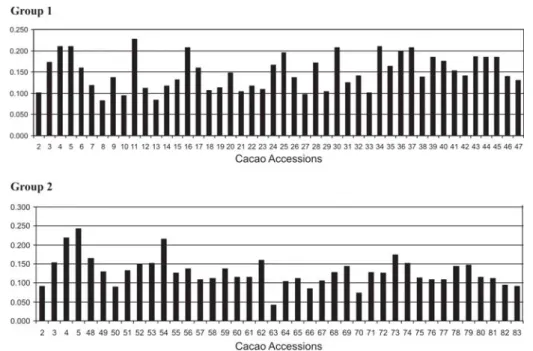
The genetic distance in relation to the clone SIC 19 ranged from 0.083 to 0.227 in the first group and from
0.042 to 0.242 in the second group (Figure 2). Similar results were reported by Faleiro et al. (2004), in common bean, with distances ranging from 0.07 to 0.33 for backcross 2 (BC2).The genetic distances between SIC 19 and CEPEC 42 were 0.102 and 0.091 for groups 1 and 2, respectively. Although no molecular marker was used to select CEPEC 42, this clone was very close to SIC 19, which can be a coincidence. Number 63 from group 2 (Figure 2) showed the lowest genetic distance in relation to SIC 19.
Figures 3 and 4 show that SIC 19 and CEPEC 42 have also grouped with thirty-one plants, being 16 in group 1 and 15 in group 2. Of the 31 plants, 13 and 5 from the replanted material remained free of the disease in the field (Table 1), with good vegetative aspect and, therefore can be used for backcross to reach the desired objective. The natural selection in the greenhouse (109 from 160 plants survived) and natural selection in the field, 78 of 109 plants with good vegetative aspect were chosen, and 7 of 31 were replanted to replace those killed by the witches’ broom disease (Table 1) and 18 of 31 plants remained free of the disease. The information above shows the selection pressure by witches’ broom disease faced by these plants.
Choosing genotypes with low genetic distances in relation to the recurrent parent can reduce the number of generations necessary to recover a large portion of its genome (Moraes et al., 2005; Fonseca et al., 2009). Here, it is expected that one more backcross will be enough to reach levels of genetic distance close to zero, as obtained by Faleiro et al. ( 2004) in common beans, when genetic distances in relation to the recurrent parent ranged from zero to 7% for BC3.
Table 3. Primers used for RAPD markers in the two groups of plants and respective number of polymorphic and monomorphic bands
Group 1 Group 2
Polymorphic Monomorphic Polymorphic Monomorphic
bands bands bands bands
N 16 AAGCGACCTG 13 3 13 2
P 15 GGAAGCCAAC 7 3 11 0
I 10 ACAACGCGAG 10 2 10 1
N 6 GAGACGCACA 8 3 8 3
V 2 AGTCACTCCC 7 2 7 4
V 3 CTCCCTGCAA 10 2 10 2
Y 8 AGGCAGAGCA 7 2 7 1
T 18 GATGCCAGAC 7 1 -
-S 18 CTGGCGAACT 6 2 5 2
V 4 CCCCTCACGA 12 0 -
-T 5 GGGTTTGGCA - - 7 3
TOTAL 87 20 78 18
CONCLUSIONS
Individuals resulting from the backcross CEPEC-42 x SIC-19 genetically related to the recurrent parent SIC-19 were identified using RAPD markers. The process of backcrossing will be accelerated.
ACKNOWLEDGEMENTS
This study was financially supported by FAPESB-BA.
REFERENCES
Aiwe MC & Phillips-Mora W (2005) The causal agents of witches´broom and frost pod rot of cacao (chocolate,
Theobroma cacao) form a new linage of Marasmiaceae.
Mycologia, 97:1012-1022.
Allard RW (1960) Principles of plant breeding. New York, John Weley and Sons, Inc. 485p.
Bartley BGD (2005) The genetic diversity of cacao and its utilization. Cambridge, CABI Publishing. 341p.
Cruz CD (2001) Programa genes - versão Windows. Aplicativo computacional em genética e estatística. Viçosa, Editora UFV. 648p.
Doyle JJ & Doyle JL (1990) Isolation of plant DNA from fresh tissues. Focus, 12:13-15.
Faleiro FG, Araújo IS, Bahia RCS, Santos RF, Yamada MM & Anhert D (2002) Otimização da extração e amplificação de DNA de Theobroma cacao L. visando a obtenção de marcadores RAPD. Agrotrópica, 14:31-34.
Faleiro FG, Ragagnin VA, Moreira MA & de Barros EG (2004) Use of molecular markers to accelerate the breeding of common bean lines resistant to rust and anthracnose. Euphytica, 138:213-218.
Figure 2. Geneticdistance between 47 (Group 1) and 41 (Group 2) cacao accessions in relation to SIC 19 calculated on the basis of the complement of Nei and Li’s similarity coefficients, using 87 and 78 RAPD markers. The numbers correspond to accessions of Table 2.
Figure 3. Graphic dispersion of 47 cacao accessions (Group 1) based on the genetic distance matrix calculated with 87 RAPD markers. The accessions (·) were clustered with SIC 19. The numbers correspond to the accessions of Table 2.
Fonseca KG, Faleiro FG, Junqueira NTV, Peixoto JR, Bellon G, Junqueira KP & Santos EC (2009) Análise da recuperação do genoma recor-rente em maracujazeiro-azedo com base em marcadores RAPD. Revista Brasileira de Fruticultura, 31:145-153.
Moraes RMA de, Cruz CD, de Barros EG & Moreira MA (2005) Genetic divergence in soybean parents for backcrossing programs. Crop Breeding and Applied Biotechnology, 5:339-346.
Nei M & Li WH (1979) Mathematical model for studying genetic variation in terms of restrictions endonucleases. Proceedings of National Academy of Sciences, 76:5269-5273.
Pereira JL, Ram A, Figueiredo JM & Almeida LCC de (1989) Primeira ocorrência de vassoura-de-bruxa na principal região produtora de cacau do Brasil. Agrotrópica, 1:79-81.
Sambrook J, Fritsch EF & Maniats T (1989) Molecular cloning: a laboratory manual. 2nd ed. New York, Cold Spring Harbor Laboratory. 653p.
SAS Institute Inc (1989) SAS/STAT User´s Guide, version 6.4 ed. Cary, SAS Institute, North Caroline State University. 846p.
STATSOFT Inc. (1999) Statistics for Windows (computer program manual). Tulsa, Tulsa Stat Soft Inc.2300 East 14th street.