Engineering ISSN: 1809-4430 (on-line)
_________________________
2 Universidade Federal da Grande Dourados - UFGD/Dourados, Brasil. 3 Adecoagro/Ivinhema- MS, Brasil.
QUALITY OF SUGARCANE MECHANIZED PLANTING Doi:http://dx.doi.org/10.1590/1809-4430-Eng.Agric.v36n6p1136-1144/2016
JORGE W. CORTEZ1*, CAMILLA MISSIO2, ANA K. G. BARRETO3,
MARCELEI D. DA SILVA3, GUSTAVO N. DOS REIS3
1*Corresponding author. Universidade Federal da Grande Dourados - UFGD/ Dourados - MS, Brasil. E-mail: jorge.cortez@yahoo.com.br
ABSTRACT: The quality of the sugarcane plantation affects the plantation longevity, yield and production costs. Therefore, this study aimed to evaluate the quality of sugarcane mechanized planting in day and night shifts. The mechanized planting was carried out in Ivinhema, MS, Brazil. For the evaluation of pre-planting seedlings, were collected 40 billets in the seedling area with 10 repetitions for each shift. For the other variables, it was held sampling, totaling 60 points, 30 points assessed for each shift. The variables evaluated were: total of natural damage and total of mechanized damage in pre-planting, shoot per meter, viable shoots per meter, total of unviable shoots, seedlings consumption and failures percentage. Data were analyzed with descriptive statistics and statistical quality control. The attributes showed stable mechanized planting process, that is, with quality, except only for the seedlings consumption and failures for the day shift that presented unstable process or outside the proposed standards to achieve quality. To achieve the specific limits for the number of viable shoots m-1, it is necessary to increase the seedlings
consumption, and an alternative would be to start the operators training to align the expected goals and qualify labor.
KEYWORDS:statistical process control, Saccharum spp., control charts.
INTRODUCTION
The sugarcane planted area in Mato Grosso do Sul increased 363.5% from 2003 to 2012 with average annual growth of 20.4% (WISSMANN et al. 2014). The various factors that affect the sugarcane planting quality can be endogenous or exogenous. The main exogenous factors are: planting depth, spacing, mechanized damage of shoots, furrow coverage, failure in seedlings deposition, number of viable shoots and post-coverage compression (RAVELI et al., 2015).
The variability during sugarcane mechanized planting operation is an intrinsic factor of the process, since it involves operational aspects of the machine, man and the arrangement of the rows in the field. In this regard, tools that aim to reduce the variability or to identify its causes should be used. Well regulated dispensing systems which have uniform distribution avoid deposition failures and perform a good work quality with adequate amounts of sugarcane in the planting furrow, resulting in saving, higher yield and cost reduction (DIAS NETO et al., 2001).
The quality in planting is necessary to provide the proper sugarcane crop development and to ensure the longevity of ratoons (BARROS & MILAN, 2010).The authors also mention that one way to improve the quality is to conduct training with the planting team and responsible operators.
Assuming that sugarcane mechanized planting may have low quality, resulting in the decreased productivity; it aimed to evaluate the sugarcane mechanized planting quality in day and night shifts using the statistical process control (SPC).
MATERIAL AND METHODS
The study was carried out at Ivinhema, MS, Brazil, in the period of August 2014, on a commercial property or experimental unit, located at latitude of 22º11’58.82”S, longitude of 53º58’22.34”O of Greenwich with altitude of 376m, the area soil is classified as Oxisol and average slope of 4%. The climate is considered tropical with summer rains of Aw type, according to the Köppen classification.
The sugarcane mechanized planting, in the day and night shifts, was carried out through tractor-planter, with power of 156.66 kW in the engine at 2200 rpm, working in the 8th working
gear and with average displacement speed of 5.5 km h-1. It was used a pricked sugarcane planter of
two rows, with capacity of six tons of seedlings for planting, with furrow shanks spaced 1.50 m. The seedling used was the CTC14 crop, developed by the Centre for Sugarcane Technology (CTC). The seedlings evaluation in pre-planting were carried out only in the day shift for the total of natural damage because the operation shifts did not interfere in this variable, and in both shifts the total of mechanized damage were carried out 10 and 20 repetitions, respectively, with the collection of 40 billets in each repetition, billet is a sugarcane piece with two or more buds. The total of natural damage was obtained by the sum of brocade shoots, sick shoots and shoot buds divided by the shoots number, and the total of mechanized damage was obtained from the sum of grated shoots and cut shoots divided by the shoots number.
It was established to the data collection on post-planting the spacing between the points of 5.0 x 1.50m, being 30 points evaluated in the day shift and 30 points in the night shift, the data were collected 24 hours after the mechanized planting. At each point, it was marked a distance of five meters of furrow in which were carried out the evaluations, being excavated after mechanized planting with a hoe, similar to the methodology proposed by VOLTARELLI et al. (2014).
The billets number (BN), the shoots number (SN), viable shoots number (VSN), unviable shoots number (USN) were accounted by direct count of the billets number in the furrow, and subsequently obtained the total of unviable shoots (%). Unviable shoots are the ones that suffered attacks caused by pests and diseases, possible fragmentations provided by impacts from mechanized harvesting, by the seedlings transportation to the planting area, by the discharge of the billets within the planter bucket or any kind of damage that might compromise their budding efficiency, and the viable shoots are the ones that suffered no damage, according to the methodology described by VOLTARELLI et al. (2013).
It was identified planting failures 60 days after the planting, being considered as failures interruptions bigger than 0.50 meters without the presence of seedlings, were accounted the sum of failures in 100 meters of evaluation (20 m x 5 planting rows). It was carried out 30 points for the day shift and 30 points for the night shift, the failures evaluation were realized based on the methodology proposed by STOLF (1986).
The specific quality limits were established by the production unit aiming at the mechanized planting quality, using the control charts as upper and lower specific limits (Table 1).
TABLE 1. Specific control limits for quality indicators defined by the production unit.
Quality indicators Lower specific limit (LSL) Upper specific limit (USL)
BN 9 15
SN 15 25
VSN 15 25
SC 12 16
TND 0 0
TMDS 0 0
TUS 0 0
BN – billets number m-1; SN – shoots number m-1; VSN – viable shoots number m-1; SC - seedlings consumption (Mg ha-1); TND – total of natural damage (%); TMDS –total of mechanized damage of shoots (%); TUS – total of unviable shoots .
The quality control aim at maximum efficiency of mechanized planting operation, so it is understood that the TND (%) and TMDS (%) for pre-planting and TUS (%) in the planting do not have a positive effect when they appear in planting evaluation, waiting that the same does not happen, so it is define the expected specific limit as zero (Table 1).
RESULTS AND DISCUSSION
The total of mechanized damage of shoots (TMDS) was higher for the night shift (Table 2), with greater variability of the data and coefficient of variation. The coefficient of variation (CV) was classified according to PIMENTEL GOMES (2000), so the CV was too high for the TND, medium for the day TMDS and high for the night TMDS, indicating high variability of the data. The asymmetry coefficient for TND indicates a negative asymmetric distribution, for the day and night TMDS, the asymmetry coefficient indicates a positive asymmetric distribution, but both the attributes when submitted to normality test showed normal distribution of data.
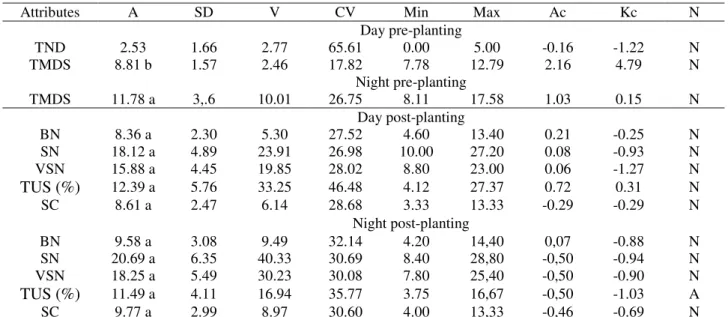
TABLE 2. Descriptive statistics of the attributes evaluated in the pre-planting and post-planting.
Attributes A SD V CV Min Max Ac Kc N
Day pre-planting
TND 2.53 1.66 2.77 65.61 0.00 5.00 -0.16 -1.22 N
TMDS 8.81 b 1.57 2.46 17.82 7.78 12.79 2.16 4.79 N
Night pre-planting
TMDS 11.78 a 3,.6 10.01 26.75 8.11 17.58 1.03 0.15 N
Day post-planting
BN 8.36 a 2.30 5.30 27.52 4.60 13.40 0.21 -0.25 N
SN 18.12 a 4.89 23.91 26.98 10.00 27.20 0.08 -0.93 N
VSN 15.88 a 4.45 19.85 28.02 8.80 23.00 0.06 -1.27 N
TUS (%) 12.39 a 5.76 33.25 46.48 4.12 27.37 0.72 0.31 N
SC 8.61 a 2.47 6.14 28.68 3.33 13.33 -0.29 -0.29 N
Night post-planting
BN 9.58 a 3.08 9.49 32.14 4.20 14,40 0,07 -0.88 N
SN 20.69 a 6.35 40.33 30.69 8.40 28,80 -0,50 -0.94 N
VSN 18.25 a 5.49 30.23 30.08 7.80 25,40 -0,50 -0.90 N
TUS (%) 11.49 a 4.11 16.94 35.77 3.75 16,67 -0,50 -1.03 A
SC 9.77 a 2.99 8.97 30.60 4.00 13,33 -0,46 -0.69 N
A – average; SD – standard deviation; V – variance; CV – coefficient of variation; Min – minimum; Max – maximum; Ac – asymmetry coefficient; Kc – kurtosis coefficient; N – normality test of Ryan-Joiner (N: normal distribution – p > 0.05; A: asymmetry distribution – p < 0.05); TND (%) – total of natural damage; TMDS (%)total of mechanized damage of shoot. BN – billets number m -1; SN – shoots number m-1; VSN – viable shoots number m-1; TUS total of unviable shoots; SC - seedlings consumption (Mg ha-1). Averages followed by the same letter in the column do not differ from each other by variance analysis, and comparing the day and night shifts on the same attribute.
ensure the same number of shoots per meter. The natural damages (TND) when quantified at the harvest, allow in case of very high damage values are found, it is possible to decide choosing other sugarcane for planting or to stop the harvester to readjust and avoid mechanized damage.
In the post-planting it is verified by the variance analysis that there was no difference between the averages of the night and day shift (Table 2). The variation coefficient (Table 2) can be classified very high for BN, SN, VSN and SC for the day shift and very high for the day TUS, BN, SN, VSN, TUS and SC for the night shift (PIMENTEL GOMES, 2000).The perceived variability in all attributes can be explained due to the high dispersion of the data set, which can also be observed by the standard deviations values. VOLTARELLI et al. (2014) evaluating the mechanized planting quality for the day and night shift found coefficients of variation very high for BN, VSN and SC for both shifts and high for SN for the day shift, values that are similar to the ones found in this study. CASSIA et al. (2013) evaluating the mechanized harvest quality of coffee in a circular planting system, observed high variability of the data according to the classification proposed by PIMENTEL GOMES, (2000) which can be considered a common result in mechanized agricultural operations.
The billets number (BN), shoot number (SN), viable shoot number (VSN) per linear meter and the seedlings consumption attributes for both operation shifts and the total of unviable shoots attribute (TUS) for the day shift operation showed normal data distribution in accordance with Ryan Joiner test, with symmetric distribution of the data set, being confirmed by the asymmetry and kurtosis values close to zero. The total of unviable shoots (TUS) (Table 2) in the night shift operation showed asymmetric probability distribution, and it can be observed by the very high coefficient of variation (PIMENTEL GOMES, 2000) and by the maximum and minimum values, being confirmed by the asymmetry and kurtosis coefficients that showed negative platykurtic and asymmetric distribution, respectively.
It was observed that the average seedlings consumption is below the established limits (Table 1), which is confirmed by the shoots number (SN) per meter (Table 2) that showed average close to the lower specific limits (Table 1), so if the shoots distributed per meter show high number of unviable shoots, the number of viable shoots per meter would not meet the specific limits to ensure the sugarcane mechanized planting quality. The excessive and unnecessary use of sugarcane seedlings in mechanized planting makes to be harvested a larger sugarcane area for seedling, and consequently decreasing production areas for industry and increasing the planting and production costs (RAVELI et al, 2015).
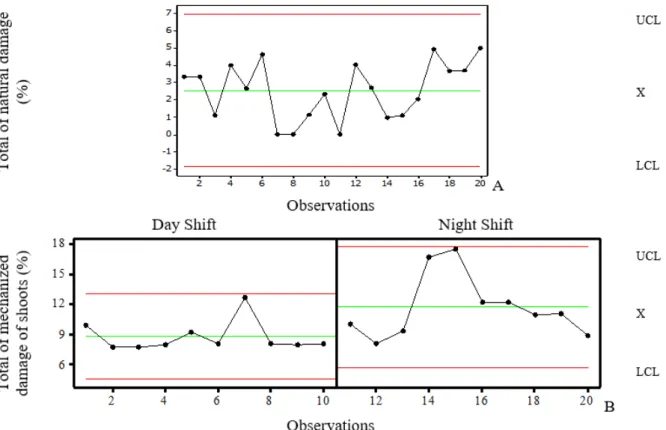
The total of natural damage (Figure 1A) in SPC or SQC was stable at all points within the control limits (UCL –upper control limit and LCL –lower control limit). The total of natural damage is related to the sugarcane seedling quality and its endogenous factors linked to the sugarcane seedling potential as age of shoots and variety. The producing unit defines as acceptable up to 7% the total of natural damage, without the need to select a new area for the seedlings harvest.
The total attribute of mechanized damage of shoots (Figure 1B) for night shift operation showed higher values for mechanized damage and greater variation when compared to day shift, demonstrating that the day shift showed better quality. This external source of variation process can be attributed to labor, raw materials, environment, machine, method and measurement.
FIGURE 1. Control charts for total of natural damage (%) - A; and total of mechanized damage (%) of shoots (B). UCL: upper control limit. LCL: lower control limit. X: average of individual values.
For the specific quality control to the planting the ideal is the smaller number possible of damages to the shoots (VOLTARELLI et al., 2013), so this indicator allows to monitor the harvest and make small adjustments to the harvester in order to improve crop quality without shoots damage. The use of rubber (seedlings kit) in some parts of the harvester, combined with lower displacement speeds (RAVELI et al., 2015) improves the quality of seedling harvest.
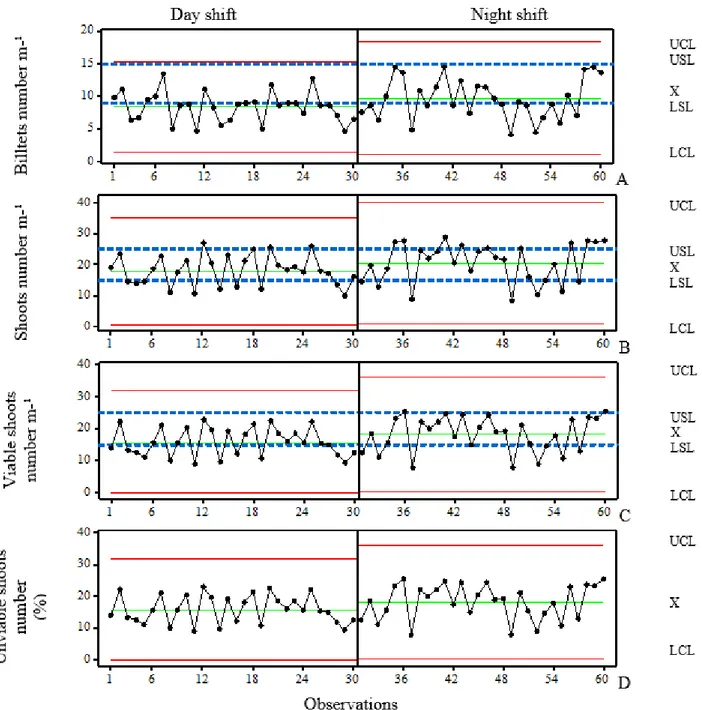
The billets number m-1 (Figure 2A) did not show disparate points for the operations shifts. It
was noticed bigger interquartile variation for the night shift operation, but the process was stable and with operation quality. It can be noticed big amount of points below the specific lower limit, being 60% on day shift and 50% on the night, which may be related to the planter operator that controls the distributor conveyor of seedlings that could for instance has carried out low sugarcane supply. RAVELI et al. (2015) evaluating the sugarcane planting quality realized that the billets deposition in the furrow is carried out with greater effectiveness and lower failure rates in semi-mechanized planting system because it occurs manually, while the billets deposition in the furrow by the planter may be affected by the speed of the tractor-planter set, the oil flow available for the distributor conveyor and the planter operator skill. The average billets number found in this study closely resembles to the one found by KUMAR & SINGH (2012) and NORONHA et al. (2011), but this fact may represent a threat to the planting quality if the shoots may have a high number of unviable shoots.
FIGURE 2. Control charts to billets number m-1 - A; shoots number m-1 - B; viable shoots number
m-1 - C; total of unviable shoots (%) - D. UCL: upper control limit. LCL: lower
control limit. USL: upper specific limit. LSL: lower specific limit. X: average of individual values.
In this approach, it was observed that the night operation has shown greater amount of billets and consequently greater number of shoots per meter, this is justified by the labor factor which aims to prevent inherent errors to the visibility conditions, found by the operators’ preference in distribute the billets close to the upper control limits. VOLTARELLI et al. (2013) found average of
total shoots’ number m-1 of 37.05 for the day shift and 34.95 for the night, which are quite different
from this study that has an average of 18.00 shoots m-1 for the day and 20.00 shoots m-1 for the
night, which allows to identify that the average number of shoots differ in relation to the goals of each production unit in different regions.
planting quality found greater variability in the viable shoots number m-1 for the night shift
operation. The fact is that in the implementation of mechanized planting, the viable shoots amount is the most important characteristic in the planting process, being crucial to ensure good results and to achieve the quality objectives (RAVELI et al., 2015).
The total of unviable shoots (%) (Figure 2D) was stable, but showed high levels of unviable shoots, which has negative impact to the process, bearing in mind that the important thing for planting is the number of viable shoots per meter and the absence of unviable shoots since the process searches as a specific limit values close to zero. And the greater variability of total of unviable shoots (%) in the night shift can be confirmed by the total of mechanized damage of shoots (%) that were higher for this shift, and that is directly related to the number of viable shoots per meter.
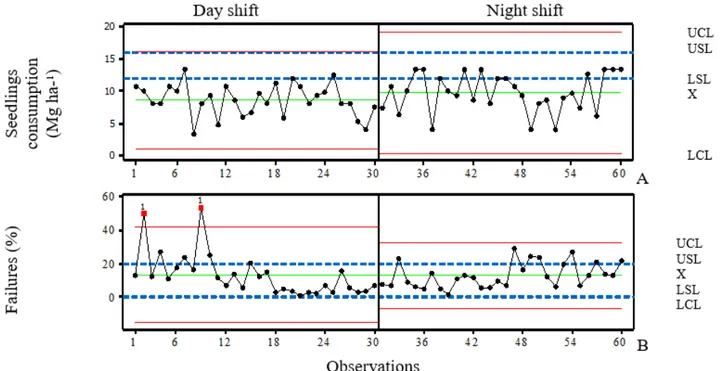
The seedlings consumption (Mg ha-1) (Figure 3A) was stable in two operating shifts, but it
can be noted low seedlings consumption, being 90% of the points below specific limits for the day shift and 63.33% of the following points for the night shift, this fact can be explained by the metering mechanism of the planter and operating speed, which may result in negative consequences for the planting as failures in sprouting due to low seedlings consumption.
The average seedlings consumption in this study for the day shift was 8.61 Mg ha-1 and 9.77
Mg ha-1 for the night shift, with values below the one found by VOLTARELLI et al. (2014) of 23
Mg ha-1. The specific limits defined in this study from 15 to 25 (Mg ha-1) are within the acceptable
and recommended. The low seedlings consumption and the high variability found may be justified by the machine factor and labor, since the distribution uniformity depends on the seedlings distributor conveyor adjustment in the planter and the control of the conveyor by the operator in the planter cabin.
FIGURE 3. Control charts for seedling consumption (Mg ha-1) in the planting - A; failures (%) - B.
UCL: upper control limit. USL: upper specific limit. LSL: lower specific limit. LCL: lower control limit. X: average of individual values.
VOLTARELLI et al. (2014) evaluating the mechanized planting in both operation shifts concluded that the night shift showed higher quality than the day to the quality indicators related to the crop agronomic aspects. Therefore, the failure rate classification proposed by STOLF et al. (1986), the mechanized planting quality, considering the average of the evaluated points was 13.20% for the day shift and 13.02% for the night shift; it can be classified as good planting, for both shifts. It was noticed that only one point evaluated in the day shift showed failures above 50%, being the observation No. 9 of the chart, indicating that this point should be followed again at 90 DAP to carry out replanting. NAIK et al. (2013) suggests that the replanting of failed areas is done by a semi-mechanized system which uses seedlings with 3 to 5 leaves that will be transplanted directly into the furrow, providing savings in time and costs and ensuring the elimination of post-planting failures.
To achieve quality in mechanized agricultural operations is necessary to reduce the variability and to center the average of the attribute response close to the target value. Thus, it is essential to establish appropriate levels to the controllable factors by planning and planting analysis at the moment it happens to allow adjustments and controls, identifying and eliminating special causes when they occur, besides continuous actions in long term able to reduce the random effects of uncontrollable factors (COMPAGNON et al, 2012; NORONHA et al, 2011).The observation of the points behavior within the specific control limits over the process allows the identification of samples outside the required standards and thus allows changes and adjustments to be made to the process so that can meet quality requirements and ensure the success of mechanized planting.
CONCLUSIONS
The sugarcane mechanized planting during the night shift operation showed high quality, while the day shift operation showed low planting quality, evidenced by points outside the limits.
The care with the night shift planting operation showed higher values in the evaluated attributes, which refers to greater attention during this shift to avoid failures and possible replanting. To reach the searched specific limits to the number of viable shoots, it is necessary to increase the seedlings consumption and an alternative would be to intensify the training of tractor and planter operators to align the expected goals and to qualify the labor.
ACKNOWLEDGEMENTS
Thanks to CAPES for the master's degree scholarship of the second author, to CNPQ for the scholarship of the first author, to the ADECOAGRO for the support in the experiment implementation.
REFERENCES
BARROS, F.F.; MILAN, M. Qualidade operacional do plantio de cana-de-açúcar. Bragantia, Campinas, v.69, n.1, p.221-229, 2010.
CASSIA, M.T.; SILVA, R.P.; CHIODEROLI, C.A.; NORONHA, R.H.F.; SANTOS, E.P. Quality of mechanized coffee harvesting in circular planting system. Ciência Rural, Santa Maria, v.43, n.1, p.28-34, 2013.
CHIODEROLI, C.A.; SILVA, R.P.; NORONHA, R.H.F.; CASSIA, M.T.; SANTOS, E.P. Perdas de grãos e distribuição de palha na colheita mecanizada de soja. Bragantia, Campinas, v.71, n.1, p.112-121, 2012.
DIAS NETO, A.F.; MAGALHÃES, P. S. G.; BRAUNBECK, O. A. Aprimoramento de
mecanismo dosador de rebolos para o plantio mecanizado de cana-de-açúcar. Revista Brasileira de Engenharia Agrícola e Ambiental, Campina Grande, v.5, n.3, 546-553, 2001.
KUMAR, S.; SINGH, B.R. Performance feasibility and economic viability of sugarcane planter in western Plane zone of Uttar Pradesh, India. Sugar Techonology Reviews, Amsterdam, v.14, n.2, p.101-108, 2012.
NAIK, R.; ANNAMALAI, S.J.K.; NAIR, N.V.; PRASAD, N.R. Studies on mechanization of planting of sugarcane bud chip settlings raised in portrays. Sugar Techonology Reviews, Amsterdam, v.15, n.1, p.27-35, 2013.
NORONHA, R.H.F.; SILVA, R.P.; CHIODEROLI, C.A.; SANTOS, E.P.; CASSIA, M.T. Controle estatístico aplicado ao processo de colheita mecanizada diurna e noturna de cana-de-açúcar.
Bragantia, Campinas, v.70, n.4, p.931-938, 2011.
PIMENTEL GOMES, F. Curso de estatística experimental. 14. ed. Piracicaba: Nobel, 2000. 477 p. RAVELI, M.B.; SILVA, R.P.; FURLANI, C.E.A.. Variabilidade do plantio mecanizado de cana-de-açúcar. In: SILVA, R.P.; VOLTARELLI, M.A.; CASSIA, M.T. Controle de qualidade em
operações agrícolas mecanizadas. Jaboticabal: SBEA, 2015. p. 193-199.
SILVA, R.P.; CASSIA, M.T.; VOLTARELLI, M.A.; COMPAGNON, A.M.; FURLANI, C.E.A. Qualidade da colheita mecanizada de feijão (Phaseolus vulgaris) em dois sistemas de preparo do solo. Ciência Agronômica, Fortaleza, v.44, n.1, p.61-69, 2013.
STOLF, R. Metodologia de avaliação de falhas nas linhas de cana-de-açúcar. STAB, Piracicaba, v.4, n.6, p.22-36, 1986.
VOLTARELLI, M.A.; SILVA, R.P; ROSALEN, D.L; ZERBATO, C.; CASSIA, M.T. Quality of performance of the operation of sugarcane mechanized planting in day and night shifts. Australian Journal Crop Science, Lismore,v.7, n.9, p.1396-1406, 2013.
VOLTARELLI, M.A.; SILVA, R.P.; ZERBATO, C.; SILVA, V.A.F.; CAVICHIOLI, F.A. Agronomic capability of mechanized sugarcane planting. Australian Journal Crop Science, Lismore, v.8, n.10, p.1448-1460, 2014.
WISSMANN, M.A.; OYAMADA, G.C.; WESENDONCK, C.C.; SBIKIDA, P.F.A. Evolução do cultivo de cana-de-açúcar na região Centro-Oeste do Brasil. Revista Brasileira de