ABSTRACT
RESUMO
Submitted on 01/21/2013 and aproved on 04/24/ 2015.
1Study financed by FAPEMIG (APQ-02395-10).
2 Universidade Federal de Viçosa, Florestal, Minas Gerais, Brazil. [email protected]; [email protected] 3Universidade Federal de Viçosa, Florestal, Minas Gerais, Brazil. [email protected]; [email protected] 4 Universidade Federal de Viçosa, Viçosa, Minas Gerais, Brazil. [email protected]; [email protected]
*Corresponding author: [email protected]
Acclimation of croton and hibiscus seedlings in response to the
application of indobultiric acid and humic acid for rooting
1The vegetative propagation of ornamental plants can be accelerated by applying plant growth regulators. Amongst them, the use of auxins, plant hormones with physiological effects on cell elongation and rooting have stood out. Alternatively, the application of humic acids, bioactive fraction of soil organic matter, also results in increases in rooting cuttings of ornamental plants. The objective of this work was to study the growth characteristics and the nutritional contents of croton and hibiscus plants during acclimation of seedlings in response to different concentrations of indolebutyric acid (IBA) and humic acid (HA) applied to cuttings for rooting. The experiment was conducted in greenhouse, and the apical stem cuttings were treated with solutions with concentrations of 0, 250, 500, 1000 and 2000 mg L-1of IBA and 0, 10, 20, 30 and 40 mg L-1 of C from HA. At 45 days of rooting in carbonized
rice husk, they were individually transferred to plastic bags of 2.0 dm3 containing a mixture of soil: sand: manure (2:
1: 1) as substrate. At 90 days of acclimation, the plants were collected for measurement of growth and nutritional variables. The results showed that the application of the IBA stimulates the absorption of nutrients and growth of croton cuttings and transplanted hibiscus, contributing to formation of vigorous seedlings. A similar response occurred with the application of HA in hibiscus cuttings.
Key words: Codianeum variegatum, Hibiscus rosa-sinensis, floriculture, soil organic matter, plant propagation. Lílian Estrela Borges Baldotto2, Marihus Altoé Baldotto*2, Matheus Pereira Simões3,
Reges Rodrigues de Oliveira3, Hermínia Emília Prieto Martinez4, Vitor Hugo Alvarez Venegas4
http://dx.doi.org/10.1590/0034-737X201562030008
Aclimatação de mudas de cróton e hibisco em resposta à aplicação de ácido indolbutírico e
ácido húmico para enraizamento
A propagação vegetativa de plantas ornamentais pode ser acelerada por meio da aplicação de reguladores de crescimento. Dentre eles, vêm-se destacando o uso de auxinas, hormônios vegetais com efeitos fisiológicos no alongamento celular e no enraizamento adventício. Alternativamente, a aplicação de ácidos húmicos, fração bioativa da matéria orgânica do solo, também resulta em incrementos na formação de raízes de estacas de plantas ornamen-tais. O objetivo deste trabalho foi estudar as características de crescimento e os teores nutricionais das plantas de cróton e hibisco, durante a aclimatação das mudas, em resposta a diferentes concentrações de ácido indolbutírico (AIB) e de ácido húmico (AH), aplicados para o enraizamento adventício das estacas. O experimento foi conduzido em viveiro, sendo as estacas caulinares apicais tratadas com soluções de concentrações iguais a 0, 250, 500, 1000 e 2000 mg L-1 de AIB e de 0, 10, 20, 30 e 40 mg L-1 de C de AH. Aos 45 dias de enraizamento das estacas no substrato
INTRODUCTION
According to Ibraflor (2012), the area used for growing plants and ornamental flowers all over Brazil is 12 thousand hectares, with around nine thousand farmers and a farm average size of 1.5 hectares. This creates 194,000 direct jobs, of which, 96,000 (49.5%) are related to production, 6,000 (3.1%) are related with distribution, 77,000 (39.7%) are distributed in retail and 15,000 (7.7%) in other functions, especially support, and with a per capita consumption of R$ 20.00 per inhabitant.
With the objective of increasing yield and optimization of acclimation phase of ornamental seedlings, the following has been studied: the use of fitted substrates (Yamamoto et al., 2007; Lima et al., 2008) and containers (Cunha et al., 2005), the association between plants with micorhizal fungi and diazotrophic bacteria (Weber et al., 2003; Baldotto, 2010), the use of growth regulators (Lima et al., 2008), among others. The objective of such efforts is to accelerate plant growth and to reduce the impact of transference from nursery to the field, increasing yield and seedling quality in less time and at lower costs.
Amongst ornamental plants, it stood out species used for its blooming foliage, such as croton, and flower-producer species, hibiscus, for example. Croton (Codianeum variegatum L. Rumph) of the Euphorbiaceae family is a set of semi-hardwood shrubs with 2.0 to 3.0 m of height, latescent, leathery and very attractive leaves, due to their size and shape (Lorenzi & Souza, 2008). Hibiscus (Hibiscus rosa-sinensis L.), belongs to Malvaceae Family, is a group of hardwood shrubs, with solitary and red, pink or white flowers, formed all over the year (Lorenzi & Souza, 2008). Because such plants are very appreciated by the population, they need fast propagation methods, with low cost and that assures the formation of vigorous, high-quality seedlings.
Therefore, plant propagation by cuttings is a proper method since it allows obtaining a great amount of even, early seedlings with genetic characteristics of the matrix plant (Hartmann e t a l., 2002). Adventitious rooting of cuttings involves the action of auxins, plant hormones transported to the base of the cutting, which act on the formation of meristematic centers, inducing root formation (Hartmann et al., 2002). Synthetic auxins, plant growth regulators, such as indobultiric acid (IBA) are used to promote rooting of ornamental plant cuttings at commercial scale (Lima e t a l., 2008). The application of humic acid, the bioactive fraction of humificated organic matter in ornamental plant cuttings may promote the adventitious rooting, which is another technological option (Baldotto et al., 2012).
Humic acid (HA) is formed by heterogeneous molecular aggregates and stabilized by hydrogen bonds and hydrophobic interactions (Piccolo, 2001). It acts in the growth and development of many plants for agronomic purposes. Those effects are reflected in the acceleration of the development of roots and aerial part (Canellas et al., 2006; Baldotto et al., 2009; Silva et al., 2011; Baldotto et al., 2012).
The objective of this work was to study the growth characteristics and nutritional contents of croton and hibiscus plants over seedling acclimation in response to the concentrations of indobultiric acid (IBA) and humic acid (HA) applied over adventitious rooting of the cuttings.
MATERIAL AND METHODS
Plant material
Cuttings were made from branches of “brasileirinho” croton matrix plants (Codianeum variegatum L. Rumph) and red-flower hibiscus (Hibiscus rosa-sinensis L.), found in the Flower Farming Sector of the Universidade contendo, como substrato, uma mistura de solo: areia: esterco (2:1:1). Aos 90 dias de aclimatação, as plantas foram coletadas para mensuração das variáveis de crescimento e nutricionais. Os resultados permitiram concluir que a aplicação de AIB estimula a absorção de nutrientes e o crescimento das estacas de cróton e de hibisco transplanta-das, contribuindo para formação de mudas vigorosas. Resposta semelhante aconteceu com a aplicação de AH ape-nas em estacas de hibisco.
Federal de Viçosa, Florestal Campus, located in Flores-tal, MG.
The apical stem semi-hardwood cuttings were collected in September, sectioned at 15 cm of length and four apical leaves were maintained.
Treatments
The experimental matrix (5 + 5) consisted of the following study factors for each plant species (croton and hibiscus): five concentrations (0, 250, 500, 1000, 2000 mg L-1) of indobultiric acid (IBA) and five
concentrations (0, 10, 20, 30, 40 mmol L-1 of carbon)
from the humic acid (HA).
Humic acid was isolated from vermicompounds and previously characterized by Baldotto et al. (2007) and Busato (2008). The bases of the cuttings were soaked in solutions of HA for 24 hours (Baldotto et al., 2009), and in solutions of IBA for ten seconds (Lima et al., 2008). For this procedure, the cuttings were placed in plastic glasses with 50 mL of the solutions corresponding to the different treatments (Baldotto et al., 2012).
After 45 days of rooting in substrate of carbonized rice husks, the cuttings were individually transferred to 2.0 dm3 black plastic bags, containing a mixture of
soil:sand: manure (2:1:1) as substrate, chemically characterized by the following: SOM = 26 dag kg-1;
pH (H2O) = 5.3; P (Mehlich-1) = 120.0 mg dm-3; K =
118.0 mg dm-3; Ca2+ = 22.9 cmol
c dm-3; Mg2+ = 1.7
cmolc dm-3; Al3+ = 0.4 cmol
c dm-3, and H+Al = 3.80
cmolc dm-3.
Seedlings were in the nursery covered by polyethylene mesh in 50% for acclimation. The experi-mental unit was one plant per plastic bag. The experiment was carried out in a random block design, with five replicates, totalling 100 experimental units.
Growth analysis
At 90 days of acclimation, plants were collect for measurement of the following variables: plant height (H), measured by distance from the plant collar to the leaf apex, using a meter tape; crown diameter (CRD); stem diameter (STD), measured using a digital model Starret 727 pachimeter; number of leaves (NL); root fresh matter mass (RFM) and aerial part fresh matter (APFM); root dry matter mass (RDM) and aerial part dry matter (APDM), obtained by drying in air ventilation oven at 60
oC for seven days and then weighed.
Nutritional analysis
After drying, leaves were ground in a Wiley-type mill, coupled to a 60-mesh wire cm-2. Then, the resulting
powder was submitted to sulphuric digestion combined
with hydrogen peroxide for determination of total contents of nitrogen (N), phosphorus, (P), potassium (K), calcium (Ca) and magnesium (Mg), sulphur (S), zinc (Zn), iron (Fe), manganese (Mn), copper (Cu) and boron (B). The Nessler method was used for N; content of P was obtained by molecular absorption spectrophotometry (colorimetry), after reaction with C vitamin and ammonium molybdate at the wavelength of 725 nm; K was determined by flame photometry. Contents of Ca, Mg, Cu, Fe, Mn and Zn were all obtained by molecular absorption spectrophotometry and content of S was achieved by turbidimetry and B was determined by colorimetry (Embrapa, 2009).
Statistical analysis
The evaluation results were submitted to analysis of variance and the treatment effects, for qualitative analysis, were unfolded in average contrasts, according to Alvarez & Alvarez (2006). For quantitative factors, the regression equations were adjusted among the assessed variables and concentrations of IBA and HA. The F test and factor unfolding were applied between 1, 5 and 10% of probability. Regarding regression analysis, the angular coefficients of the equations were tested when presented determination coefficient higher than 0.60. Regression equations were used to determine concentration of maximum physical efficiency of aerial part dry matter, in function of the concentrations of IBA and HA. Values of maximum efficiency concentration were replaced in the regression equation of each variable to estimate them for this condition.
RESULTS AND DISCUSSION
Growth analysis
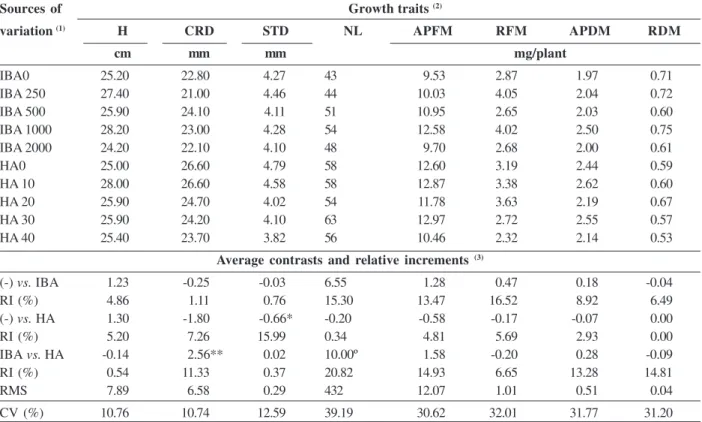
The results of the growth analyses of croton plants at 90 days of acclimatation, in response to the application of IBA and HA, revealed some modifications in the initial performance, when differences among means (Table 1) were found in the average contrasts (Table 1) and in the regression equations (Table 2) adjusted for the plant growth data in response to the application of plant regulators.
formation of adventitious roots, allowing this species to be classified as one with easy vegetative propagation by cutting (Baldotto et al., 2012), which can be seen in the acclimation period, when there is a lack of differences during growth among plants treated or not with IBA or HA. According to Trewavas & Cleland (1983), the low effect with the application of growth regulator may point to the low tissue sensitivity to the presence of the pro-motor, in addition to the high endogenous concentration of auxin.
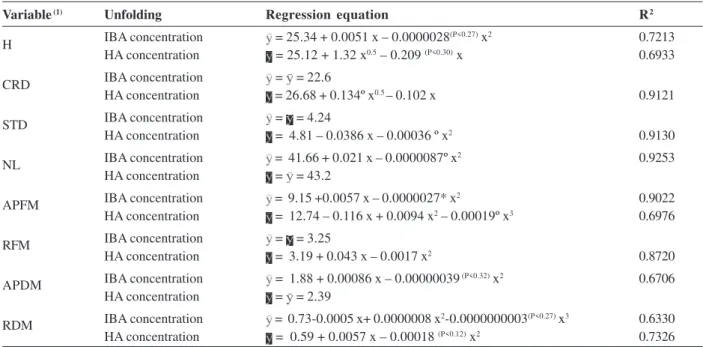
Most of the regression equations adjusted among dependent variables (growth traits) and increasing concentrations of plant regulators (IBA and HA), were curvilinear (quadratic, quadratic roots, cubic and cubic roots) for growth variables in the aerial part and in the roots of croton (Table 2). The variable chosen for identification of the maximum concentration of physical efficiency (MFE) was the dry matter of the aerial part. Regarding IBA, the concentration that provided MFE of aerial part dry matter was 1089.37 mg L-1 and for HA, due to the lack of adjustment, the
MFE concentration was estimated by the mean of values of the aerial part dry matter (Table 2). Concentrations of MFE were replaced in the regression equation for
each variable in Table 2, in order to calculate it for this condition. It was found that the treatment with IBA incremented height (9.40%), crown diameter (0.88%), stem diameter (0.71%), number of leaves (26%), aerial part dry matter mass (27.60%), root fresh matter mass (13.24%) and root dry matter mass (5.63%) in croton plants.
In hibiscus, the results of growth analysis in response to the application of increasing concentrations of IBA and HA showed the effects of those plant regulators (Table 3). The average contrasts (Table 3) showed that the treated hibiscus plants were superior than the control ones for crown diameter, root fresh matter mass and root dry matter mass with IBA; and crown diameter and root fresh matter mass with HA. It can also be seen in this table that the comparison among the plant regulators showed that the use of IBA incremented all variables in comparison to HA, except crown diameter. Indobultiric acid is a synthetic product that, at proper concentrations, acts in the formation of meristematic centers and adventitious roots (Hartmann et al., 2002; Pizzatto et al., 2011; Baldotto et al., 2012), which favours dry mater accumulation in the root system during seedling acclimatation. Similarly, HA
Table 1. Means, average contrasts, relative increments (RI), residual mean square (RMS) and coefficient of variation (CV) for growth
traits of croton plants at 90 days of acclimation in response to the application of indobultiric acid (IBA) and humic acid (HA) applied in five concentrations (0, 250, 500, 1000, 2000 mg L-1 of IBA and 0, 10, 20, 30, 40 mmol L-1 of C from HA), carried out in the random block
design with 5 replicates.
Sources of Growth traits (2)
variation (1) H CRD STD NL APFM RFM APDM RDM
cm mm mm mg/plant
IBA0 25.20 22.80 4.27 43 9.53 2.87 1.97 0.71
IBA 250 27.40 21.00 4.46 44 10.03 4.05 2.04 0.72
IBA 500 25.90 24.10 4.11 51 10.95 2.65 2.03 0.60
IBA 1000 28.20 23.00 4.28 54 12.58 4.02 2.50 0.75
IBA 2000 24.20 22.10 4.10 48 9.70 2.68 2.00 0.61
HA0 25.00 26.60 4.79 58 12.60 3.19 2.44 0.59
HA 10 28.00 26.60 4.58 58 12.87 3.38 2.62 0.60
HA 20 25.90 24.70 4.02 54 11.78 3.63 2.19 0.67
HA 30 25.90 24.20 4.10 63 12.97 2.72 2.55 0.57
HA 40 25.40 23.70 3.82 56 10.46 2.32 2.14 0.53
Average contrasts and relative increments (3)
(-) vs. IBA 1.23 -0.25 -0.03 6.55 1.28 0.47 0.18 -0.04
RI (%) 4.86 1.11 0.76 15.30 13.47 16.52 8.92 6.49
(-) vs. HA 1.30 -1.80 -0.66* -0.20 -0.58 -0.17 -0.07 0.00
RI (%) 5.20 7.26 15.99 0.34 4.81 5.69 2.93 0.00
IBA vs. HA -0.14 2.56** 0.02 10.00º 1.58 -0.20 0.28 -0.09
RI (%) 0.54 11.33 0.37 20.82 14.93 6.65 13.28 14.81
RMS 7.89 6.58 0.29 432 12.07 1.01 0.51 0.04
CV (%) 10.76 10.74 12.59 39.19 30.62 32.01 31.77 31.20
(1)Sources of variation show plant regulator and concentrations; (-) = control; IBA = indobultiric acid; HA = humic acid. (2)Growth traits: H = height; CRD = crown diameter; STD
= stem diameter; NL = number of leafs; APFM = aerial part fresh matter mass; RFM = root fresh matter; APDM = aerial part dry matter mass; RDM = root dry matter. (3)Average
Table 3. Means, average contrasts, relative increments (RI), residual mean square (RMS) and coefficient of variation (CV) for growth
traits of hibiscus plants at 90 days of acclimation in response to the application of indobulitiric acid (IBA) and humic acid (HA) applied in five concentrations (0, 250, 500, 1000, 2000 mg L-1 of IBA and 0, 10, 20, 30, 40 mmol L-1 of C from HA), carried out in random block
design with 5 replicates
Growth traits (2)
H CRD STD NL APFM RFM APDM RDM
cm mm mm mg/plant
IBA0 28.88 24.50 4.78 51 18.84 2.14 4.19 0.67
IBA 250 27.60 31.20 5.03 51 24.70 5.16 3.99 1.03
IBA 500 30.20 27.00 4.83 42 20.42 6.63 4.02 1.65
IBA 1000 35.80 27.20 5.03 40 19.86 4.76 3.99 1,07
IBA 2000 36.25 26.00 4.92 60 20.49 2.68 4.59 0.76
HA0 30.86 24.69 4.15 35 13.25 0.84 3.02 0.38
HA 10 30.23 28.86 3.92 41 13.28 1.89 2.62 0.45
HA 20 30.01 30.67 4.25 48 20.97 3.77 4.32 0.83
HA 30 39.20 32.80 5.12 47 24.72 6.19 4.93 0.99
HA 40 29.68 28.50 4.31 45 16.41 2.69 3.42 0.47
Average contrasts and relative increments (3)
(-) vs. IBA 3.59 3.35º 0.17 -2.43 2.53 2.67* -0.04 0.46º
RI (%) 12.42 13.67 3.53 5.04 13.40 124.41 0.98 69.72
(-) vs. HA 1.42 5.52** 0.25 10.26 5.60 2.79* 0.80 0.30
RI (%) 4.60 22.35 6.08 29.32 42.23 331.09 26.43 79.88
IBA vs. HA 0.25 1.92º -0.57** -5.38 -3.14 -1.20º -0.49 -0.41**
RI (%) 0.80 7.08 13.11 12.45 17.69 38.89 13.33 66.04
RMS 42.09 15.53 0.43 150 56.47 5.90 1.74 0.24
CV (%) 20.35 14.01 14.10 26.69 38.95 66.07 33.73 59.28
(1)Sources of variation: show the plant regulators and the concentrations; (-) = control; IBA = indobultiric acid; HA = humic acid. (2)Growth traits: H = height; CRD = crown diameter;
STD = stem diameter; NL = number of leaves; APFM = aerial part fresh matter mass; RFM = root fresh matter mass; APDM = aerial part dry matter mass; RDM = root dry matter mass. (3)Average contrasts: control versus IBA; control versus HA; IBA versus HA; Relative increments: 100 (x-y)/y, where x is the mean in the treatment with the highest value and
y is the mean of the treatment with the lowest value. **, * and º = significant among 1, 5 and 10% of probability by the F test.
Sources of variation (1)
Table 2. Regression equations for growth traits of croton plants at 90 days of acclimation in response to the application of indobultiric
acid (IBA) and humic acid (HA) applied in five concentrations(0, 250, 500, 1000, 2000 mg L-1 of IBA and 0, 10, 20, 30, 40 mmol L-1 of
C from HA)
Variable (1) Unfolding Regression equation R2
IBA concentration = 25.34 + 0.0051 x – 0.0000028(P<0.27) x2 0.7213
HA concentration = 25.12 + 1.32 x0.5 – 0.209 (P<0.30) x 0.6933
IBA concentration = = 22.6
HA concentration = 26.68 + 0.134º x0.5 – 0.102 x 0.9121
IBA concentration = = 4.24
HA concentration = 4.81 – 0.0386 x – 0.00036 º x2 0.9130
IBA concentration = 41.66 + 0.021 x – 0.0000087º x2 0.9253
HA concentration = = 43.2
IBA concentration = 9.15 +0.0057 x – 0.0000027* x2 0.9022
HA concentration = 12.74 – 0.116 x + 0.0094 x2 – 0.00019º x3 0.6976
IBA concentration = = 3.25
HA concentration = 3.19 + 0.043 x – 0.0017 x2 0.8720
IBA concentration = 1.88 + 0.00086 x – 0.00000039 (P<0.32) x2 0.6706
HA concentration = = 2.39
IBA concentration = 0.73-0.0005 x+ 0.0000008 x2-0.0000000003(P<0.27) x3 0.6330
HA concentration = 0.59 + 0.0057 x – 0.00018 (P<0.12) x2 0.7326
(1)Variable: H = height (cm); CRD = crown diameter (mm); STD = stem diameter (mm); NL = number of leaves; APFM = aerial part fresh matter mass (mg/
plant); RMF = root fresh matter (mg/plant); APDM = aerial part dry matter mass (mg/plant); RDM = root dry matter mass (mg/plant); *,º and P =
significant between 5, 10 and P% of probability. H
CRD
STD
NL
APFM
RFM
APDM
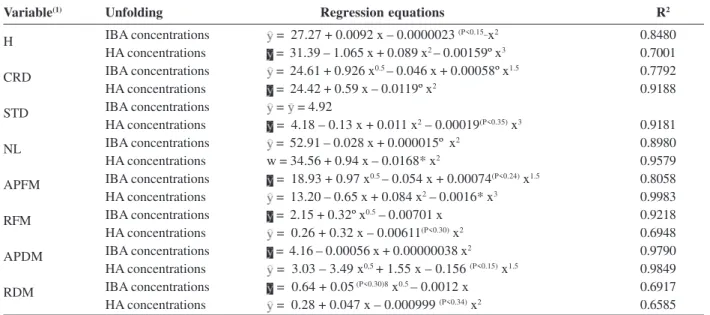
Table 4. Regression equations for growth traits of hibiscus plants at 90 days of acclimation in response to the application of indobultiric
acid (IBA) and humic acid (HA) applied at five concentrations (0, 250, 500, 1000, 2000 mg L-1 of IBA and 0, 10, 20, 30, 40 mmol L-1 of
C from HA)
Variable(1) Unfolding Regression equations R2
IBA concentrations = 27.27 + 0.0092 x – 0.0000023 (P<0.15_x2 0.8480
HA concentrations = 31.39 – 1.065 x + 0.089 x2 – 0.00159º x3 0.7001
IBA concentrations = 24.61 + 0.926 x0.5 – 0.046 x + 0.00058º x1.5 0.7792
HA concentrations = 24.42 + 0.59 x – 0.0119º x2 0.9188
IBA concentrations = = 4.92
HA concentrations = 4.18 – 0.13 x + 0.011 x2 – 0.00019(P<0.35) x3 0.9181
IBA concentrations = 52.91 – 0.028 x + 0.000015º x2 0.8980
HA concentrations w = 34.56 + 0.94 x – 0.0168* x2 0.9579
IBA concentrations = 18.93 + 0.97 x0.5 – 0.054 x + 0.00074(P<0.24) x1.5 0.8058
HA concentrations = 13.20 – 0.65 x + 0.084 x2 – 0.0016* x3 0.9983
IBA concentrations = 2.15 + 0.32º x0.5 – 0.00701 x 0.9218
HA concentrations = 0.26 + 0.32 x – 0.00611(P<0.30) x2 0.6948
IBA concentrations = 4.16 – 0.00056 x + 0.00000038 x2 0.9790
HA concentrations = 3.03 – 3.49 x0,5 + 1.55 x – 0.156 (P<0.15) x1.5 0.9849
IBA concentrations = 0.64 + 0.05 (P<0.30)8 x0.5 – 0.0012 x 0.6917
HA concentrations = 0.28 + 0.047 x – 0.000999 (P<0.34) x2 0.6585
(1) Variable: H = height (cm); CRD = crown diameter (mm); STD = stem diameter (mm); NL = number of leaves; APFM = aerial part fresh matter mass (mg);
RFM = root fresh matter mass (mg); APDM = aerial part dry matter mass (mg); RDM = root dry matter mass (mg); *,º and P = significant between 5, 10
and P % of probability. H
CRD
STD
NL
APFM
RFM
APDM
RDM
Sources of variation(1)
Table 5. Means, relative increments (RI), residue mean square (RMS) and coefficient of variation (CV) for nutritional contents of
croton plants at 90 days of acclimation in response to the application of indobultiric acid (IBA) and humic acid (HA), applied at five concentrations(0, 250, 500, 1000, 2000 mg L-1 of IBA and 0, 10, 20, 30, 40 mmol L-1 of C from HA), performed in a random block design
with 5 replicates
Nutritional Contents (2)
N P K Ca Mg S Zn Fe Mn Cu B
dag kg-1 mg kg-1
IBA0 2.25 0.45 1.01 2.01 0.69 0.18 60.00 1542.00 97.00 14.33 98.57
IBA 250 2.53 0.55 1.24 2.17 0.73 0.30 77.33 3363.67 98.33 17.67 182.37
IBA 500 2.96 0.65 1.23 2.41 0.78 0.27 85.00 2312.67 109.33 20.33 130.13
IBA 1000 2.48 0.48 1.09 1.69 0.68 0.24 54.67 2662.67 98.00 17.33 116.07
IBA 2000 2.57 0.56 1.29 1.91 0.69 0.21 81.00 1509.33 79.67 17.33 111.93
HA0 2.67 0.49 1.15 1.81 0.66 0.24 61.00 2369.33 97.00 12.33 126.13
HA10 3.04 0.53 1.60 1.96 0.65 0.26 73.00 1408.00 90.33 18.00 103.13
HA20 2.69 0.52 2.68 1.93 0.68 0.40 57.33 3214.67 96.33 12.00 94.00
HA30 2.90 0.58 2.81 2.18 0.72 0.37 61.67 2526.33 94.00 17,.33 115.87
HA40 2.96 0.63 2.25 1.95 0.72 0.47 79.33 1837.67 105.00 23.00 117.47
Average contrasts and relative increments (3)
(-) vs. IBA 0.39** 0.11* 0.20 0.04 0.03 0.07** 14.50 920.08** -0.67 3.83 36.56*
RI (%) 17.19 25.19 19.74 1.99 4.11 37.73 24.17 59.67 0.69 26.74 37.09
(-) vs. HA 0.23** 0.07* 1.19** 0.20* 0.04º 0.14** 6.83 -122.67 -0.58 5.25* -18.52º
RI (%) 8.66 15.31 103.78 10.93 5.46 59.51 11.20 -5.18 -0.60 42.57 17.21
IBA vs. HA 0.29** 0.01 0.93** -0.07 -0.03 0.11** -5.13 -6.87 0.07 -0.87 -16.49º
RI (%) 11.41 2.48 78.86 3.77 3.99 46.37 7.72 0.30 0.07 5.24 14.82
RMS 0.07 0.01 0.11 0.00 0.00 0.00 237.97 288612.90 379.97 34.53 952.35
CV (%) 10.08 15.62 19.82 11 8.04 11.47 22.35 23.62 20.20 34.63 25.81
(1)Sources of variation: show the plant regulators and the concentrations; (-) = control; IBA = indobultiric acid; HA = humic acid. (2)Nutritional
contents: correspond to contents of N = nitrogen; P = phosphorus; K = potassium; Ca = calcium; Mg = magnesium; S = sulphur; Zn = zinc; Fe = iron; Mn = manganese; Cu = copper and B = boron. (3)Average contrasts: control versus IBA; control versus HA; IBA versus HA; Relative increments: 100
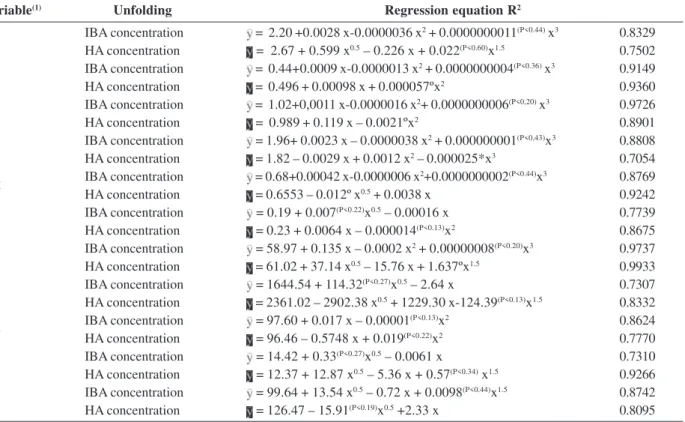
Table 6. Regression equations for nutritional contents of croton plants at 90 days of acclimatation in response to the application of indobultiric acid (IBA) and humic acid applied at five concentrations (0, 250, 500, 1000, 2000 mg L-1 of IBA and 0, 10, 20, 30, 40 mmol
L-1 of C from HA)
Variable(1) Unfolding Regression equation R2
IBA concentration = 2.20 +0.0028 x-0.0000036 x2 + 0.0000000011(P<0.44) x3 0.8329
HA concentration = 2.67 + 0.599 x0.5 – 0.226 x + 0.022(P<0.60)x1.5 0.7502
IBA concentration = 0.44+0.0009 x-0.0000013 x2 + 0.0000000004(P<0.36) x3 0.9149
HA concentration = 0.496 + 0.00098 x + 0.000057ºx2 0.9360
IBA concentration = 1.02+0,0011 x-0.0000016 x2+ 0.0000000006(P<0,20) x3 0.9726
HA concentration = 0.989 + 0.119 x – 0.0021ºx2 0.8901
IBA concentration = 1.96+ 0.0023 x – 0.0000038 x2 + 0.000000001(P<0,43)x3 0.8808
HA concentration = 1.82 – 0.0029 x + 0.0012 x2 – 0.000025*x3 0.7054
IBA concentration = 0.68+0.00042 x-0.0000006 x2+0.0000000002(P<0.44)x3 0.8769
HA concentration = 0.6553 – 0.012º x0.5 + 0.0038 x 0.9242
IBA concentration = 0.19 + 0.007(P<0.22)x0.5 – 0.00016 x 0.7739
HA concentration = 0.23 + 0.0064 x – 0.000014(P<0.13)x2 0.8675
IBA concentration = 58.97 + 0.135 x – 0.0002 x2 + 0.00000008(P<0.20)x3 0.9737
HA concentration = 61.02 + 37.14 x0.5 – 15.76 x + 1.637ºx1.5 0.9933
IBA concentration = 1644.54 + 114.32(P<0.27)x0.5 – 2.64 x 0.7307
HA concentration = 2361.02 – 2902.38 x0.5 + 1229.30 x-124.39(P<0.13)x1.5 0.8332
IBA concentration = 97.60 + 0.017 x – 0.00001(P<0.13)x2 0.8624
HA concentration = 96.46 – 0.5748 x + 0.019(P<0.22)x2 0.7770
IBA concentration = 14.42 + 0.33(P<0.27)x0.5 – 0.0061 x 0.7310
HA concentration = 12.37 + 12.87 x0.5 – 5.36 x + 0.57(P<0.34) x1.5 0.9266
IBA concentration = 99.64 + 13.54 x0.5 – 0.72 x + 0.0098(P<0.44)x1.5 0.8742
HA concentration = 126.47 – 15.91(P<0.19)x0.5 +2.33 x 0.8095
(1)Variable: corresponds to the contents of N = nitrogen; P = phosphorus; K = potassium; Ca = calcium; Mg = magnesium; S = sulphur; Zn = zinc; Fe
= iron; Mn = manganese; Cu = copper and B = boron; *,º and P = significant among 5, 10 and P % of probability.
N
P
K
Ca
Mg
S
Zn
Fe
Mn
Cu
B
also stimulated root emergence (Silva et al., 2011), with variation in its effect according to the plant species, to the source and to the concentration used (Canellas et al., 2006; Baldotto et al., 2009; Baldotto et al., 2012). Plants with more vigorous root system tolerate better environmental conditions with water stress and low content of available nutrients (Fitter, 1991) therefore, the use of plant regulators during propagation of hibiscus plants by cutting results in better fitted plants for field planting.
The regression equations adjusted for growth of hibiscus plants in response to concentrations of IBA and HA are in Table 4. They were, mostly, curvilinear (quadratic, quadratic roots, cubic, cubic root) for growth of roots and aerial section in hibiscus. It was not possible to adjust regression equation only for crown diameter for IBA treated plants and the mean among the dots in the curve was estimated.
The concentrations that resulted in the greatest accumulation of aerial part dry matter mass in hibiscus plants, that is, the most efficient ones for a seedling with more reserves, were 977.77 mg L-1 of IBA and 26.83
mmol L-1 of C in the form of HA. The rapid accumulation
of dry matter in the shoots is desirable to guarantee energy for the post-planting (Lorenzi & Souza, 2008).
Nutritional status
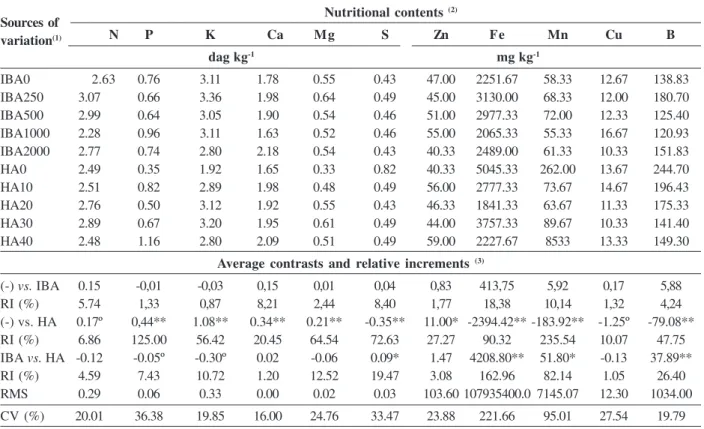
Nutritional contents of croton plants at 90 days of acclimation ranged in response to the application of IBA and AH (Table 5). There was a better performance of IBA treated plants than the ones treated with HA and control. The use of IBA in croton plants increased contents of N, P, S, Fe and B, when compared to control (Table 5). In the same table, it is found that the use of HA resulted in the increase in N, P, K, Ca, Mg, S and Cu, as the contents of B decreased when compared to the control. Overall, when the two plant regulators were compared, it was found that the contents of macronutrients N, K, and S achieved their peak when HA was applied, compared to IBA, which was superior only for the content of B.
Regression equations were calculated for nutritional contents of croton plants (Table 6) in response to concentrations of plant regulators. The ways of response found in the experiment were, mostly, curvilinear (quadratic, quadratic roots, cubic, cubic roots) with good adjustments (R > 0.70) and most of them showed positive increment rates.
substances comprehends the activity of ATPases, enzymes related to both absorption of nutrients such as “acid growth”, mechanisms that have been used to explain its bioactivity (Canellas et al., 2006). Humic acid also stimulates the formation of root hair (Silva et al., 2011), increasing the absorption area of nutrients by the roots.
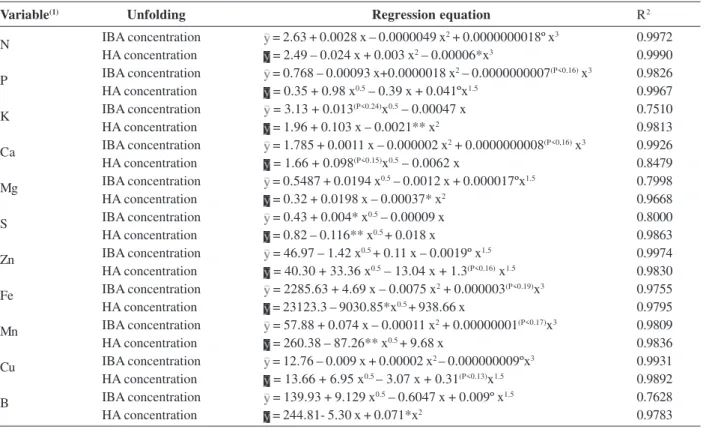
The regression equations for contents of plant nutrients in function of the increasing concentrations of IBA and HA are presented in Table 8. The variable chosen to estimate the concentration of maximum physical efficiency was aerial part dry matter mass, whose values were 977.77 mg L-1 for IBA and 26.83 mmol L-1 of C,
for HA. Such concentration of HA resulted in an accumulation of dry matter 61% higher than the control. Significant effect for IBA was not found. Humic acid acts in the formation of meristematic centers, especially in the formation of adventitious root, which, in turn, increment the nutrient absorption and plant growth. Thus, the results obtained show that the use of HA in hibiscus cuttings accelerates plant growth in seedling acclimation. The efficiency of propagation benefits production and commercialization of ornamental plants.
Concentrations of IBA and HA of MFE were replaced in the regression equations of each variable of Table 8, to estimate them for that condition. It was found that the treatment with HA incremented contents of P (89%), K (67%), Ca (21%), Mg (76%), S (132%) and Zn (9%). The use of IBA also resulted in a greater accumulation of some nutrients than in the control, but this better nutritional composition was not converted into greater content of dry matter.
Finally, the results show that seedling production of croton and hibiscus by using synthetic hormones and bioactive fractions of organic matter (IBA and HA) is an efficient alternative since propagation of croton by cuttings for seedling production was benefited with the application of IBA, which incremented the nutritional status when compared to the control. In addition, for hibiscus, both stimulants presented positive effects in growth and seedling development.
The results support data of Baldotto et al. (2012), in the rooting phase of seedlings of croton and hibiscus. Therefore, the effect in rooting leads to a greater efficiency in the following phase, acclimation of seedlings of those ornamental plants.
Sources of variation(1)
Table 7. Nutritional contents of hibiscus plants at 90 days of acclimation in response to the application of indolbutiruc acid (IBA) and
humic acid (HA) applied in five concentrations (0, 250, 500, 1000, 2000 mg L-1of IBA and 0, 10, 20, 30, 40 mmol L-1 of C from HA),
carried out in a random block design with 5 replicates
Nutritional contents (2)
N P K Ca Mg S Zn Fe Mn Cu B
dag kg-1 mg kg-1
IBA0 2.63 0.76 3.11 1.78 0.55 0.43 47.00 2251.67 58.33 12.67 138.83
IBA250 3.07 0.66 3.36 1.98 0.64 0.49 45.00 3130.00 68.33 12.00 180.70
IBA500 2.99 0.64 3.05 1.90 0.54 0.46 51.00 2977.33 72.00 12.33 125.40
IBA1000 2.28 0.96 3.11 1.63 0.52 0.46 55.00 2065.33 55.33 16.67 120.93
IBA2000 2.77 0.74 2.80 2.18 0.54 0.43 40.33 2489.00 61.33 10.33 151.83
HA0 2.49 0.35 1.92 1.65 0.33 0.82 40.33 5045.33 262.00 13.67 244.70
HA10 2.51 0.82 2.89 1.98 0.48 0.49 56.00 2777.33 73.67 14.67 196.43
HA20 2.76 0.50 3.12 1.92 0.55 0.43 46.33 1841.33 63.67 11.33 175.33
HA30 2.89 0.67 3.20 1.95 0.61 0.49 44.00 3757.33 89.67 10.33 141.40
HA40 2.48 1.16 2.80 2.09 0.51 0.49 59.00 2227.67 8533 13.33 149.30
Average contrasts and relative increments (3)
(-) vs. IBA 0.15 -0,01 -0,03 0,15 0,01 0,04 0,83 413,75 5,92 0,17 5,88
RI (%) 5.74 1,33 0,87 8,21 2,44 8,40 1,77 18,38 10,14 1,32 4,24
(-) vs. HA 0.17º 0,44** 1.08** 0.34** 0.21** -0.35** 11.00* -2394.42** -183.92** -1.25º -79.08**
RI (%) 6.86 125.00 56.42 20.45 64.54 72.63 27.27 90.32 235.54 10.07 47.75
IBA vs. HA -0.12 -0.05º -0.30º 0.02 -0.06 0.09* 1.47 4208.80** 51.80* -0.13 37.89**
RI (%) 4.59 7.43 10.72 1.20 12.52 19.47 3.08 162.96 82.14 1.05 26.40
RMS 0.29 0.06 0.33 0.00 0.02 0.03 103.60 107935400.0 7145.07 12.30 1034.00
CV (%) 20.01 36.38 19.85 16.00 24.76 33.47 23.88 221.66 95.01 27.54 19.79
(1)Sources of variation: show the plant regulators and the concentrations. (2) Nutritional contents: correspond to the contents of N = nitrogen; P =
phosphorus; K = potassium; Ca = calcium; Mg = magnesium; S = sulphur; Zn = zinc; Fe = iron; MN = manganese; Cu = copper and B = boron. (2)
CONCLUSIONS
The results achieved in this experiment show that the response to application of plant regulators depends on plant genotype and concentration.
The use of IBA and HA at the indicated concentrations favours acclimation of hibiscus plants propagated by cutting, reducing production time of seedlings and benefiting production and commercialization of orna-mental plants.
Regarded to croton, the use of IBA at the indicated concentration is also recommended.
AKNOWLEDGEMENTS
The authors thank FAPEMIG (APQ-02395-10 and APQ-03929-10), CNPq (Proc. 470567/2011-2) and FUNARBE (Funarpeq 2011/2012), for financially supporting the producers, students, workers and professors who took part in the realization of these projects.
REFERENCES
Alvarez VVH & Alvarez GAM (2006) Comparações de médias ou testes de hipóteses? Contrastes! Boletim Informativo da Sociedade Brasi-leira de Ciência do Solo, 31:24-34.
Baldotto LEB, Baldotto MA, Soares RR, Martinez HEP & Venegas VHA
(2012)Adventitious rooting in cuttings of croton and hibiscus in
response to indolbutyric acid and humic acid. Revista Ceres, 59:476-483.
Baldotto LEB, Baldotto MA, Olivares FL, Viana AP & Bressan-Smith R (2010) Seleção de bactérias promotoras de crescimento no abacaxizeiro cultivar Vitória durante a aclimatização. Revista Brasi-leira de Ciência do Solo, 34:349-360.
Baldotto LEB, Baldotto MA, Giro VB, Canellas LP, Olivares FL & Bressan-Smith R (2009) Desempenho do abacaxizeiro ‘Vitória’ em resposta à aplicação de ácidos húmicos durante a aclimatação. Revista Brasilei-ra de Ciência do Solo, 33:979-990.
Baldotto MA, Canellas LP, Canela MC, Simões ML, Martin-Neto L, Fontes MPF & Velloso ACX (2007) Propriedades Redox e Grupos Funcionais de Ácidos Húmicos Isolados de Adubos Orgânicos. Revista Brasileira de Ciência do Solo, 31:465-475.
Busato JG (2008) Química do húmus e fertilidade do solo após adição de adubos orgânicos. Tese de Doutorado. Universidade Estadual do Norte Fluminense Darcy Ribeiro, Campos dos Goytacazes. 135p. Canellas LP, Zandonadi DB, Olivares FL & Façanha AR (2006) Efeitos
fisiológicos de substâncias húmicas - o estímulo às H+-ATPases. In:
Fernandes MS (Ed.) Nutrição Mineral de Plantas. Viçosa, Sociedade Brasileira de Ciência do Solo. 432p.
Cunha AO, Andrade LA, Bruno RLA, Silva JAL & Souza VC (2005) Efeitos de substratos e das dimensões dos recipientes na qualidade
das mudas de Tabebuia impetiginosa (Mart. Ex D.C.) Standl.
Revis-ta Árvore, 29:507-516.
Embrapa - Empresa Brasileira de Pesquisa Agropecuária (2009) Manual de análises químicas de solos, plantas e fertilizantes. 2ª ed. Brasília, Embrapa Informação Tecnológica. 627p.
N
P
K
Ca
Mg
S
Zn
Fe
Mn
Cu
B
Table 8. Regression equations for nutritional contents of hibiscus plants at 90 days of acclimation in response to the application of
indobultiric acid (IBA) and humic acid (HA) applied at five concentrations(0, 250, 500, 1000, 2000 mg L-1 of IBA and 0, 10, 20, 30, 40
mmol L-1 of C of AH)
Variable(1) Unfolding Regression equation R2
IBA concentration = 2.63 + 0.0028 x – 0.0000049 x2 + 0.0000000018º x3 0.9972
HA concentration = 2.49 – 0.024 x + 0.003 x2 – 0.00006*x3 0.9990
IBA concentration = 0.768 – 0.00093 x+0.0000018 x2 – 0.0000000007(P<0.16) x3 0.9826
HA concentration = 0.35 + 0.98 x0.5 – 0.39 x + 0.041ºx1.5 0.9967
IBA concentration = 3.13 + 0.013(P<0.24)x0.5 – 0.00047 x 0.7510
HA concentration = 1.96 + 0.103 x – 0.0021** x2 0.9813
IBA concentration = 1.785 + 0.0011 x – 0.000002 x2 + 0.0000000008(P<0,16) x3 0.9926
HA concentration = 1.66 + 0.098(P<0.15)x0.5 – 0.0062 x 0.8479
IBA concentration = 0.5487 + 0.0194 x0.5 – 0.0012 x + 0.000017ºx1.5 0.7998
HA concentration = 0.32 + 0.0198 x – 0.00037* x2 0.9668
IBA concentration = 0.43 + 0.004* x0.5 – 0.00009 x 0.8000
HA concentration = 0.82 – 0.116** x0.5 + 0.018 x 0.9863
IBA concentration = 46.97 – 1.42 x0.5 + 0.11 x – 0.0019º x1.5 0.9974
HA concentration = 40.30 + 33.36 x0.5 – 13.04 x + 1.3(P<0.16) x1.5 0.9830
IBA concentration = 2285.63 + 4.69 x – 0.0075 x2 + 0.000003(P<0.19)x3 0.9755
HA concentration = 23123.3 – 9030.85*x0.5 + 938.66 x 0.9795
IBA concentration = 57.88 + 0.074 x – 0.00011 x2 + 0.00000001(P<0.17)x3 0.9809
HA concentration = 260.38 – 87.26** x0.5 + 9.68 x 0.9836
IBA concentration = 12.76 – 0.009 x + 0.00002 x2 – 0.000000009ºx3 0.9931
HA concentration = 13.66 + 6.95 x0.5 – 3.07 x + 0.31(P<0.13)x1.5 0.9892
IBA concentration = 139.93 + 9.129 x0.5 – 0.6047 x + 0.009º x1.5 0.7628
HA concentration = 244.81- 5.30 x + 0.071*x2 0.9783
(1)Variable: corresponds to the contents of N = nitrogen; P = phosphorus; K = potassium; Ca = calcium; Mg = magnesium; S = sulphur; Zn = zinc; Fe
Fitter AH (1991) Characteristics and functions of root systems. In: Waisel Y, Eshel A & Kafkafi U (Eds.) Plant roots: The Hidden Half. New York, Marcel Dekker. p.03-24.
Hartmann HT, Kester DE, Davies RT & Geneve RL (2002) Plant propagation: principles and practices. 7ª ed. New Jersey, Prentice Hall. 880p.
Ibraflor - Instituto Brasileiro de Floricultura (2012) Release Imprensa. Available at: <http://www.ibraflor.com.br>. Accessed on: 14 de no-vembro de 2012.
Lima DM, Silva CL, Ritter M, Biasi LA, Zanette F & Zuffellato-Ribas KC (2008) Substratos e auxinas no enraizamento de estacas caulinares de espinheira-santa. Scientia Agraria, 9:85-89.
Lorenzi HE & Souza HM (2008) Plantas Ornamentais no Brasil: Arbustivas, Herbáceas e Trepadeiras. Nova Odessa, Instituto Plantarum. 1088p.
Piccolo A (2001) The Supramolecular Structure of Humic Substances. Soil Science, 166:810-832.
Pizzatto M, Wagner Júnior A, Luckmann D, Pirola K, Cassol DA & Mazaro SM (2011) Influência do uso do AIB, época de coleta e tama-nho de estaca na propagação vegetativa de hibisco por estaquia. Revista Ceres, 58:487-492.
Silva AC, Canellas LP, Olivares FL, Dobbss LB, Aguiar NO, Frade DAR, Rezende CE & Peres LEP (2011) Promoção do crescimento radicular de plântulas de tomateiro por substâncias húmicas isoladas de turfeiras. Revista Brasileira de Ciência do Solo, 35:1609-1617.
Trewavas AJ & Cleland RE (1983) Is plant development redulated by changes and the concentation of growth substances or by changes in the sensitivity of growth substances? Trends in Biochemical Sciences, 8:354-357.
Weber OB, Correia D, Rocha MW, Alvez GC, Oliveira EM & Sá EG (2003) Resposta de plantas micropropagadas de abacaxizeiro à inoculação de bactérias diazotróficas em casa de vegetação. Revista Agropecuária Brasileira, 38:1419-1426.