SUMMARY
The DNA from one hundred eight goats be-longing to the indigenous portuguese Algarvia breed was analysed. Single-strand conformation polymorphismÕs (SSCP) were identified at the five exons of the goat Growth Hormone (gGH) gene. Two conformational patterns were found in each of exons 1 and 2, four in exon 3, seven in exon 4 and five in exon 5. The establishment of an asso-ciation of these SSCP patterns with milk, fat and protein production, and fat and protein content was attempted. Patterns A, F and D of exons 2, 4 and 5, respectively, are positively associated with milk, fat and protein production (p<0.05). Pattern A of exon 2 is also positively associated with fat content (p<0.05).
RESUMEN
Se ha analizado el DNA de 108 cabras de la raza aut—ctona Algarvia. Se determinaron los po-limorfismos (SSCPs) en los cinco exones del gen de la GH caprina. Se observaron dos
polimorfis-mos en los exones 1 y 2, cuatro en el ex—n 3, sie-te en el ex—n 4 y cinco en el ex—n 5. Se ha esta-blecido una asociaci—n de estos SSCPs con la producci—n de leche, grasa y prote’na, as’ como con el porcentaje de grasa y prote’na. Los patro-nes A, F e D de los exopatro-nes 2, 4 y 5, respectiva-mente, est‡n positivamente asociados con la producci—n de leche y prote’na (p<0,05). El pa-tr—n A del ex—n 2 est‡ tambiŽn positivamente asociado com el porcentaje en grasa (p<0,05).
INTRODUCTION
Algarvia goat is a Portuguese
indi-genous breed of unknown origin, whose
main potential is milk production that is
used for cheese manufacture. Algarvia
goats are reared mainly in the Algarve
region, where they are very well
adap-ted to dry sylvan areas, and play an
im-portant role as an economic resource to
the rural populations.
A
DDITIONAL KEYWORDSPolymorphism. PCR-SSCP. Genetic markers.
P
ALABRAS CLAVE ADICIONALESPolimorfismo. PCR-SSCP. Marcadores genŽticos. ASOCIACIîN ENTRE LOS SSCPs DEL GEN DE LA GH DE LA CABRA ALGARVIA Y
CARACTERêSTICAS DE LA LECHE
Malveiro, E.1, P.X. Marques1, I.C. Santos1, C. Belo2and A. Cravador1
1Unidade de Ci•ncias e Tecnologias Agr‡rias. Universidade do Algarve. Campus de Gambelas. 8000-810 Faro. Portugal. E-mail: [email protected]
2Departamento de Ovinicultura e Caprinicultura. Esta•‹o ZootŽcnica Nacional. Quinta da Fonte Boa. 2000-763 Vale de SantarŽm. Portugal. E-mail: [email protected].
The GH secreted by the pituitary
gland, plays an important role on
lacta-tion. Some GH secretion parameters
and peak frequency are associated with
dairy animals of high genetic value
(Reinecke et al., 1993). It has been
de-monstrated that those animals with high
milk yield reveal superior GH average
levels when compared to those
obser-ved in animals with lower production,
namely during peak lactation
(Bonc-zeck et al., 1988).
Single-strand conformation
poly-morphism (SSCP) is a powerful
me-thod for identifying sequence variation
in amplified DNA. SSCP analysis of
DNA have been used for detection of
genetic mutations in humans (Orita et
al., 1989), rats (Pravenec et al., 1992),
cattle (Kirkpatrick, 1992) and in
va-rious bacteriological (Morohoshi et al.,
1991) and viral (Fujita et al., 1992)
systems. Most significant studies using
the SSCP approach were accomplished
on bovines in linkage analysis
(Nei-bergs et al., 1993) and to define
intra-genic haplotypes at the growth
hormo-ne (Lagziel et al., 1996).
The search for SSCP
polymorphis-mÕs could lead to the finding of genetic
markers useful for improved selection
of agricultural populations, namely
when applied to candidate genes
asso-ciated with quantitative genetic
varia-tion in traits of economic importance.
As part of a programme of genetic
selection aiming at the improvement of
production traits, we have identified
single-strand conformation
polymor-phisms at the five exons of the gGH
gene, by PCR-SSCP analysis. This
work presents preliminary results
to-wards the establishment of an
associa-tion of those polymorphisms with milk,
fat and protein yield, and fat and
pro-tein content.
MATERIAL AND METHODS
DNA samples: DNA was obtained
from peripheral blood leukocytes of
108 animals of Algarvia goat breed
using a DNA Isolation Kit from
Pure-gene.
PCR amplification: The 5 exons
from the gGH gene were amplified by
PCR using the five primer pairs shown
in table I. Five amplification fragments
were generated ranging in size from
112 to 289 bp. PCR reactions were
per-formed in an thermocycler UNOII from
Biometra, using Ready to Go PCR
be-ads, from Amersham Pharmacia
Bio-tech, according to the following
condi-tions: 25 to 50 ng of genomic DNA
(table I); 1.5 U Taq DNA polymerase,
10 mM Tris-HCl, pH 9; 50 mM KCl;
1.5 mM MgCl2; 200 mM of each
dNTP; stabilisers, including BSA, for a
final volume of 25 ml. The
amplifica-tion included 30 cycles of denaturaamplifica-tion
at 95¼C for 30 s, annealing at
57¼C-70¼C (table I) during 30 s and
exten-sion for 30 s at 72¼C. The product of
each amplification was analysed by
electrophoresis on 2 p.100 agarose gel
(5V/cm), using ethidium bromide
stai-ning.
SSCP analysis: For SSCP analysis, 5
ml of each amplification product were
added to 15 ml or 20 ml (table II) of stop
solution (95 p.100 formamide, 10 mM
NaOH, 0.05 p.100 xylene cyanol and
0.05 p.100 bromophenol blue). The
samples were heat-denatured at 95¼C for
5 min, and chilled at 0¼C, and loaded
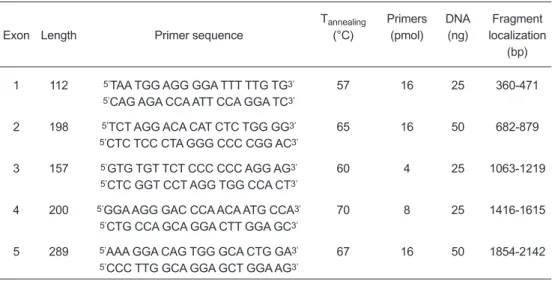
Table I. SSCP fragments at gGH gene and PCR analysis parameters.
(Fragmentos de SSCP en el gen de la gGH y an‡lisis de los par‡metros de PCR).Tannealing Primers DNA Fragment
Exon Length Primer sequence (¡C) (pmol) (ng) localization
(bp)
1 112 5ÕTAA TGG AGG GGA TTT TTG TG3Õ 57 16 25 360-471
5ÕCAG AGA CCA ATT CCA GGA TC3Õ
2 198 5ÕTCT AGG ACA CAT CTC TGG GG3Õ 65 16 50 682-879
5ÕCTC TCC CTA GGG CCC CGG AC3Õ
3 157 5ÕGTG TGT TCT CCC CCC AGG AG3Õ 60 4 25 1063-1219
5ÕCTC GGT CCT AGG TGG CCA CT3Õ
4 200 5ÕGGA AGG GAC CCA ACA ATG CCA3Õ 70 8 25 1416-1615
5ÕCTG CCA GCA GGA CTT GGA GC3Õ
5 289 5ÕAAA GGA CAG TGG GCA CTG GA3Õ 67 16 50 1854-2142
5ÕCCC TTG GCA GGA GCT GGA AG3Õ
Table II. SSCP analysis parameters and results for the indicated exons.
(Par‡metros de an‡lisis por SSCP y resultados para los exones indicados).DNA/ Vol Run temp Number Frequencies of Exon p.100 T Denat. loades temp patterns patterns
(ml) (¡C) (p. 100) 1 12 1/3 20 15 2 A (97.2 p.100); B (2.8 p.100) 2 10 1/3 20 15 2 A (75.9 p.100); B (24.1 p.100) 3 12 1/3 20 15 4 A (18.5 p.100); B (33.3 p.100;); C (39.8 p.100); D (8.3 p.100) 4 10 1/3 20 15 7 A (13.9 p.100); B (27.8 p.100); C (35.2 p.100); D (5.6 p.100); E (11.1); F (2.8 p.100); G (3.7 p.100) 5 8 1/4 25 20 5 A (14.8 p.100); B (27.8 p.100); C (44.4 p.100); D (2.8 p.100); E (10.2 p.100)
(20 ml or 25 ml of each) onto a 8-12
p.100 polyacrylamide/TBE gel. Gels
were run at 25 W for 4 to 8 hr at 15-20¼C
(table II) in a Dcodeª Universal
Muta-tion DetecMuta-tion System, from BIO-RAD,
coupled with a refrigerated system.
Af-ter the run the gel was removed from the
apparatus and silver stained.
Table III. Least Square Means (LSMEAN), and Standard Deviation Error (STD Error)
asso-ciated, of milk production parameters for SSCP patterns at exon 1, considering 145 days of
lactation.
(Media de los m’nimos cuadrados (LSMEAN) y respectivo error est‡ndar (STD) de la media de la producci—n de leche para los patrones de SSCP en el ex—n 1, considerando 145 d’as de lactaci—n).LSMEAN ± STD Error
Pattern Milk (l) Fat content Protein content Fat (kg) Protein (kg)
(p.100) (p.100)
A 115.8 ± 4.68 3.92 ± 0.04 3.94 ± 0.05 4.58 ± 0.21 4.51 ± 0.18 B 150.8 ± 19.35 3.86 ± 0.22 3.84 ± 0.29 5.90 ± 0.86 5.76 ± 0.78
p-value 0.0729 0.7807 0.7191 0.1262 0.1083
Table IV. Least Square Means (LSMEAN), and Standard Deviation Error (STD Error)
asso-ciated, of milk production parameters for SSCP patterns at exon 2, considering 145 days of
lactation.
(Media de los m’nimos cuadrados (LSMEAN) y respectivo error est‡ndar (STD) de la media de la producci—n de leche para los patrones de SSCP en el ex—n 2, considerando 145 d’as de lactaci—n).LSMEAN ± STD Error
Pattern Milk (l) Fat content Protein content Fat (kg) Protein (kg)
(p.100) (p.100)
A 120.8 ± 4.99a 3.97 ± 0.04a 3.98 ± 0.06 4.84 ± 0.22a 4.72 ± 0.19a
B 104.6 ± 7.42b 3.76 ± 0.08b 3.82 ± 0.10 3.92 ± 0.33b 3.96 ± 0.28b
p-value 0.0362 0.0174 0.1563 0.0069 0.0115
a, b - Means with different characters differ statistically (p<0.05)
a, b - Medias con diferentes caracteres difieren estad’sticamente (p<0,05)
Statistical analyses: Statistical
analy-sis was performed on the baanaly-sis of
zoo-technical parameters (milk, fat and
pro-tein production, and fat and propro-tein
con-tent) adjusted to 145 days, related to
1996, 1997 and 1998, as well as
infor-mation about the type of parturition
(one, two or more kids) and animalÕs
age. It was adjusted a mixed linear
mo-del, by the application of SAS PROC
MIXED procedure, to determine
asso-ciations between SSCP and milk
produc-tion factors.
With the following mixed linear
mo-del, we analysed the five exons
separa-tely (because of missing values it was
not possible to perform an analysis for
the five exons simultaneously).
Y
ijk=
m + tp
i+
b (x
ijk- x
_
) +
+
b (x
ijk- x
_
)
2+ Animal
ijk+ Ex
j+
e
ijkY
ijk: observation of the animal k with
parturition type i, pattern level j of exon
m : overall mean
b (x
ijk- x
_
): linear effect of age covariate
b (x
ijk- x
_
)
2: quadratic effect of age
co-variate
Animal
ijk: fixed effect
Ex
j: random effect (exon)
e
ijk: random error
When the effects were
significati-ve we made use of multiple
compari-son tests (t-test) of LSMEAN values,
Table V. Least Square Means (LSMEAN), and Standard Deviation Error (STD Error)
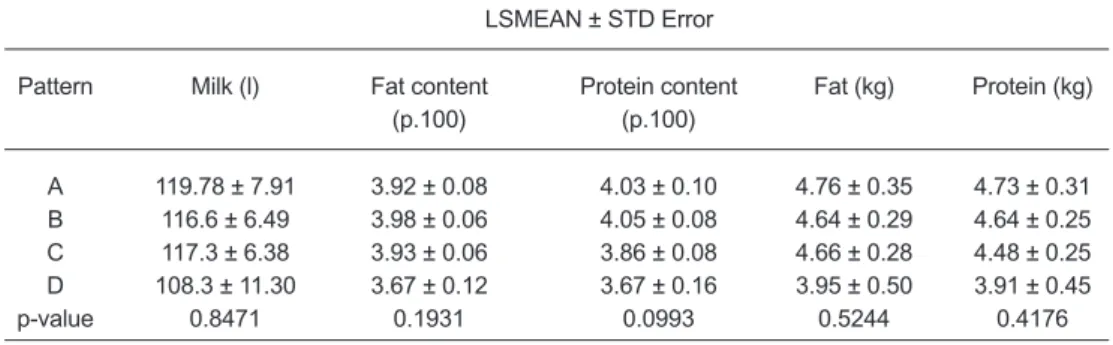
associa-ted, of milk production parameters for SSCP patterns at exon 3, considering 145 days of
lac-tation.
(Media de los m’nimos cuadrados (LSMEAN) y respectivo error est‡ndar (STD) de la media de la producci—n de leche para los patrones de SSCP en el ex—n 3, considerando 145 d’as de lactaci—n).LSMEAN ± STD Error
Pattern Milk (l) Fat content Protein content Fat (kg) Protein (kg)
(p.100) (p.100) A 119.78 ± 7.91 3.92 ± 0.08 4.03 ± 0.10 4.76 ± 0.35 4.73 ± 0.31 B 116.6 ± 6.49 3.98 ± 0.06 4.05 ± 0.08 4.64 ± 0.29 4.64 ± 0.25 C 117.3 ± 6.38 3.93 ± 0.06 3.86 ± 0.08 4.66 ± 0.28 4.48 ± 0.25 D 108.3 ± 11.30 3.67 ± 0.12 3.67 ± 0.16 3.95 ± 0.50 3.91 ± 0.45 p-value 0.8471 0.1931 0.0993 0.5244 0.4176
Table VI. Least Square Means (LSMEAN), and Standard Deviation Error (STD Error)
asso-ciated, of milk production parameters for SSCP patterns at exon 4, considering 145 days of
lactation.
(Media de los m’nimos cuadrados (LSMEAN) y respectivo error est‡ndar (STD) de la media de la producci—n de leche para los patrones de SSCP en el ex—n 4, considerando 145 d’as de lactaci—n).LSMEAN ± STD Error
Pattern Milk (l) Fat content Protein content Fat (kg) Protein (kg)
(p.100) (p.100) A 128.9 ± 8.56c 4.03 ± 0.10 4.04 ± 0.13 5.26 ± 0.38b 5.08 ± 0.32b B 113.0 ± 6.48bc 4.0 ± 0.07 4.03 ± 0.09 4.54 ± 0.29b 4.51 ± 0.24b C 125.3 ± 6.34c 3.91 ± 0.06 3.91 ± 0.09 4.96 ± 0.28b 4.77 ± 0.24b D 85.7 ± 11.71a 3.67 ± 0.14 3.83 ± 0.18 3.12 ± 0.52a 3.21 ± 0.44a E 110.5 ± 10.26ac 3.87 ± 0.12 3.90 ± 0.16 4.26 ± 0.46ab 4.30 ± 0.39ab F 200.6 ± 21.90d 3.72 ± 0.25 3.52 ± 0.34 7.43 ± 0.98c 6.95 ± 0.83c G 83.3 ± 15.83ab 3.61 ± 0.18 3.72 ± 0.24 2.98 ± 0.71a 3.01 ± 0.60a p-value 0.0001 0.1728 0.6093 0.0002 0.0001
a, b - Means with different characters differ statistically (±p<0.05)
in an attempt to find the different
le-vel values.
RESULTS AND DISCUSSION
SSCP polymorphisms: We have
chosen exons 1, 2, 3, 4 and 5 of the GH
gene, for the SSCP analysis. The
analy-sis of the amplified fragments by the
PCR method, using the primers
descri-bed in table I is shown in figure 1.
Their lengths correspond to those
ex-pected, according to the position of the
primers, deduced from the described
nucleotide sequence of the gGH gene
from Capra hircus (Kioka et al., 1989).
Considering the one hundred eight
Al-garvia goats, we have observed several
conformational patterns inside each of
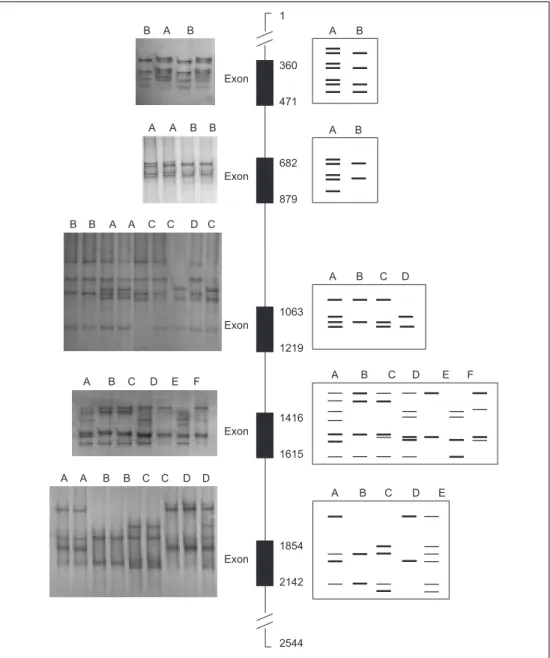
those fragments (figure 2 and table II):
two conformational patterns (A and B)
for each of the exons 1 and 2, four in
exon 3 (A, B, C e D), seven in exon 4
(A, B, C, D, E, F e G), and five in exon
5 (A, B, C, D e E). The frequencies
found for each pattern are shown in
ta-ble II.
We have made a preliminary
at-tempt towards the search for
associa-tions between the SSCP
polymor-phisms and quantitative variation in
the productive traits described below.
Tables III, IV, V, VI and VII
summa-rise the results obtained using the
SAS programme applied to the
analy-sis of linear contrasts of SSCPs
rela-ting to milk, protein and fat
produc-tion, and protein and fat content for
each exon analysed. Animals with
pattern A in exon 2 appear to have a
higher milk, fat and protein
produc-tion (p<0.05), and their milk has a
higher fat content than those animals
having pattern B (p<0.05). Animals
with patterns F and D for exons 4 and
Table VII. Least Square Means (LSMEAN), and Standard Deviation Error (STD Error)
asso-ciated, of milk production parameters for SSCP patterns at exon 5, considering 145 days of
lactation.
(Media de los m’nimos cuadrados (LSMEAN) y respectivo error est‡ndar (STD) de la media de la producci—n de leche para los patrones de SSCP en el ex—n 5, considerando 145 d’as de lactaci—n).LSMEAN ± STD Error
Pattern Milk (l) Fat content Protein content Fat (kg) Protein (kg)
(p.100) (p.100) A 121.2 ± 8.43a 3.96 ± 0.10 3.96 ± 0.12 4.84 ± 0.38a 4.74 ± 0.34a B 107.2 ± 6.30a 3.89 ± 0.07 4.01 ± 0.87 4.21 ± 0.28a 4.24 ± 0.25a C 121.2 ± 6.14a 3.97 ± 0.06 3.94 ± 0.08 4.86 ± 0.28a 4.68 ± 0.24a D 201.0 ± 22.43b 3.71 ± 0.25 3.53 ± 0.34 7.45± 1.00b 6.98 ± 0.89b E 118.4 ± 10.25a 3.77 ± 0.12 3.79 ± 0.15 4.49 ± 0.46a 4.43 ± 0.41a P-value 0.0015 0.5109 0.5225 0.0168 0.0390
a, b - Means with different characters differ statistically (±p<0.05)
5 respectively, are superior milk
pro-ducers (p<0.05).
The SSCP analysis of genes,
who-se product is associated with
produc-tion traits could be a valuable
alterna-tive approach for the establishment of
allelic variants useful as markers to
aid selection. We have applied this
technique to the exons 1, 2, 3, 4 and
5 of GH gene, from the indigenous
Portuguese caprine Algarvia breed.
The SSCP polymorphisms we have
found in the gGH gene coding for a
hormone that exerts a positive
in-fluence in milk production, hint at
the possibility of exploring this
ap-proach for the search of genetic
mar-kers located in this gene. The SSCP
polymorphic variation makes it a
po-tential candidate for the
establis-hment of associations with
quantitati-ve traits. Indeed, statistical analyses
made clear the existence of
associa-tions between the polymorphisms
ob-served in exons 2, 4 and 5 and milk,
protein and fat production, and fat
content. If specific haplotypes can be
defined at this candidate gene that
can be associated with milk
produc-tion, protein and fat content it would
be rendered available a valuable
ge-netic resource for improvement of
this caprine breed.
We aknowledge Funda•‹o para a
Ci•ncia e Tecnologia (FCT) (PRAXIS
XXI 3/3.2/CA/1991/95, INTERREG
18/REGII/6/96) for financial support.
I.C.S. thanks FCT for her PRAXIS
XXI Ph.D. grant (BD/18061/98).
Figure 1. Electrophoretic separation in agarose gel of PCR products (2 p.100 p/v, 5 V/cm)
Lanes 1, 2, 3 - exon 1
Lanes 8, 16 - 100 bp ladder
Lanes 17, 18, 19 - exon 5
Lanes 4, 12 - 50 bp ladder
Lanes 9, 10, 11 - exon 3
Lanes 5, 6, 7 - exon 2
Lanes 13, 14, 15 - exon 4
Separaci—n electroforŽtica en gel de agarosa de los productos del PCR (2 p.100 p/v; 5 V/cm)
Bandas 1, 2, 3 - ex—n 1 Bandas 8, 16 - marcador de 100 pb Bandas 17, 18, 19 - ex—n 5 Bandas 4, 12 - marcador de 50 pb Bandas 9, 10, 11 - ex—n 3
Bandas 5, 6, 7 - ex—n 2 Bandas 13, 14, 15 - ex—n 4
1 2 3 4 5 6 7 8 9 10 11 12 13 14 15 16 17 18 19 300 bp 200 bp 100 bp 50 bp Ð +
Figure 2. Left: SSCPÕs patterns observed in non denaturant PAGE; middle: schematic
repre-sentation of GH gene with exons represented by black boxes. Numbers represent the
localisa-tion of amplified fragments; right: schematic representalocalisa-tion of SSCP patterns for each exon.
(Izquierda: patrones SSCP observados en PAGE no desnaturalizante; centro: representaci—n esquem‡tica del gen GH con exones representados por los cuadros negros. Los nœmeros representan la localizaci—n de los fragmentos amplificados; derecha: representaci—n esquem‡tica de los patrones SSCP para cada ex—n). Exon 360 471 Exon 682 879 Exon 1063 1219 Exon 1416 1615 Exon 1854 2142 2544 1 A B A B A B C D A B C D E F A B C D E B A B A A B B B B A A C C D C A B C D E F A A B B C C D D
REFERENCES
Bonczeck, R., D. McKenzie and D. Flux. 1988. Blood metabolite responses to catecholami-ne injections in heifers of high or low gecatecholami-netic merit for milk fat production. N. Z. J. Agric. Res., 30: 291-296.
Fugita, K., J. Silver and K. Peden. 1992. Chan-ges in both gp120 and gp41 can account for increased growth potential and expanded host range of human immunodeficiency virus type 1. J. Virol., 66: 4445-4451.
Kioka, N., E. Manabe, M. Abe, H. Hashi, M. Yato, M. Okuno, Y. Yamano, H. Sakai, T. Komano, K. Utsumi and A. Iritani. 1989.Cloning and sequencing of goat growth hormone gene. Agricultural and Biological Chemistry, 53: 1583-1587.
Kirkpatrick, B. 1992. Detection of a three-allele single strand conformation polymorphism (SSCP) in the fourth intron of the bovine growth hormone gene. Animal Genetics, 23: 179-181.
Lagziel, A., E. Lipkin and M. Soller. 1996. Asso-ciation between sscp haplotypes at the bovi-ne growth hormobovi-ne gebovi-ne and milk protein percentage. Genetics, 142: 945-951. Morohoshi, F., K. Hayashi, N. Munakata. 1991.
Molecular analysis of Bacillus subtilis ada mutants deficient in the adaptative response to simple alkylating agents. J. Bacteriol., 173: 7834-7840.
Neibergs, H., A. Dietz and J. Womack. 1993. Sin-gle strand conformation polymorphisms (SSCP) detected in five bovine genes. Ani-mal Genetics, 24: 81-84.
Orita, M., H. Iwahana, K. Hayashi and T. Sekiya. 1989. Detection of polymorphisms of human DNA by gel electrophoresis as single-strand conformation polymorphisms. Proceedings of the National Academy of Sciences of the USA, 86: 2766-2670.
Pravenec, M., L. Simonet, V. Kren, E. St.Lezin, G. Levan, J. Szpirer, C. Szpirer and T. Kurtz. 1992. Assignment of rat linkage group V to chromosome 19 by single strand conforma-tion polymorphism analysis of somatic cell hybrids. Genomics, 12: 350-356.
Reinecke, R., M. Barnes, R. Akers and R. Pear-son. 1993. Effect of selection for milk yield on lactation performance and plasma growth hormone, insulin and IGF-1 in first lactation Holstein cows. J. Dairy Sci., 76 (Suppl. 1): 286.