Assessment of the Ti-Rich Corner of the Ti-Si Phase Diagram: The Recent Dispute About
the Eutectoid Reaction
Marina Fiorea, Flavio Beneduce Netoa, Cesar Roberto de Farias Azevedoa*
aDepartment of Metallurgical and Materials Engineering, Escola Politécnica, Universidade de São
Paulo – USP, Av. Professor Mello Moraes, 2463, 05508-030, São Paulo, SP, Brazil
Received: February 24, 2016; Revised: May 3, 2016; Accepted: June 5, 2016
The thermodynamic optimization of Ti-Si-X systems requires that their respective binary systems are constantly updated. The Ti-Si system has been experimentally investigated since the 1950s and these critical experimental data can be employed to calculate the Ti-Si phase diagram using thermodynamic modeling. The most recent assessment of the Ti-Si system was performed in 1998, showing the presence of stoichiometric Ti3Si as stable phase. In the light of the dispute over the stability of Ti3Si phase in the eutectoid reaction of the Ti-Si and Ti-X-Si systems, the present work assessed the Ti-rich corner of the “stable” (featuring Ti3Si phase) and “metastable” (featuring Ti5Si3 phase) Ti-Si phase diagrams. The phase boundaries, the values of the error of the least-square method of the optimization procedure and the relative standard deviation of the calculated variables of the assessed diagrams; and previous investigations were discussed in order to inspire further experimental work on the eutectoid reaction of the Ti-Si phase diagram.
Keywords: Ti-Si phase diagram, Ti-rich corner, thermodynamic modeling, sublattice model, eutectoid reaction
1. Introduction
There is a continuous technological interest in the
Ti-Si system, which is promoted by the beneicial efect
of Si addition on the oxidation and creep resistance (via solid solution and precipitation hardening) of Ti-X-Si
alloys1. The earliest Ti-Si phase diagram was thoroughly
investigated in 1952 by Hansen et al.2, which studied more
than ifty Ti-Si binary alloys. The absence of interstitial contamination during the casting of these alloys was veriied
by hardness measurements of control samples of pure Ti. The microstructure was characterized by metallography and
X-ray difraction, while the transition temperatures were
determined by incipient melting point studies and thermal analysis. Their results showed that non-stoichiometric
Ti5Si3 phase existed over a composition range from 38
to 40at% Si. The phase diagram indicated in the Ti-rich corner the presences of a eutectic reaction at 1606K, L Ti(β) + Ti5Si3, and a eutectoid reaction at 1133K, Ti(β) Ti(α) + Ti5Si3. The presence of this eutectoid reaction
was conirmed by the investigation of seven Ti-Si alloys
containing up to 2% Si, which were heat-treated between 1023K and 1373K for times of respectively 170 and 31
hours. In 1954 Sutclife3,4 investigated the Ti-rich corner of the Ti-Si system using isothermal heat-treatments of homogenized samples at temperatures between 923K and 1373K for 720 to 72 hours, respectively. Control samples and hardness measurements were also used to ensure that the interstitial content (O and N) in the alloys
was below 0.05wt%. They conirmed the presence of a
eutectoid reaction at 1129K, Ti(β) Ti(α) + Ti5Si3, but
presenting smaller Si solubility (~40%) in the Ti(β) phase
than previous result2.
In 1970, Svechnikov et al.5 proposed a new experimental version of the Ti-Si phase diagram with the presence of a stoichiometric Ti3Si phase (tetragonal, Ti3P crystal structure). They studied thirty Ti-Si alloys, which were analyzed by
diferential thermal analysis (DTA), metallography and X-ray difraction. The experimental procedure did not explicitly
describe the use of control samples to ensure the lack of interstitial contamination in the alloys. The stoichiometric Ti3Si
phase was identiied in Ti-rich samples after heat-treatment
at 1273K for 115 hours and 1493K for 120 hours. The Ti-rich corner of the experimental phase diagram showed unusual phase boundaries, featuring, for instance, the presence of Ti3Si phase until the eutectic reaction, L Ti(β) + Ti5Si3, and the presence of atypical boundaries at 1443K, dividing into two regions the [Ti(β)+Ti3Si] and [Ti3Si+Ti5Si3] phase
ields, respectively. Finally they suggested the presence of
two new reactions in the Ti-rich corner: a peritectoid reaction at 1444K, Ti(β) + Ti5Si3 Ti3Si, and a eutectoid reaction at 1133K, Ti(β) Ti(α) + Ti3Si.
In 1977 and 1978 Aaronson et al.6,7 investigated the
eutectoid reaction of the Ti-rich corner of the Ti-Si system, using continuous cooling experiments, microstructural characterization and microanalysis. Isothermal heat-treatments of homogenized samples were carried out at 1023K for 24 and 120 hours. Chemical analysis of interstitials (C, O, N, and H) after the homogenization heat-treatment indicated that their alloys contained approximately 0.04wt%C, 250
to 350 ppm of O2, 65 ppm of H2 and 200 ppm of N2. None
of the previous works2-5 actually used chemical analysis to check the amount of interstitials in the investigated alloys. The authors did not observe any precipitation of Ti3Si phase,
as proposed by Svechnikov et al.5, conirming, instead, the
presence of a eutectoid reaction at 1148K, Ti(β) Ti(α) + Ti5Si3, as observed by previous investigations2-4. Their results also featured higher Si solubility in the Ti(β) phase
and lower Si solubility in the Ti(α) than previous works3,4. Plitcha and Aaronson6,7 concluded that the diferences between their version of the eutectoid reaction of the Ti-Si system and previous results could be due to the higher impurity contents in the alloys previously investigated.
The irst thermodynamic assessment of the Ti-Si
phase diagram was performed by Kaufmann8 in 1976.
This assessment was based on the experimental results
of Hansen et al.2, but considering the Ti
5Si3 phase as a
stoichiometric intermetallic. Kaufmann8 did not provide
any information about the optimization procedure and his calculated diagram was a simplistic version of previous
experimental phase diagrams2-4. Murray9 in 1987 assessed
the Ti-Si system and the assessed phase diagram9 was in
fair agreement with the experimental results of Svechnikov et al.5, showing the presences of a peritectoid reaction at 1443K, Ti(β) + Ti5Si3 Ti3Si, and a eutectoid reaction at 1138K, Ti(β) Ti(α) + Ti3Si. Additionally, the phase diagram featured the presence of non-stoichiometric Ti5Si3 phase. In 1989 Vahlas et al.10 assessed the Ti-Si system and their calculated diagram showed a much simpler version
of previous assessment9, featuring the presence of Ti
5Si3 phase as a stoichiometric intermetallic.
In 1996 Seifert et al.11 employed software using Gaussian least square optimization method for the determination of the adjustable optimizing variables of the thermodynamic
functions to assess the Ti-Si system. They tested two diferent
thermodynamic descriptions for the liquid phase: the regular solution model using the Redlich-Kister formalism; and the partially ionic liquid model. Their calculated phase diagram was in fair agreement with the calculated diagram
proposed by Murray9 and the experimental diagram proposed
by Svechnikov et al.5, indicating in the Ti-rich corner of
phase diagram the presences of a peritectoid reaction at 1443K, Ti(β) + Ti5Si3 Ti3Si, and a eutectoid reaction at 1138K, Ti(β) Ti(α) + Ti3Si. The authors did not use the experimental results of Aaronson and Plitcha6,7 for the
eutectoid reaction, which did not conirm the presence of
Ti3Si phase. Additionally, they did not ind in the literature any experimental data for the Si solubility in the Ti(α) and Ti(β) phases of the eutectoid reaction, Ti(β) Ti(α) + Ti3Si, so they assumed that the Si solubility in these phases was equal to previous experimental results2 for the “metastable” eutectoid reaction, Ti(β) Ti(α) + Ti5Si3.
Concerning the dispute over the stability of the Ti3Si
phase in Ti-Si and Ti-Al-Si alloys, Azevedo et al.1,12-14
investigated in 1996 the Ti-rich corner of the Ti-Al-Si system using control samples (hardness measurements),
TEM, EDS and electron difraction. Their results did
not show the presence of Ti3Si phase after isothermal
heat-treatment at 973K for 36 days, but the presence of a ternary non-stoichiometric Ti5Si3 phase. In 1997, Bulanova et al.15 also could not identify the presence of Ti
3Si phase in Ti-13.5Si alloy after heat-treatments at 1323K for 45
hours and 1023K for 58 hours by XRD and microanalysis.
The presence of Ti3Si phase in a Ti-13.5Si alloy was
observed by Ramos et al.16 in 2006 after isothermal
heat-treatments at 1273K and 1373K for 90 hours by SEM-EDS
analysis. In 2010 Costa et al.17 observed the presence of
Ti3Si phase in Ti-13Si and Ti-20Si alloys after isothermal
heat-treatment at 1273K for various times by XRD. In
2014 Li et al.18 observed the presence of Ti
3Si phase in a Ti-15Si-5Al alloy after isothermal heat-treatment for
45 days at 973K using microanalysis coupled with XRD.
Finally, in 2014 Kozlov et al.19 observed the presence of
Ti3Si phase in Ti-Si and Ti-Ge-Si alloys after isothermal
treatments of at 943K for 720 hours by XRD.
Colinet and Tedenac20 studied in 2010 the structural
stability of intermetallic phases in the Ti-Si system by ab-initio calculations. A statistical model was used to obtain the enthalpy for the formation of the intermetallic phases. The predicted ground-state structures were consistent with those known to be stable at low temperature, except for the Ti3Si phase with Ti3P (tP32) structure, whose enthalpy of formation at 0K (-47.11 kJ/mol of atoms) was slightly above the ground-state line, indicating that the question of stability of the Ti3Si phase shown by previous experimental5
and calculated9,11 Ti-Si phase diagrams was in fact
“controversial”. More recently, Poletaev et al.21 indicated that Ti5Si3 phase was actually more stable than Ti3Si phase
at 0 K by ab initio calculations. They also conirmed the
presence of Ti(α) and Ti5Si3 phases by electron difraction and microanalysis after the heat-treatment of a Ti-0.7Si alloy at 873K for 10 hours.
In the light of the dispute over the stability of Ti3Si phase in Ti-X-Si engineering alloys2-21, the present work will calculate and compare the Ti-rich corner of the “stable” and “metastable” Ti-Si phase diagrams, by assuming that Ti3Si is the stable phase in the eutectoid reaction, Ti(β) Ti(α)+ Ti3Si. These results will be discussed in order to inspire further experimental work on critical regions of the Ti-Si phase diagram11.
2. Methodology
The present work calculated the stable and metastable
Ti-Si phase diagrams (assuming that Ti3Si is the stable
phase in the eutectoid reaction, Ti(β) Ti(α)+ Ti3Si), using Thermocalc software and COST 507 (Thermochemical
Database for Light Metal Alloys)22, whose principle objective was to provide a computerized thermodynamic database to permit the calculation of multicomponent phase equilibria for light alloys based on aluminum, magnesium and titanium to aid in the development of commercial light alloys under the organization of the European Cooperation in Science and Technology.
The liquid phase; and Ti(α) and Ti(β) solid solution
phases were described using Equations 1 to 5 (see Annex
1). The Gibbs free energy of reference (Gref) describes
the mechanical mixing of pure elements (see equation 2), while the Gibbs free energy of the ideal solution (Gid) was described by equation 3 and the excess Gibbs free energy (Gex) was described using the Redlich-Kister polynomial (see
Equations 4 and 5)23. The Gibbs energy for the formation
of stoichiometric Ti3Si phase was described using the
Kopp-Neumann rule23, see Equation 6 and a more detailed
description is given in Annex 1.
( )
G
phaseG
G
G
1
ref id ex
=
+
+
( )
G
refx
SiG
Six
G
2
ref
Ti Ti
ref
$
$
Where:
G
iG
refi SER
=
and xSi and xTi are the molar fraction
of the elements. The superscript ‘SER’ refers to the Standard Element Reference state.
using selected experimental data, including the invariant reactions shown in Table 2. The experimental data for the eutectoid temperature and the Si solubility in the Ti(α) and Ti(β) phases in the “stable” eutectoid reaction, Ti(β) Ti(α) + Ti3Si, was estimated based on previous experimental results2 for the “metastable” eutectoid reaction, Ti(β) Ti(α) + Ti5Si3, using adjustment factors for correcting the values of the eutectoid temperature and the Si solubility in the Ti(α)
and Ti(β) phases. These factors were based in the changes
of the eutectoid temperature and C solubility of the Fe(γ)
and Fe(α) phases in the Fe-C phase diagram for the stable,
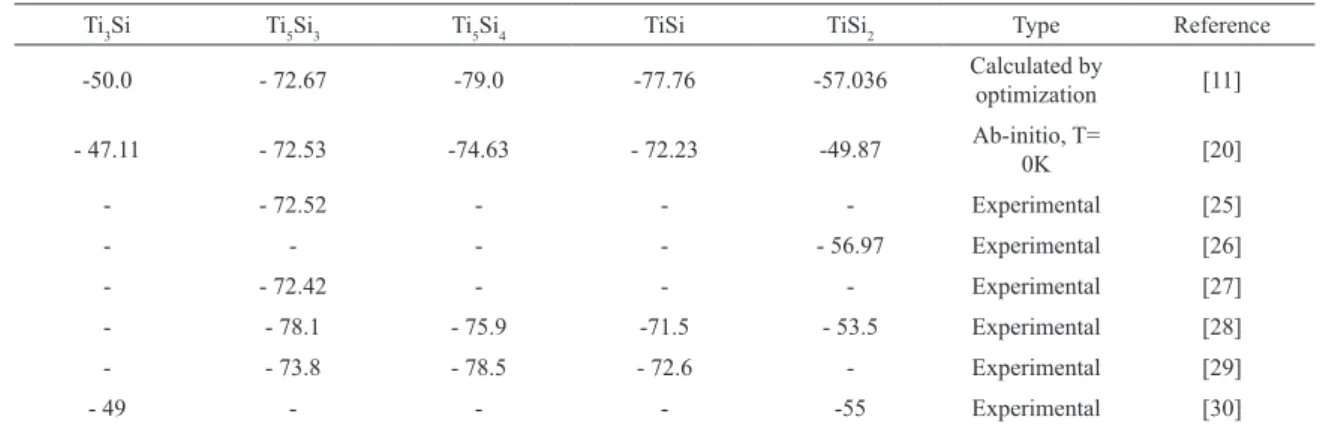
Fe(γ,2.97%C) Fe(α,0.096%C%) + C(graphite) at 740ºC, and metastable, Fe(γ,3.46%C) Fe(α,0.104%) + Fe3C at 727ºC, eutectoid reactions24. The absolute error in the experimental values was assumed to be equal to 10K for the incongruent temperatures; and between 0.02 and 0.001 for the Si solubility, (atomic fraction of Si). Finally, the same weight was attributed to all the experimental data used in the present assessment. Table 3 shows the values for the enthalpy for the formation of intermetallic phases used in the present investigation11,20,25-30. Colinet and Tedenac20, for instance, obtained the values of the enthalpy for the formation of the intermetallic phases at 0K via ab-initio calculations and statistical modelling.
The missing variables of the Ti5Si3 phase (see Table 1) were initially calculated during the optimization procedure of the metastable Ti-Si phase diagram (by suspending the
presence of the Ti3Si phase). These calculated values were
ixed for the calculation of the missing variables of the Ti3Si phase during the optimization of the stable Ti-Si phase diagram.
3. Results and discussion
The calculated values of the variables used for the description of Ti3Si and Ti5Si3 phases of the present work were compared with the values calculated by Seifert et al.11, using the regular model for describing the liquid phase. This comparison showed the same order of magnitude for most
calculated variables (see Table 4). The main diferences
were observed for V31 (used for the description of the Gibbs energy for the formation of hypothetic Ti6Si2 phase); and V1 and V2 (used for the description of the Gibbs energy for the formation Ti3Si phase) variables. Additionally, the present investigation used three variables, instead of two variables,
to describe the Ti3Si phase. According to Thermo-Calc data
optimization user guide version 2015a31, values of Vi1-type variables around 105 might indicate that either there were too many variables describing the Ti5Si3 and Ti3Si phases or that the user did not set “proper weights” on the experimental data during the optimization procedure. Additionally, the
same source31 stated that Vi2-type variables should not
present values in the order of 10 or more, as this may lead to either the presence of “inverted miscibility gaps” or the re-stabilization of a phase at high temperature. In the present assessment just one out of six Vi1- variables presented
value below 105 (see Table 4); while half of the Vi2-type
variables presented values below the order of 10. Finally, the optimization procedures for the calculation of the stable and metastable phase diagrams showed values for the reduced sum of squares approximately equal to 10, which are above
the recommended value of one31. These results suggest that
( )
ln
ln
G
idR T
x
x
x
x
3
Si Si Ti Ti
$
$
$
$
=
6
+
@
( )
G
excx
x
L
4
Si
$
Ti$
phase=
Where:
L
iphase is the Ti-Si interaction parameter.... ( )
Lphase Lphase Lphase xSi xTi Lphase x x 5 v
Si Ti v
0 1
= +
]
-g
+ +]
-g
Where:
L
phasea
bT
...
v
= +
+
( )
G
Ti Si5 3=
formG
Ti Si5 3+
idG
Ti Si5 3+
exG
Ti Si5 37
( ) ( )
ln
G
Ti Six
G
x
G
a
b T
c T
T
6
formTi Ti SER
Si Si SER
3
-
$
-
$
= +
$
+
$
$
The non-stoichiometric Ti5Si3 phase was described by
the Compound Energy Formalism23, using a three sublattices
coniguration, (Ti,Si)2(Si,Ti)3(Ti)3 (see Equations 7 to 10) as suggested previously11. These authors11 described the Ti
5Si3 phase as a non-stoichiometric compound containing three
sublattices to represent its D88 crystal structure - 4 atoms of Ti in the position 4(d), 6 atoms of Ti in the position 6(g) and 6 atoms of Si in the position 6(g): (Ti,Si)2:(Si,Ti)3:(Ti)3. Colinet and Tedenac20, for instance, used a four sublattices coniguration to describe the Ti5Si3 phase in order to account for the D88 structure
and for the possibility of inserting Si atoms in the 2b Wyckof
positions of P63/mcm space group. The use of a four sublattices ((Si,Ti)α (Ti)b1 (Ti)b2 (V,Si)γ) to describe the Ti
5Si3 phase 20 was
not considered in the present work as it might signiicantly
increase the number of excess terms to be calculated during the optimization procedure of higher order systems.
The parameters used of the thermodynamic description of the Ti5Si3 and Ti3Si phases in the present work are listed in Table 1 and more detailed thermodynamic description of the phases is given in Annex1. Note that the value for the
Gibbs energy for the formation of Ti phase with D88 crystal structure was not calculated in the present work, so the value listed for this parameter was directly copied from the COST
507 thermochemical database22.
( )
G
y
y
G
y
y
G
y
y
G
y
y
G
8
’ ’’
: : ’ ’’ : : ’ ’’
: : ’ ’’ : : form Ti Si
Ti Ti Ti Ti Ti ref
Ti Si Ti Si Ti ref
Si Si Si Si Ti ref
Si Ti Si Ti Ti ref 5 3
$
$
$
$
$
$
$
$
=
+
+
+
( ) ln ln ln lnG R T y y y y
y y y y
2
3 9
’ ’ ’ ’
’’ ’’ ’’ ’’
id Ti Si Ti Ti Si Si Ti Ti Si Si
5 3 $ $ $ $ $ $ $ $ = + + + f
^
^
^
^
h
h
h
h
p6
6
@
@
( )
G
y
y
y
L
y
L
y
y
y
L
y
L
10
’ ’ ’’
, : : ’’ , : : " ’’ ’
: , : ’ : , :
ex Ti Si
Ti Si Ti Ti Si Ti Ti Ti Si
Si Ti Si Si Ti Ti Si
Ti Si Ti Ti Si Ti Ti Ti Si
Si Si Si Ti Ti Ti Si
0 0
0 0
5 3 5 3 5 3
5 3 5 3
$
$
$
$
$
$
$
$
=
+
+
+
^
^
h
h
Where: y(n)
j is the site fraction of the element (j) in the
sublattice (n).
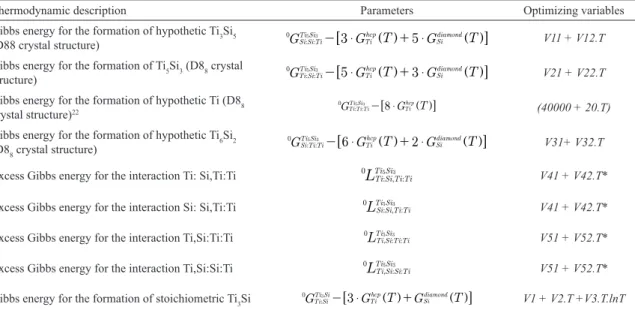
Table 1: Parameters and variables used for the thermodynamic description of the Ti5Si3 and Ti3Si phases. Vi1 in (J.(mol of atoms) -1); Vi2
and Vi3 in (J.(mol of atoms)-1).K-1).
Thermodynamic description Parameters Optimizing variables
Gibbs energy for the formation of hypothetic Ti3Si5
(D88 crystal structure) GSi Si Ti: : 3 G T 5 G T
Ti Si
Ti hcp
Si diamond
0 5 3
$ $
-6 ] g+ ] g@ V11 + V12.T
Gibbs energy for the formation of Ti5Si3 (D88 crystal
structure) GTi Si Ti: : 5 G T 3 G T
Ti Si
Ti hcp
Si diamond
0 5 3
$ $
-6 ] g+ ] g@ V21 + V22.T
Gibbs energy for the formation of hypothetic Ti (D88
crystal structure)22 GTi Ti Ti: : 8 G T
Ti Si Ti hcp 0 53
$
-6 ] g@ (40000 + 20.T)
Gibbs energy for the formation of hypothetic Ti6Si2
(D88 crystal structure)
GSi Ti TiTi Si: : 6 GTi T 2 G T hcp
Si diamond
0 5 3
$ $
-6 ] g+ ] g@ V31+ V32.T
Excess Gibbs energy for the interaction Ti: Si,Ti:Ti
L
Ti Si Ti Ti: , :Ti Si
0 5 3
V41 + V42.T*
Excess Gibbs energy for the interaction Si: Si,Ti:Ti
L
Si Si Ti Ti: , :Ti Si
0 5 3
V41 + V42.T*
Excess Gibbs energy for the interaction Ti,Si:Ti:Ti LTi Si Ti Ti, : :
Ti Si
0 5 3
V51 + V52.T*
Excess Gibbs energy for the interaction Ti,Si:Si:Ti
L
Ti Si Si Ti, : :Ti Si
0 5 3
V51 + V52.T*
Gibbs energy for the formation of stoichiometric Ti3Si GTi Si: 3 G T G T
Ti Si
Tihcp Sidiamond
0 3
$
-6 ] g+ ] g@ V1 + V2.T +V3.T.lnT
*
L
Ti Si Ti Ti, : :L
, : :and L
: , :L
: , : ,Ti Si
Ti Si Si Ti Ti Si
Ti Si Ti Ti Ti Si
Si Si Ti Ti Ti
0 5 3
=
0 5 3 0 5 3=
0 5 11 23the further experimental data and better modeling of the liquid phase are needed to improve the assessment of the present Ti-Si phase diagram. Seifert et al.11, for instance, also used the partially ionic liquid model to describe the
liquid phase and their results apparently showed a better it
between the calculated and the experimental results for most of the reactions involving the liquid phase when compared to their results using the regular solution model to describe the liquid phase.
Table 5 compares the experimental and the calculated equilibriums obtained in the present assessment for the stable and metastable Ti-Si phase diagrams. Five out of 37 calculated values presented a relative deviation above 5% when compared to the experimental values. Most of these deviations were originated
in the equilibriums involving the liquid phase, such as the L→ β+ Ti5Si3 reaction, which presented a deviation of 20% for the value of the Si solubility in Ti(β) phase and a value of 9.5% for the Si solubility in the liquid phase. These deviations involving the liquid phase might be decreased by using more complex models for the thermodynamic description of the liquid phase, such as the ionic two-sublattice liquid model; the associate
liquid model; or the quasi-chemical model23. The remaining
deviation values above 5% were found in the stable diagram,
more speciically in following reactions:
• the peritectoid reaction, β+Ti5Si3→Ti3Si, which presented a deviation of 30% for the Si solubility in the Ti(β) phase;
• the eutectoid reaction, β→α+Ti3Si, which presented a deviation of 7.5% for the Si solubility in the Ti(α) phase.
These results indicate that there is a vital need for obtaining more reliable experimental data in these critical regions. For instance, the experimental results of the peritectoid reaction
are still based on the work of Svechnikov et al.5 made in
the 70´s. Additionally, the experimental data for the stable
eutectoid reaction, β→α+Ti3Si, and their respective Ti(α) and Ti(β) solvus lines were not found in the literature5,11.
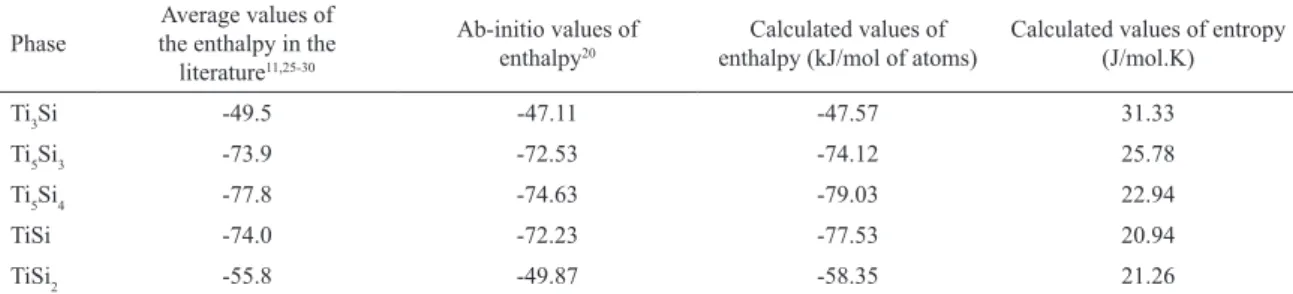
The calculated values of the enthalpy and the entropy of the formation of the intermetallic phases in the Ti-Si system are shown in Table 6 and Figures 1-a and 1-b. The calculated values of enthalpy are in fair agreement with the values found in the literature11,20,25-30, especially for the intermetallics phases in the Ti-rich corner, such as the Ti5Si3
and Ti3Si phases. Figure 1-a shows the enthalpies of the
formation of the Si-Ti compounds, comparing the present
and previous results11,20,25-30. This comparison conirmed
a better agreement of the enthalpy values in the Ti-rich corner (Ti3Si and Ti5Si3 phases). According to Kematick
and Meyers28, the highest melting point for the compound
in a system usually coincides which the position of the most negative value of the enthalpy (such as the Ti5Si4 phase, in according with Figure 1-a and Table 6). Figure 2-a, however, indicates that the highest melting point for the compound in the calculated Ti-Si diagram is found for the Ti5Si3 phase. Figure 1-b shows the entropy of the formation of the Si-Ti compounds, featuring a maximum value of entropy for
the Ti3Si phase, but this type of entropy curve could not
be found in the literature in order to be compared with the present results.
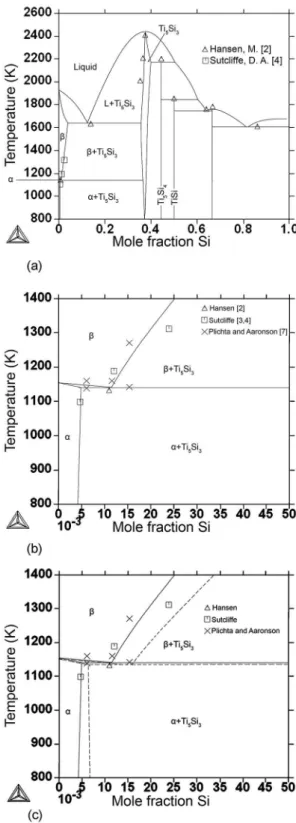
Figure 2-a shows a general view of the calculated stable Ti-Si phase diagram, indicating that the positions of the phase boundaries are in fair agreement with previous assessment11. Figure 2-b shows a detail of the Ti-rich corner of the stable Ti-Si phase diagram near the eutectoid reaction, β→α+Ti3Si, indicating that there is a lack of experimental data concerning the positions of the Ti(α) and Ti(β) solvus lines. Figure 2-c compares the present assessment with the calculated Ti-Si
phase diagram using the COST 507 database22 in the region
Table 2: Experimental data for the invariant reactions used for the calculation of the “stable” and “metastable” Ti-Si phase diagrams (Xphase
Si: atomic fraction of Si in the phase).
Reaction Experimental values References
L=Ti5Si3
T(K) 2403 [2-5]
XSi 0.375 [2-5]
L=TiSi2
T(K) 1773 [2-5]
XSi 0.667 [2-5]
L=β + Ti5Si3
T(K) 1613 [2-5]
XSiL
0.137 [2,5]
XSib
0.05** [11]
XSiTi Si5 3
0.36** [11]
L=TiSi2 + Si
T(K) 1603 [2-5]
XSiL
0.86 [2-5]
XSiTiSi2 0.667 [2-5]
XSiSi
1 [2-5]
L=TiSi2 + TiSi
T(K) 1743 [2-5]
XSiL
0.641 [2-5]
XSiTiSi
0.5 [2-5]
XSiTiSi2 0.667 [2-5]
L + Ti5Si3=Ti5Si4
T(K) 2193 [2-5]
XSiL
0.48 [2-5]
XSiTi Si5 3
0.398** [11]
XSiTi Si5 4
0.444 [2-5]
L + Ti5Si4=TiSi
T(K) 1843 [2-5]
XSiL
0.60 [2-5]
XSiTi Si5 4 0.444 [2-5]
XSiTiSi
0.5 [2-5]
β + Ti5Si3=Ti3Si
T(K) 1443 [5, 11]
XSib
0.04 [5, 11]
XSiTi Si5 3
0.36** [11]
XSiTi Si3 0.25 [5, 11]
β=α + Ti3Si
T(K) 1149* [2, 5, 11, 24]
XSib
0.009* [2, 5, 11, 24]
XSia 0.004* [2, 5, 11, 24]
XSiTi Si3 0.25 [5, 11]
β=α + Ti5Si3
T(K) 1130 [2-4, 6-7]
XSib
0.011 [2-4, 6-7]
XSia
0.005 [2-4, 6-7]
XSiTi Si5 3
0.375 [2-4, 6-7]
Table 3: Enthalpy for the formation of the intermetallic phases of the Ti-Si system at 298 K (kJ/mol).
Ti3Si Ti5Si3 Ti5Si4 TiSi TiSi2 Type Reference
-50.0 - 72.67 -79.0 -77.76 -57.036 Calculated by
optimization [11]
- 47.11 - 72.53 -74.63 - 72.23 -49.87 Ab-initio, T=
0K [20]
- - 72.52 - - - Experimental [25]
- - - 56.97 Experimental [26]
- - 72.42 - - - Experimental [27]
- - 78.1 - 75.9 -71.5 - 53.5 Experimental [28]
- - 73.8 - 78.5 - 72.6 - Experimental [29]
- 49 - - - -55 Experimental [30]
Table 4: Calculated variables of Ti3Si and Ti5Si3 phases after optimization procedures. Vi1 in (J.(mol of atoms)
-1); Vi2 and Vi3 in (J.(mol
of atoms)-1).K-1). The value for the reduced sum of squares was equal to 10 for both procedures. The values of the present investigation
were compared with the values of the last assessment11. Description Optimizing
variables Calculated values
Values of Seifert
et al.11 Diference (%)
Gibbs energy for the formation of Ti3Si5 V11 -360707.460 -206191.45 75
V12 15.4134911 16.4953 7
Gibbs energy for the formation of Ti5Si3
V21 -592931.498 -583564.31 2
V22 3.78463760 2.68514 41
Gibbs energy for the formation of Ti6Si2 V31 -141301.038 417375.85 134
V32 22.2273728 33.81017 34
Excess Gibbs energy (*:Ti,Si:Ti) V41 47538.3043 43024.29 10
V42 -4.64574985 -3.44194 35
Excess Gibbs energy (Si,Ti:*:Ti) V51 -266180.152 -500000.0 47
V52 27.3581605 40.0 31
Gibbs energy for the formation of Ti3Si
V1 -186823.828 -500000.0 62
V2 -92.5387205 0.79981 12600
V3 11.6727301 -
-Figure 3-a shows a general view of the calculated metastable Ti-Si phase diagram, indicating that the positions of the phase boundaries are in fair agreement with previous experimental results2-4. Figure 3-b shows a detail of the Ti-rich corner of the metastable Ti-Si phase diagram near the eutectoid reaction, Ti(β) Ti(α) + Ti5Si3. The positions of the solvus lines and phase boundaries are in good agreement with previous experimental diagrams2-4,6-7. Figure 3-c compares the present assessment with the calculated Ti-Si phase
diagram using COST 507 database22. The present assessment
shows lower values for the Si solubility in the Ti(α) and
Ti(β) phases, especially for the Ti(β) phase. Additionally,
there is a signiicant diference in the inclination of the
solvus line of the Ti(α) phase: in the present assessment
there is a reduction of the Si solubility in the Ti (α) phase in lower temperatures, while in the version using COST 507 database there is an increase in the Si solubility in the Ti (α) phase in lower temperatures. The present assessment of the metastable Ti-Si phase diagram shows a better agreement with the experimental results2-4,6-7 near the eutectoid region, Ti(β) Ti(α) + Ti5Si3; and a more usual inclination of the
Ti(α) solvus line when compared with the assessed phase
diagram using the COST 507 database22.
Figure 4-a compares the stable and metastable eutectoid reactions in the Ti-rich corner of the Ti-Si phase diagram obtained in the present investigation, indicating that the metastable diagram presents, as expected, an increase in the Si solubility in the Ti(α) and Ti(β) phases and a decrease in the eutectoid temperature. Additionally, the Ti5Si3 phase in equilibrium with Ti3Si phase shows a slightly narrower range of Si solubility below the eutectic temperature, indicating higher Si solubility of the Ti5Si3 phase in equilibria with Ti(β) and Ti3Si phases (see Figure 4-b).
Table 5: Experimental and calculated equilibrium for the “stable” and “metastable” Ti-Si phase diagrams. Deviations between experimental
and calculated values above 5% were marked with (*).
Reaction Parameter Experimental Calculated Deviation (%)
L→Ti5Si3
T (K) 2403 2441 1.6
XSi(Ti
5Si3) 0.375 0.376 0.3
L→TiSi2
T (K) 1773 1757 0.9
XSi (TiSi
2) 0.667 0.667 0
L→β+ Ti5Si3
T (K) 1613 1638 1.6
XSi (L) 0.137 0.124 9.5*
XSi (β) 0.05 0.04 20*
XSi (Ti
5Si3) 0.36 0.356 1.1
L→TiSi2+Si
T (K) 1603 1604 0.1
XSi (L) 0.86 0.815 5.2*
XSi (TiSi
2) 0.667 0.667 0
XSi (Si) 1 1 0
L→TiSi2+TiSi
T (K) 1743 1747 0.2
XSi (L) 0.641 0.637 0.6
XSi (TiSi) 0.5 0.5 0
XSi (TiSi
2) 0.667 0.667 0
L+Ti5Si3→Ti5Si4
T (K) 2193 2172 1.0
XSi (L) 0.48 0.503 4.8
XSi(Ti
5Si3) 0.398 0.394 1.0
XSi(Ti
5Si4) 0.444 0.444 0
L+Ti5Si4→TiSi
T (K) 1843 1843 0
XSi (L) 0.60 0.604 0.7
XSi (Ti
5Si4) 0.444 0.444 0
XSi (TiSi) 0.5 0.5 0
β +Ti5Si3→Ti3Si
T (K) 1443 1443 0
XSi (β) 0.04 0.028 30*
XSi (Ti
5Si3) 0.36 0.359 0.3
XSi (Ti
3Si) 0.25 0.25 0
β→α+ Ti3Si
T (K) 1149 1143 0.5
XSi (β) 0.009 0.0088 2.2
XSi (α) 0.004 0.0037 7.5*
XSi(Ti
5Si3) 0.25 0.25 0
β→α+ Ti5Si3
T (K) 1130 1140 0.9
XSi (β) 0.011 0.0114 3.7
XSi (α) 0.005 0.0048 4.0
XSi(Ti
5Si3) 0.375 0.3651 2.7
Table 6: Calculated values of the enthalpy (kJ/mol of atoms) and entropy (J/mol.K) of the formation of the intermetallic phases at 298
K – present work – compared with values of enthalpy found in the literature11,20,25-30.
Phase
Average values of the enthalpy in the literature11,25-30
Ab-initio values of enthalpy20
Calculated values of enthalpy (kJ/mol of atoms)
Calculated values of entropy (J/mol.K)
Ti3Si -49.5 -47.11 -47.57 31.33
Ti5Si3 -73.9 -72.53 -74.12 25.78
Ti5Si4 -77.8 -74.63 -79.03 22.94
TiSi -74.0 -72.23 -77.53 20.94
Figure 1: a) Enthalpies for the formation of the Si–Ti compounds, comparing the calculated results of the present work with the values found in the literature11,20,25-30; b) Entropies for the formation of the
Si–Ti compounds.
Figure 2: Assessed “stable” Ti-Si phase diagram. a) General view
of the phase diagram, (β+Ti5Si3→Ti3Si and β→α+Ti3Si reactions); b) Detail of the eutectoid reaction, Ti(β) → Ti(α) + Ti3Si, in the
Ti-rich corner; c) Comparison between the present assessment and assessment (dotted lines) using COST 507 database22.
Ti5Si3 phases after heat-treatment at 1493K for 120 h of Ti-Si alloys with Si contents below 25 at %Si, see Figure 2. This observation might suggest some interstitial contamination of the alloys during the experimental work of Svechnikov et al.5.
Discrepancies were also observed in the investigation by Ramos
et al.16, which showed the presence of Ti
5Si3 phase instead of Ti3Si phase after isothermal heat-treatment for 90 hours at 1273K and 1373K of a Ti-25Si alloy, see Figure 2. Similarly, Costa et al.17 showed the presence of Ti(α) + Ti
3Si phases instead of Ti(β) + Ti3Si phases after isothermal treatment for 6 hours at 1273K of a Ti-13Si alloy, see Figure 2. These examples support previous suggestions made by Aaronson et al.6,7 “that further experimental work in the Ti-rich corner of the Ti-Si system is needed” to explain experimental disparities, especially near the eutectoid region of the Ti-rich corner of the Ti-Si phase diagram; and that “some of these experimental discrepancies could explained by interstitial contamination”.
More recently, Colinet and Tedenac20 indicated by ab-initio calculations that the question of the stability of the Ti3Si phase was in fact “controversial”; while Poletaev et al.21 showedby ab-initio calculations that the Ti5Si3 phase was essentially more stable than the Ti3Si phase at 0 K, adding a new light on the dispute over the stability of Ti3Si phase in the Ti-Si and Ti-X-Si systems. In this sense, the present assessments aim to inspire further experimental work in the eutectoid region of the Ti-rich corner of the Ti-Si phase diagram in order to investigate the stability of Ti3Si and Ti5Si3 phases; and the efect of interstitials on the stability of the Ti3Si phase. The microstructural design of
Figure 3: Assessed “metastable” Ti-Si phase diagram. a) General
view of the Ti-Si phase diagram; b) Detail of the eutectoid reaction, Ti(β) → Ti(α) + Ti5Si3, in the Ti-rich corner; c) Comparison between
the present assessment and assessment (dotted lines) using COST 507 database22 with suspended Ti
3Si phase.
Figure 4: Comparison of the calculated stable (dotted lines) and
metastable Ti-Si phase diagrams in the present investigation. a)
Detail of the eutectoid reaction; b) Detail of the Si-solubility range
of the Ti5Si3 phase.
must be stable at service temperatures, to improve the creep resistance1,21,32-36, so a better understanding of the Ti-rich corner of the Ti-Si phase diagram is needed.
4. Conclusions
Available experimental data allowed the calculation of the stable and metastable phase diagrams of the Ti-rich corner of the Ti-Si system.
The present assessment might be further improved by the use of a more complex description for the liquid phase and, more importantly, by the use of new experimental data near the eutectoid reaction of the Ti-rich corner of the Ti-Si phase diagram. The present assessment of the “metastable” Ti-Si phase diagram showed a better agreement with the experimental results near the eutectoid region, Ti(β) Ti(α) + Ti5Si3, and a more usual inclination of the Ti(α) solvus, when compared to the assessment using COST 507 database.
Further experimental work near the eutectoid region of the Ti-rich corner of the Ti-Si phase diagram is needed to solve the dispute over the stability of the Ti3Si and Ti5Si3 phases.
5. Acknowledgments
Prof. S. Wolynec, all from Universidade de São Paulo, and Dr.
A. H. Feller. This work is dedicated to the memories of Mr. A. C. Azevedo, Prof. H. M. Flower (Imperial College) and Mrs. B. F. Feller. The present investigation was funded by the Ministry of Education from Brazil (Coordination for the Improvement of Higher Education Personnel, CAPES) in a form of a MEng scholarship to Ms. M. Fiore.
6. References
1. Azevedo CRF. Phase Diagram and Phase Transformations in Ti-Al-Si System [PhD Thesis]. London:Imperial College, Department of Materials; 1996.
2. Hansen M, Anderko K. Constitutions of binary alloys. New York, Toronto, London: McGraw-Hill; 1958.
3. Sutclife DA. Alliage de titane et de silicium. Revue de Metallurgie. 1954;3:524-536.
4. Sutclife DA. Titanium-Silicon Alloys. Metal Treatment and Drop Forging. 1954;4:181-197.
5. Svechnikov VN, Kocherzhisky YA, Yupko LM, Kulik OG, Shinshkin
EA. Phase Diagram of the Titanium-Silicon System. Doklady Akademii Nauk SSSR. 1970;193(2):393-396.
6. Plichta MR, Williams JC, Aaronson HI. On the existence of the
β→αm transformation in the alloy systems Ti-Ag, Ti-Au, and Ti-Si. Metallurgical and Materials Transactions A. 1977;8(12):1885-1892. 7. Plitcha MR, Aaronson HI. The thermodynamic and kinetics of the
β->a
m transformation in three Ti-X systems. Acta Metallurgica.
1978;26(8):1293-1305.
8. Kaufman L. Coupled phase diagrams and thermochemical data for
transition metal binary systems-VI. Calphad. 1970;3(1):45-76. 9. Murray JL. Phase diagrams of titanium binary alloys. Novelty: ASM
International:; 1987. p.289-293.
10. Vahlas C, Chevalier PY, Blanquet E. A Thermodynamic Evaluation of Four Si-M (M=Mo, Ta, Ti, W) Binary System. Calphad. 1989;13(3):273-292.
11. Seifert HJ, Lukas HL, Petzow G. Thermodynamic Optimization of the Ti-Si system.Zeitschrift für Metallkunde. 1996;87(1):2-13. 12. Azevedo CRF, Flower HM. Microstructure and phase relationships in
Ti-Al-Si system. Materials Science and Technology. 1999;15(8):869-877. 13. Azevedo CRF, Flower HM. Experimental and calculated Ti-rich Corner
of the Ti-Al-Si Ternary Phase Diagram. Calphad. 2002;26(3):353-373. 14. Azevedo CRF, Flower HM. Calculated ternary diagram of Ti-Al-Si
system. Materials Science and Technology. 2000;16(4):372-381. 15. Bulanova M, Tretyachanko L, Golovkova M. Phase Equilibria in the
Ti-rich corner of the Ti-Al-Si System. Zeitschrift für Metallkunde. 1997;88(3):256-265.
16. Ramos AS, Nunes CA, Coelho GC. On the peritectoid Ti3Si formation
in Ti-Si alloys. Materials Characterization. 2006;56:107-111. 17. Costa AMS, Lima GF, Rodrigues G, Nunes CA, Coelho GC, Suzuki
PA. Evaluation of Ti3Si phase stability from heat-treated rapidly
solidiied Ti-Si alloys. Journal of Phase Equilibria and Difusion. 2010;31(1):22-27.
18. Li Z, Liao C, Liu Y, Wang X, Wu Y, Zhao M, et al. 700 ºC Isothermal
Section of the Al-Ti-Si Ternary Phase Diagram. Journal of Phase
Equilibria and Difusion. 2014;35(5):564-574.
19. Kozlov AY, Pavlyuk VV. Investigation of the interaction between the components in the Ti -{Si, Ge}- Sb systems at 670 K. Journal of Alloys and Compounds. 2004;367(1-2):76-79.
20. Colinet C, Tedenac JC. Structural stability of intermetallic phases in the Si-Ti system. Point defects and chemical potentials in
D88-Si3Ti5 phase. Intermetallics. 2010;18(8):1444-1454. 21. Poletaev DO, Lipnitskii AG, Kartamyshev AI, Aksyonov DA,
Tkachev ES, Manokhin SS, et al. Ab initio-based prediction and TEM study of silicide precipitation in titanium. Computational Materials Science. 2014;95:456-463.
22. European Cooperation in the Field of Scientiic and Technical Research, European Commission. COST 507 - Deinition of
thermochemical and thermophysical properties to provide a database for the development of new light alloys. Vol 1. Proceedings of the Final Workshop of COST 507, Vaals; 1997.
Luxembourg: Oice for Oicial Publications of the European Communities; 1998. Vol 2. Ansara I, Dinsdale AT, Rand MH, eds. Thermochemical Database for Light Metal Alloys Luxembourg: Oice for Oicial Publications of the European Communities; 1998. Vol 3. Efenberg G, ed. Critical Evaluation of Ternary Systems. Luxembourg: Oice for Oicial Publications of the
European Communities; 1998.
23. Lukas HL, Fries SG, Sundman B. Computational Thermodynamics: The Calphad Method. Cambridge: Cambridge University Press; 2007. 24. Okamoto H. The C-Fe (carbon-iron) System. Journal of Phase
Equilibria. 1992;13(5):543-565.
25. Robins DA, Jenskins I. The heats of formation of some transition
metal silicides. Acta Metallurgica. 1955;3(6):598-604. 26. Topor L, Kleppa OJ. Standard enthalpies of formation of TiSi2
and VSi2 by high-temperature calorimetry. Metallurgical and Materials Transactions A. 1986;17(7):1217-1221.
27. Maslov VM, Neganov AS, Borovinskaya IP, Merzhanov AG. Self-propagating high-temperature synthesis as a method for determination of the heat of formation of refractory compounds. Combustion, Explosion and Shock Waves. 1978;14(6):759-767.
28. Kematick RJ, Myers CE. Thermodynamics of the Phase Formation of the Titanium Silicides. Chemistry of Materials. 1996;8(1):287-291. 29. Meschel SV, Kleppa OJ. Standard enthalpies of formation of some
3d transition metal silicides by high temperature direct synthesis calorimetry. Journal of Alloys and Compounds. 1998;267(1-2):128-135.
30. Coelho GC, David N, Gachon JC, Nunes CA, Fiorani JM, Vilasi
M. Entalpias de formação de fases intermetálicas dos sistemas Ti–Si, Ti–B e Ti–Si–B medidas por calorimetria de síntese direta. In: Associação Brasileira de Metalurgia e Materiais. Anais do 61° congresso Anual da ABM. Rio de Janeiro, Brasil. São Paulo: ABM; 2006. p. 1300-1308.
31. Thermo-Calc Data optimization User Guide, Version 2015a. Foundation of Computational Thermodynamics Stockholm, Sweden. [Accessed: 2015 Nov 15]. Available from: http://www.thermocalc.com/
media/30890/Data-Optimisation-User-Guide-for-Thermo-Calc.pdf
32. Frommeyer G, Rosenkranz R, Lüdecke C. Microstructure and properties of the refractory intermetallic Ti5Si3 compound and the unidirectionally solidiied eutectic Ti-Ti5Si3alloy. Zeitschrift für Metallkunde. 1990;81:307-313.
33. Zhang L, Wu J. Ti5Si3-based alloys: alloying behavior, microstructure and mechanical property evaluation. Acta Materialia. 1998;46(10):3535-3546. 34. Kishida K, Fujiwara M, Adachi H, Tanaka K, Inui H. Plastic deformation of single crystals of Ti5Si3 with the hexagonal D88 structure. Acta Materialia. 2010;58(3):846-857.
35. Williams JJ. Structure and high-temperature properties of Ti5Si3 with interstitial additions [PhD Thesis]. Iowa: Iowa State University; 1999.
36. Kastenhuber M, Rashkova B, Clemens H, Mayer S. Enhancement of creep properties and microstructural stability of intermetallic
Annex 1: Thermodynamic description of the phases of the Ti-Si system
LIQUID
EXCESS MODEL IS REDLICH-KISTER_MUGGIANU
CONSTITUENTS: SI,TI
G(LIQUID,SI;0)-H298(DIAMOND_A4,SI;0) =
298.15<T< 1687.00: +50696.4-30.0994*T+2.09307E-21*T**7+GHSERSI
1687.00<T< 6000.00: +49828.2-29.5591*T+4.20369E+30*T**(-9)+GHSERSI
G(LIQUID,TI;0)-H298(HCP_A3,TI;0) =
298.15<T< 1300.00: +12194.415-6.980938*T+GHSERTI
1300.00<T< 1941.00: +368610.36-2620.99904*T+357.005867*T*LN(T)-.155262855*T**2+1.2254402E-05*T**3-65556856*T**(-1)+GHSERTI
1941.00<T< 6000.00: +104639.72-340.070171*T+40.9282461*T*LN(T)-.008204849*T**2+3.04747E-07*T**3-36699805*T**(-1)+GHSERTI
L(LIQUID,SI,TI;0) = -255852.17+21.87411*T L(LIQUID,SI,TI;1) = +25025.35-2.00203*T L(LIQUID,SI,TI;2) = +83940.65-6.71526*T
BCC_A2
EXCESS MODEL IS REDLICH-KISTER_MUGGIANU
2 SUBLATTICES, SITES 1: 3
CONSTITUENTS: SI,TI: VA
G(BCC_A2,SI:VA;0)-H298(DIAMOND_A4,SI;0) = +47000-22.5*T+GHSERSI G(BCC_A2,TI:VA;0)-H298(HCP_A3,TI;0) =
298.15<T< 1155.00: -1272.064+134.71418*T-25.5768*T*LN(T)
-6.63845E-04*T**2-2.78803E-07*T**3+7208*T**(-1)
1155.00<T< 1941.00: +6667.385+105.366379*T-22.3771*T*LN(T)+
.00121707*T**2-8.4534E-07*T**3-2002750*T**(-1)
1941.00<T< 4000.00: +26483.26-182.426471*T+19.0900905*T*LN(T)
-.02200832*T**2+1.228863E-06*T**3+1400501*T**(-1)
L(BCC_A2,SI,TI:VA;0) = -275629.1+42.5094*T L(BCC_A2,SI,TI:VA;1) = +25025.35-2.00203*T L(BCC_A2,SI,TI:VA;2) = +83940.65-6.71526*T
DIAMOND_A4
EXCESS MODEL IS REDLICH-KISTER_MUGGIANU
CONSTITUENTS: SI,TI
G(DIAMOND_A4,SI;0)-H298(DIAMOND_A4,SI;0) = +GHSERSI G(DIAMOND_A4,TI;0)-H298(HCP_A3,TI;0) = +25000+GHSERTI L(DIAMOND_A4,SI,TI;0) = +80*T
HCP_A3
EXCESS MODEL IS REDLICH-KISTER_MUGGIANU
2 SUBLATTICES, SITES 1: .5
CONSTITUENTS: SI,TI : VA
G(HCP_A3,SI:VA;0)-H298(DIAMOND_A4,SI;0) = +49200-20.8*T+GHSERSI G(HCP_A3,TI:VA;0)-H298(HCP_A3,TI;0) = +GHSERTI
L(HCP_A3,SI,TI:VA;0) = -302731.04+69.08469*T L(HCP_A3,SI,TI:VA;1) = +25025.35-2.00203*T L(HCP_A3,SI,TI:VA;2) = +83940.65-6.71526*T
SI2TI
2 SUBLATTICES, SITES 2: 1
CONSTITUENTS: SI: TI
G(SI2TI,SI:TI;0)-2*H298(DIAMOND_A4,SI;0)-H298(HCP_A3,TI;0) =
SI4TI5
2 SUBLATTICES, SITES 4: 5
CONSTITUENTS: SI : TI
G(SI4TI5,SI:TI;0)-4*H298(DIAMOND_A4,SI;0)-5*H298(HCP_A3,TI;0) =
-711000+22.37355*T+4*GHSERSI+5*GHSERTI
SITI
2 SUBLATTICES, SITES 1: 1
CONSTITUENTS: SI : TI
G(SITI,SI:TI;0)-H298(DIAMOND_A4,SI;0)-H298(HCP_A3,TI;0) = -155061.7
+7.6345*T+GHSERSI+GHSERTI
SITI3
2 SUBLATTICES, SITES 1: 3
CONSTITUENTS: SI : TI
G(SITI3,SI:TI;0)-H298(DIAMOND_A4,SI;0)-3*H298(HCP_A3,TI;0) = +V1+V2*T +V3*T*LN(T) +GHSERSI+3*GHSERTI
SI3TI5
EXCESS MODEL IS REDLICH-KISTER_MUGGIANU
3 SUBLATTICES, SITES 2: 3: 3
CONSTITUENTS: SI,TI : SI,TI: TI
G(SI3TI5,SI:SI:TI;0)- 5*H298(DIAMOND_A4,SI;0)-3*H298(HCP_A3,TI;0) =
+V11+V12*T+5*GHSERSI+3*GHSERTI
G(SI3TI5,TI:SI:TI;0)-3*H298(DIAMOND_A4,SI;0)-5*H298(HCP_A3,TI;0) =
+V21+V22*T+5*GHSERTI+3*GHSERSI
G(SI3TI5,SI:TI:TI;0)-2*H298(DIAMOND_A4,SI;0)-6*H298(HCP_A3,TI;0) =
+V31+V32*T+2*GHSERSI+6*GHSERTI
G(SI3TI5,TI:TI:TI;0)-8*H298(HCP_A3,TI;0) = +40000+20*T+8*GHSERTI
L(SI3TI5,SI:SI,TI:TI;0) = +V41+V42*T L(SI3TI5,TI:SI,TI:TI;0) = +V41+V42*T L(SI3TI5,SI,TI:SI:TI;0) = +V51+V52*T L(SI3TI5,SI,TI:TI:TI;0) = +V51+V52*T