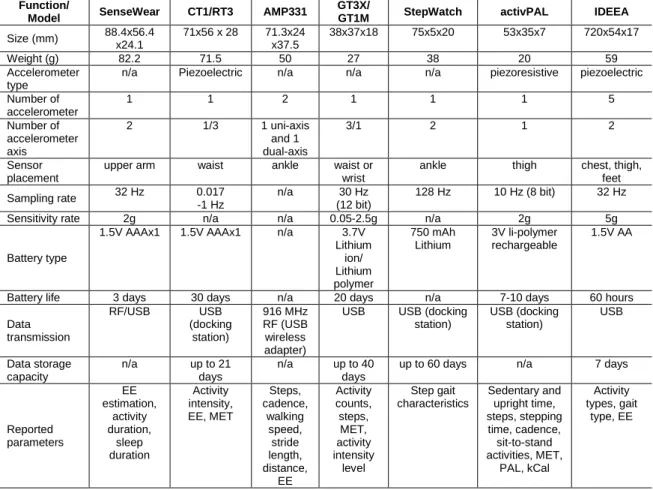
Accelerometer-Based Physical Activity Levels and Sedentary Behavior under Free-Living Conditions in Thai Adolescents.
240
0
0
Texto
(2) Konharn, K. (2012) Accelerometer-based physical activity levels and sedentary behavior under free-living conditions in Thai adolescents. Dissertação apresentada às provas de Doutoramento em Actividade Física e Saúde. Centro de Investigação em Actividade Física, Saúde e Lazer, Faculdade de Desporto da Universidade do Porto. KEY WORDS: ACCELEROMETER, ADOLESCENT, BODY COMPOSITION, GUIDELINES AND RECOMMENDATIONS, OBESITY, PHYSICAL ACTIVITY. II.
(3) “Imagination is more important than knowledge”. Albert Einstein, 1879-1955 A German-born theoretical physicist who developed the theory of general relativity effecting a revolution in physics.. “All truths are easy to understand once they are discovered; the point is to discover them”. Galileo Galilei, 1564-1642 An Italian physicist, mathematician, astronomer and philosopher who played a major role in the Scientific Revolution.. “When you can measure what you are speaking about, and express it in numbers, you know something about it; when you cannot express it in numbers, your knowledge is of a meager and unsatisfactory kind; it may be the beginning of knowledge, but you have scarcely, in your thoughts, advanced to the stage of science, whatever the matter may be”. William Thomson (Lord Kelvin), 1824-1907 A British mathematical physicist and engineer who did important work in the mathematical analysis of electricity and formulation of the first and second laws of thermodynamics, and did much to unify the emerging discipline of physics in its modern form; the temperature unit “Kelvin” is named in his honor.. III.
(4) IV.
(5) This thesis is dedicated to the Konharn family. V.
(6) VI.
(7) Funding. The thesis project was supported by a doctoral grant from Portuguese Foundation for Science and Technology (FCT: SFRH/BD/60557/2009) and Khon Kaen University, Thailand.. This work was developed in the Research Centre in Physical activity, Health and Leisure, Faculty of Sports, University of Porto, Portugal. VII.
(8) VIII.
(9) Acknowledgements. The data collection for this thesis was carried out in Thailand and was supported by the Research Centre in Physical Activity, Health and Leisure (CIAFEL), Faculty of Sports, University of Porto when I was fortunate to study four wonderful years in the astonishingly beautiful and diverse land with a rich history of seafaring and discovery such as Portugal. Although I could not choose just one moment in my life that I felt was my greatest achievement because every component is important to me. However, if I had to choose one thing, it would be living and studying here because it allowed me to meet so many wonderful people that have made a positive impact on my life, and, therefore, have been involved in the completion of this thesis without doubt. I will always remember those people who helped me along the way. I would like to express my sincere gratitude and appreciation to those who have made the completion of this thesis possible. I am indebted to them for their help. First and foremost, I have been expressed my deepest appreciation and sincere thanks to my main supervisor: Professor Dr. José Carlos Ribeiro, and my co-supervisor: Professor Dr. Maria Paula Santos, for serving as my supervisors throughout my time as the PhD candidate, and for your expert contribution and excellent advice. I have difficulty putting into words my appreciation for the work you have undertaken in order to develop my skills and knowledge to become a good researcher. Both of you are very kind and helpful advisors to me and taught me the value of hard work and keep doing the right thing. I greatly appreciate all the feedback, assistance and time that you have provided me over the past four years. Thank you so much for their countless efforts and times to pushed me up from the simple people to become the real researcher. Thank you for always believing in me and encouraging me to pursue my dreams, I am very proud and great honor to studying and working with both of you. Absolutely, you are my inspiring researchers and professors. Your comments and advice will always be appreciated. I would also like to thank all professors for serving on my Ph.D. final examination committee for their direction, dedication, and invaluable advice. IX.
(10) along this thesis. Thanks for a truly challenging and enlightening me to do more and to think harder. I highly appreciate the insightful comments of the anonymous reviewers on our 4 manuscripts. They have made some valuable suggestions that have led to big improvements the manuscripts and the thesis. I would like to express my sincere gratitude once again for the generous and very helpful financial support of my research in Portugal granted by the Portuguese Foundation for Science and Technology (FCT). I have been indebted to all Portuguese people. I would also like to take this opportunity to express my heartfelt thanks to Khon Kaen University (KKU), in particular Assoc.Prof.Dr. Kulthida Tuamsuk (the former Vice President for Academic and International Affairs), for giving me the opportunity and scholarship to study abroad at University of Porto (UP) – one of the 100 best universities in Europe. Studying here is an excellent opportunity to learn many things and also to practice my English and Portuguese. Additionally, I would like to sincerely thanks to KKU for offering me the position as a full-time permanent lecturer, it is a great honor and privilege for me to work there. I would like to dedicate this doctoral thesis to my parents: Ajarn Kongchai Konharn and Ajarn Rutchaneeporn Konharn, who have supported me without falter through every moment of my life plus devoting their time and money to prepare me with a solid academic background. I am extremely grateful to have them as my parents. Mommy Daddy! both of you are without doubt the most precious to me! My love for you is measureless. I hope I have made you proud of me. This thesis is also dedicated to my beloved sisters: Mrs. Rochinee Tunthong and Miss Lalita Konharn, who always stay beside me and their tremendous support and encouragement. Thank you Mr. Weerawat Tunthong, my brother-in-law for all his kindness to me. To Miss Paramaporn Sangpara, my wonderful beloved girlfriend who makes my life worth living, you are the best statistics teacher I have ever known – “Poope! Words can’t express what you mean to me”.. X.
(11) I would like to thank the Faculty of Sports (FADEUP), in particular the Research centre in Physical activity, Health and Leisure (CIAFEL) for its acceptation and support over the past four years. Moreover, thanks for providing me and my PhD friends the invaluable opportunity to attend lectures, seminars, conferences and meet so many famous academic and professional researchers/professors in related fields. I am very grateful to have been part of the CIAFEL study research team. Thank you for all CIAFEL professors, and I would especially like to convey my profound gratitude to Prof.Dr. Jorge Mota, Prof.Dr. José Oliveira, Prof.Dr. José A. Duarte, Prof.Dr. Joana Carvalho, Prof.Dr. Jorge Olímpio Bento and all invited professors/lecturers who gave me many worth lectures and knowledge over the course: your exceptional support and caring throughout the 4 years of my doctoral-studies odyssey has been essential to my completing this formative journey. I promise I will be use and extending the entire thing you have given me to be worth as much as I can. Special thanks to P´ Rojapon Buranarugsa, my Thai friend to Portugal who will always be my best friend and brother. It could be difficult for me staying here without you. I am looking forward to working with you at KKU. I hopefully all the hard work we did here will be worth it all for our nation in the long run. Thanks to all my PhD friends who have provided me years of friendship and always help me during studying in Porto, Portugal, especially Dr. Daniel Gonçalves, Dr. Gustavo Silva, Dr. Luísa Soares-Miranda, Dr. Flávia Canuto, Nórton Oliveira, Lucimére Bohn, Dr. Elisa Marques, Dr. Helder Fonseca, Hugo Valente, Dr. Luísa Aires, Dr. Fernando Ribeiro, Dr. Susana Vale, António, Dr. Alberto Alves, Andreia Pizarro, Susana Carrapatoso, Carina Novais, and Piyaporn Tumnark. I have been so fortunate to meet many charming and inspiring friends like all of you. I would like to extend my wholehearted appreciation for all that you have done for me. Importantly, I hope we can continue to work together in the future. To Daniel Gonçalves, my best Portuguese friend, thank you for always ready to help me for everything all the time, I also miss your taking care of me by bringing me to hospital in the early morning and was standing over me until I. XI.
(12) downed. You have become a kind of mentor to me; you have a good insight in both professional and personal lives. There are so many things you have done for me, there is nothing to forget. My blessings to you are unlimited. To Joana Teixeira and Leatitia Teixeira, thank you for your kindness and help on the data analysis. It is always a pleasure to work with you. Writing the papers and thesis in the English has been a very great challenge for me. Christopher Young, my Scottish friend and a PhD candidate in faculty of Sciences (FCUP) helped me read and edit all of them. I realized that being a Ph.D. candidate is really hard and have plenty of work to do, and it is quite hard to get a free time for other things; however, you always helped me without any conditions and made those my works possible. Thanks you for the friendship and immeasurable help. I also would like to thank to Luísa Aires for a well-written Portuguese abstract version. Please accept my gratitude and deep appreciation. Many thanks to the International Relations Office staffs (Cristina Claro, Hugo Silva, Rita Sinde) of FADEUP and of UP rectory to help me in all processes of study here; as well as, the FADEUP secretariat staffs for all important documents and advices. The whole office staff is very friendly and always greeted me with a smile as soon as I walked into the office. Thank you to all staffs in the FADEUP library for every friendly smile and the warmest welcome and helpful in every time I get in there, particularly for creating a good atmosphere to work in. Thank to Michel Mendes and André David, the professional computer technician, when I need some help in various technical and computer problems, they always give me a suggestion and help me to solve it. Thanks also to my Portuguese family from Vale de Camba, Fernanda, Carlos, Maria, Daniel, Nelson, Cátia, and Carlitos, for having welcomed me into their home with open arms in many times. I very much appreciate and impress on my heart. I am grateful to Assoc.Prof.Dr. Tanomwong Kritpet, Assist.Prof.Dr. Anucha Nilprapan, Assoc.Prof.Dr. Nomjit Nualnetr and Lecturer Klauymai Promdee who are my advisor when I was a master and bachelor student.. XII.
(13) Thank you for their strong belief and interest to me. I would never have been able to get this far without their help and constant support. Thank to Science and Paranhos university residents of SASUP for provided the nice room, the good facilities, and created an excellent atmosphere to stay and study. To Dr. Américo Dimante, my Paranhos resident mate to always helped me and kindly explained to me when I have problem in the first-year life in Portugal, and made a special warm environment for me. I would like to thank all subjects and their parents, school administers, and teachers who were participated in this study. None of this would have been possible without your commitment and selflessness. Thank to the Faculty of Sports Sciences, Chulalongkorn University for supported the physical fitness instrument and its accessories. It has been my great honor and privilege to work with the Royal Thai Embassy to Portugal while I was studying in Portugal, thanks to the entire staff and protocols of Ministry of Foreign Affairs of Thailand for allowing me to experience so many things I have never experienced before. To all of you my dear friends, including Thais in Portugal that I have not mentioned here, you always be my important persons, I also wish to warmly acknowledge you all.. Porto, 2012. Kurusart Konharn. XIII.
(14) XIV.
(15) Table of Contents. Acknowledgements. IX. List of Figures. XIX. List of Tables. XXI. List of Equations. XXIV. Abstract. XXV. Resumo. XXVII. บทคัดยอ. XXIX. List of Abbreviations. XXXI. Chapter I – Introduction and Background. 3. 1. Prevalence and trends in overweight and obesity among children and adolescents. 4. 1.1 Worldwide trends in childhood overweight and obesity. 4. 1.2 The prevalence of childhood overweight and obesity in Asia. 6. 1.3 Prevalence and determinants of childhood overweight and obesity in Thailand. 7. 2. Potential determinants of childhood obesity and overweight Prevalence trends. 9. 2.1 Differences in prevalence associated with age and gender. 9. 2.2 Differences in prevalence associated with socioeconomic status. 10. 2.3 Differences in prevalence associated with racial or ethnicity. 11. 2.4 Differences in prevalence associated with geographical areas. 12. 3. Standard definition of child overweight and obesity worldwide. 14. 4. Prevention of overweight and obesity. 16. 5. Definition, dimension, and classification of physical activity. 17. 5.1 Definition of physical activity. 17. 5.2 Dimension of physical activity. 18. 5.3 Sedentary behaviors. 20. 6. Health benefits of physical activity in children and adolescents. XV. 21.
(16) Table of Contents (continued). 7. Physical activity and health-related physical fitness in children and adolescents. 22. 7.1 Body mass index. 23. 7.2 Body fat percentages. 23. 7.3 Waist circumference. 24. 8. Physical activity guidelines for children and adolescents. 24. 9. Socio-demographic characteristics and physical activity in children and adolescents. 25. 9.1 Gender and age. 25. 9.2 Race and ethnicity. 28. 9.3 Family socioeconomic status and background. 28. 9.4 Geographic location and neighborhood built environment. 30. 9.5 School travel modes. 31. 10. Surveys and surveillance of physical activity and sedentary behavior in children and adolescents. 32. 10.1 Global and Western prevalence. 33. 10.2 Prevalence in Asia and Oceania. 34. 10.3 Prevalence in Thailand. 35. 11. Physical activity assessment techniques for children and adolescents. 36. 12. Rationale for consideration using accelerometers to measure physical activity and sedentary behavior in children and adolescents. 40. 12.1 Function of the accelerometer. 41. 12.2 Feasibility and validity of accelerometer measurements to assess physical activity in children and adolescents. 43. 12.3 Accelerometer cut-off points for predicting time spent in children’s physical activity. 45. 13. Background of Thailand in brief. 48. 14. Rationale and Significance of the Study. 50. 15. Objectives of the Study. 52. 16. Structure of the thesis. 53. XVI.
(17) Table of Contents (continued). REFERENCE. 54. Chapter II – Methodology and Procedure. 69. 1. Study design. 69. 2. Theoretical and Conceptual framework. 69. 3. Participants. 69. 3.1 Sites and recruitment of participants. 69. 3.2 Eligibility Criteria. 70. 3.3 Research ethics. 70. 4. Participant’s characteristic measurements. 71. 4.1 Adolescents. 71. 4.2 Parent or Guardians. 72. 5. Anthropometric measures and Health-related physical fitness test. 73. 5.1 Weight, Height and BMI. 73. 5.2 Body fat percent. 74. 5.3 Waist circumferences. 75. 6. Physical activity assessment and Data reduction. 75. 6.1 Physical activity assessment using accelerometer. 75. 6.2 Accelerometer data reduction. 79. 7. Statistical Analysis. 83. REFERENCE. 85. Chapter III – Research Papers. 89. Paper I : Differences between weekday and weekend levels of moderate-to-vigorous physical activity in Thai adolescents. 91. Paper II : Differences in physical activity levels between urban and rural school adolescents in Thailand. 105. XVII.
(18) Table of Contents (continued). Paper III : Associations between school travel modes and objectively measured physical activity levels in Thai adolescents. 129. Paper IV : Socioeconomic Status and Objectively Measured Physical Activity in Thai Adolescents. 153. REFERENCE. 172. Chapter IV – General Discussion. 185. 1. Overview of the thesis. 185. 2. Discussion of main findings. 186. 2.1 Overweight and obesity prevalence in Thai adolescents. 186. 2.2 Gender differences in physical activity. 188. 2.3 Age differences in physical activity. 189. 2.4 Differences in physical activity between urban and rural school adolescents. 190. 2.5 BMI, body composition and physical activity. 191. 2.6 Physical activity differences in accordance with week periods. 193. 2.7 Influence of family background and socioeconomic status on physical activity. 194. 2.8 Modes of transportation to school and physical activity. 195. 3. Study limitations and further researches. 197. REFERENCE. 198. Chapter V – Main Conclusions and Future directions. 205. 1. Main conclusions. 205. 2. Future directions. 206. REFERENCE. 207. XVIII.
(19) List of Figures. CHAPTER I Figure 1. – Change in the combined prevalence of overweight and obesity among school-age children in surveys since 1970…………………………………………………………….. 6. Figure 2. – Framework for factors associated with childhood overweight and obesity………………………………………………13. Figure 3. – Interacting factors those are responsible for the development of overweight and obesity………………………..… 17. Figure 4. – The benefits of changing sedentary people to exercising people have the greatest potential for public health benefit…………….. 21. Figure 5. – Anatomical terms used to describe position/direction and planes/axis……………………………………………………… 44. Figure 6. – Map of Thailand: divided by provinces……………………….… 49. Figure 7. – Population density by provinces (per square kilometer) in Thailand (2000)………………………………………………...… 50. CHAPTER II Figure 1. – Plausible causal paths for physical activity, fitness, and health…………...……………………………………… 69. Figure 2. – The uni-axial ActiGraph accelerometer (GT1M)……….……… 75. Figure 3. – Study methodology from eligible participants to those who agreed to include in the analysis flow chart………..………. 84. CHAPTER IIII Paper I Figure 1. – Distribution of mean minutes and standard deviations of MVPA for monitored physical activity during the weekday by age and gender…………………………………………………. 98. XIX.
(20) List of Figures (continued). Figure 2. – Distribution of mean minutes and standard deviations of MVPA for monitored physical activity during the weekend by age and gender…………………………………………………. 99. Figure 3. – Distribution of mean minutes and standard deviations of MVPA for monitored physical activity on whole week by age and gender………………………………………...…..……. 99. Figure 4. – Percentage of participants who meet the recommended activity guidelines of 60 minutes of MVPA per day on weekdays, weekends and entire week by gender………………………...… 100. Paper III Figure 1. – Prevalence of school travel modes, divided by gender…...… 143. Figure 2. – Prevalence of school travel modes, divided by school location……………………………………………………... 143. Figure 3. – Prevalence of school travel modes, divided by SES……….…146. Figure 4. – Prevalence of school travel modes, divided by age groups… 146. XX.
(21) List of Tables. CHAPTER I Table 1. – International body mass index cut-offs for overweight and obesity by sex between 2 and 18 years old, defined to pass though body mass index 25 and 30 kg/m2 at age 18 years old……………………………………………………….…. 15. Table 2. – Advantage and disadvantages of various assessment methods………………………………..…………………………..… 38. Table 3. – Comparison of technical specifications for each type of commercially available accelerometers…………………...……… 42. Table 4. – Comparison of validation criteria from various calibration studies in children and adolescents…………………………….… 47. Table 5. – The titles, specific objectives, and status of each paper included in the thesis………..……………………………………… 53. CHAPTER II Table 1. – Sample size and study variables…………………………..……. 70. Table 2. – Age-specific count per minute (cpm) cut-points adapted by Freedson et al’s method…………..…………………. 82. Table 3. – Statistical tests applied in the different papers…….………….. 83. CHAPTER IIII Paper I Table 1. – Descriptive of Participant’s Characteristics………...……..…… 97. Table 2. – Differences in time spent (minutes) in MVPA levels between genders, during weekdays, weekend days, and entire week, and its correlation with BMI…...……………… 100. Paper II Table 1. – Demographic characteristics of the study participants……… 114. XXI.
(22) List of Tables (continued). Table 2. – Mean minutes per day spent at each activity level between urban and rural school adolescents, divided by gender………. 116. Table 3. – Mean minutes per day spent at each activity level between urban and rural school adolescents, divided by BMI classification………………...…………………………….. 117. Table 4. – Mean minutes per day spent at each activity level between urban and rural school adolescents, divided by age group…… 119. Table 5. – Differences (in %) of adolescents meeting the guidelines (of 60 minutes of MVPA per day) between urban and rural school adolescents, according to gender and BMI classification…………………………………………….. 120. Table 6. – Differences (in %) of adolescents meeting the guidelines (of 60 minutes of MVPA per day) between urban and rural school adolescents, according to age group and for all participants………………………………………………….. 120. Paper III Table 1. – Descriptive characteristics of the participants………...……… 138. Table 2. – Descriptive characteristics of the participants regarding school travel modes…………………………………… 137. Table 3. – Time spent in MVPA (in minutes) on school travel modes…. 140. Table 4. – Result of Multinomial logistic regression analysis predicting active status on average daily MVPA (at 4 quartiles groups) with school travel, adjusted by age and gender…...…………… 141. Table 5. – Compliance of adolescents who meet the physical activity guidelines (≥ 60-minutes MVPA) between modes of travel to school [presented as percentage (%)]……………...…………… 142. XXII.
(23) List of Tables (continued). Paper IV Table 1. – Prevalence of participant characteristics associated to their household socioeconomic status (SES)………...……... 160. Table 2. – Mean (±Standard Deviations) of participant characteristics in accordance with their gender and household socioeconomic status (SES)…………………………...…………………………… 162. Table 3. – Household socioeconomic status related to their daily objectively measure physical activities in minutes in accordance with its week periods [expressed as means (SD).. 163. Table 4. – Daily sedentary behavior and moderate-to-vigorous physical activity differences (expressed as means and SD) among household socioeconomic status (SES) and the 7 correlation with participants’ measured variables……...………. 164. Table 5. – Household socioeconomic status (SES) and compliance of the 60-minutes of physical activity guidelines [presented as frequency (n) and percentage (%), respectively]………….…… 165. XXIII.
(24) List of Equations. CHAPTER II Equation 1. – A regression equation that estimates metabolic equivalent from accelerometer counts………………………………………. 81. XXIV.
(25) Abstract. The prevalence of childhood overweight/obesity (OW/OB) is increasing rapidly in most parts of the world, including in Thailand. More investigations are required to help improve our understanding of the links between physical activity (PA) and health. Unfortunately, the relationship between habitual PA and health for Thai adolescents is still less understood. Moreover, the assessment of PA needs to be accurately quantified using appropriate methods. Accelerometers provide an objective measure of habitual activity which is valid, reliable, and feasible in children and adolescents. The purpose of this crosssectional study was to characterize levels of objectively measured PA and sedentary behavior (SED) in adolescents from northeast Thailand. Among 186 samples (92 boys and 94 girls) of 13- to 18-year-old adolescents with randomly selected sampling included an equal proportion of main characteristics distribution. Objective activity was measured using ActiGraph accelerometers (GT1M) that were worn for 7 consecutive days during all waking hours. The mean daily PA levels were expressed in minute of time engaging, and were calculated by using age-specific cut-off points. The results showed that, according to IOTF classification of BMI categories, the prevalence of OW/OB in Thai adolescents was 23.1%. At all ages, boys were significantly more active than girls (p < 0.01). Moderate-to-vigorous PA (MVPA) levels were greater during weekdays compared to weekends. SED time was significantly higher in urban adolescents (p < 0.01). Regardless of their OW/OB group, rural adolescents had significantly more minutes of MVPA compared to adolescents from urban (p < 0.05). However, the daily compliance with PA guidelines was also similar between urban and rural areas. Adolescents who walked or bicycled to school had higher in MVPA than those who traveled by motorized transport particularly girls and rural adolescents (p < 0.01). According to socioeconomic status (SES), adolescents of low-income families accumulated more minutes of daily MVPA (p < 0.01) and less of SED (p < 0.05) than those of high-income families. Moreover, low-SES girls achieved the PA guidelines more than those in the other two groups (p < 0.01). This thesis has increased the. XXV.
(26) knowledge about adopting PA habits in routine daily life, informing an effort to halt or reverse trends in OW/OB among adolescents, and PA promotion has been identified as a key focus of efforts to promote health, therefore, potentially effective strategies to increase adolescents’ PA in school, family, and community settings adolescents are urgently needed.. Key words: ACCELEROMETER, ADOLESCENT, BODY COMPOSITION, GUIDELINES AND RECOMMENDATIONS, OBESITY, PHYSICAL ACTIVITY. XXVI.
(27) Resumo. A prevalência do excesso de peso/obesidade (SP/O) está a aumentar rapidamente na maior parte do mundo, incluindo a Tailândia. São necessárias mais investigações que ajudem a melhorar ou entender as relações entre atividade física (AF) e a saúde. Infelizmente, a relação entre a AF habitual e saúde em adolescentes tailandeses ainda é menos compreendida. Além disso, a avaliação da AF precisa ser quantificada com precisão através de métodos apropriados. Os acelerómetros fornecem uma medida objetiva da atividade habitual, é um instrumento válido, fiável e viável em crianças e adolescentes. O objetivo deste estudo transversal foi caracterizar os níveis de AF avaliados de forma objetiva e o tempo de atividades sedentárias (SED) em adolescentes do nordeste da Tailândia. A amostra compreendeu 186 crianças (92 rapazes e 94 raparigas) de 13 a 18 anos de idade e foi selecionada aleatoriamente de forma a incluir uma igual proporção de distribuição das características principais. A atividade foi medida objetivamente usando acelerómetros ActiGraph (GT1M) que foram colocados durante 7 dias consecutivos durante o dia e retirados durante o sono. Os níveis médios da AF diária foram expressos em minutos e foram calculados utilizando pontos de corte específicos à idade. Os resultados mostraram que, de acordo com a classificação da IOTF para as categorias de IMC, a prevalência de SP/O em adolescentes tailandesa foi de 23,1%. Em todas as idades, os rapazes foram significativamente mais ativos que as raparigas (p <0,01). As atividades de intensidades moderadas a vigorosas (AFMV) foram mais elevadas durante a semana em comparação com fins de semana. O tempo em SED foi significativamente maior em adolescentes da zona urbana (p <0,01). Independentemente do grupo SP/O, os adolescentes da zona rural apresentaram significativamente mais minutos de AFMV quando comparados com os adolescentes da zona urbana (p <0,05). No entanto, o cumprimento diário das recomendações internacionais da AF para a saúde foi semelhante entre as áreas urbana e rural. Os adolescentes que faziam o seu trajeto para a escola de bicicleta apresentaram níveis mais elevados de AFMV em relação aos seus pares que viajavam de transporte motorizado, em. XXVII.
(28) particular para as raparigas e adolescentes da zona rural (p <0,01). De acordo com o estatuto socioeconómico (ESE), os adolescentes de famílias de baixo rendimento, acumularam mais minutos diários AFMV (p <0,01) e menos de SED (p <0,05) do que as de famílias de rendimento mais elevado, além disso, um maior número de raparigas de baixo ESE alcançaram os níveis recomendados de PA comparativamente aos outros dois grupos (p <0,01). Esta tese contribuiu para o conhecimento sobre a adoção de hábitos da AF na rotina do dia a dia, a promoção da AF foi identificada como um dos principais focos de interesse para promover a saúde e para parar ou inverter as tendências de aumento do SP/O entre os adolescentes. É portanto necessário e urgente criar estratégias potencialmente eficazes que incluam a escola, a família ou o envolvimento da comunidade para aumentar a AF de adolescentes.. Palavras. chave:. ACELEROMETRO,. ADOLESCENTE,. COMPOSIÇÃO. CORPORAL, DIRETRIZES E RECOMENDAÇÕES, OBESIDADE, ATIVIDADE FÍSICA. XXVIII.
(29) บทคัดยอ อุบัติการณของภาวะน้ําหนักเกินและโรคอวนในเด็กและวัยรุนกําลังเพิ่มสูงขึ้นอยางรวดเร็วทั่ว โลก และถือเป+นป,ญหาที่สําคัญระดับตนๆของระบบสาธารณสุขไทย ดวยเหตุนี้จึงมีความจําเป+นอยางยิ่ง ที่จะตองดําเนินการเพื่อศึกษาใหเกิดความเขาใจถึงป,จจัยและสาเหตุที่เกี่ยวของระหวางกิจกรรมทางกาย และสุขภาพใหมากขึ้น แตในป,จจุบันการศึกษาและความรูดานนี้กลับยังมีอยูอยางจํากัด อีกทั้งยัง ตองการวิธีการประเมินกิจกรรมทางกายในชีวิตประจําวันที่มีประสิทธิภาพและเที่ยงตรง เครื่องวัดความ เคลื่อนไหวรางกายแบบพกพา (Accelerometers) ถือเป+นเครื่องมือที่ใชวัดคากิจกรรมทางกายที่ไดรับ การตรวจสอบและยอมรับในระดับนานาชาติแลววามีความเที่ยงตรงและเชื่อถือไดสูงสําหรับกลุมเด็กและ วัยรุน การศึกษาภาคตัดขวาง (Cross-sectional study) ในครั้งนี้จึงมีวัตถุประสงคเพื่ออธิบายลักษณะ ของคากิจกรรมกายทางกายในชีวิตประจําวันกับป,จจัยทางกายภาพตางๆ ของวัยรุนไทยที่กําลังศึกษาอยู ในระดับมัธยมศึกษาชั้นปIที่ 1-6 ในภาคตะวันออกเฉียงเหนือ โดยสุมตัวอยางจากวัยรุนไทยที่มีอายุ 1318 ปIมาจํานวน 186 คน แบงเป+นเพศชาย 92 คนและเพศหญิง 94 คน ผูเขารวมศึกษาทุกคนจะตองทํา การติดเครื่องวัดความเคลื่อนไหวรางกายแบบพกพารุนจีทีหนึ่งเอ็ม (GT1M) ตั้งแตตื่นนอนไปจนถึงกอน เขานอนเป+นระยะเวลาติดตอกัน 7 วัน โดยคากิจกรรมทางกายในระดับตางๆ ที่วัดไดจากผูเขารวมศึกษา ทุกคนจะถูกคํานวณออกมาเป+นนาทีตามวิธีการของฟรีดสันและคณะที่สัมพันธกับอายุดวยโปรแกรม เฉพาะทาง ผลการศึกษาครั้งนี้พบวา อุบัติการณของภาวะน้ําหนักเกินและโรคอวนในวัยรุนไทยจากการ ใชเกณฑมาตรฐานสากลเทากับรอยละ 23.1 เพศชายมีกิจกรรมทางกายสูงกวาเพศหญิงอยางมีนัยสําคัญ ในทุกกลุมอายุ (p < 0.01) โดยวัยรุนจะมีระดับกิจกรรมทางกายระดับปานกลางถึงหนัก (MVPA) ในชวง วันธรรมดา (Weekdays) มากกวาวันหยุดสุดสัปดาห (Weekends) ในขณะที่กลุมวัยรุนในเมืองใชเวลา ไปกับกิจกรรมทางกายที่มีการเคลื่อนไหวต่ํา (Sedentary behavior) มากกวากลุมวัยรุนที่อาศัยในเขต ชนบทอยางมีนัยสําคัญทางสถิติ (p < 0.01) และเมื่อไมคํานึงถึงกลุมที่มีภาวะน้ําหนักเกินและโรคอวนจะ พบวา วัยรุนที่อาศัยในเขตเมืองก็ยังคงใชเวลาไปกับกิจกรรมทางกายในระดับปานกลางถึงหนักต่ํากวา วัยรุนในเขตชนบทอยางมีนัยสําคัญทางสถิติ (p < 0.05) อยางไรก็ตามทั้งสองกลุมนี้มีอัตราการผาน เกณฑตามแนวปฏิบัติและขอเสนอแนะการมีกิจกรรมทางกายสําหรับเด็กและวัยรุน (Physical activity guidelines) ไมแตกตางกัน ผลการศึกษาในครั้งนี้ยังพบอีกวา วัยรุนที่เดินทางไปโรงเรียนดวยการเดิน เทาหรือป,iนจักรยานจะมีคากิจกรรมทางกายในระดับปานกลางถึงหนักสูงกวากลุมที่รายงานวาเดินทาง โดยพาหนะตางๆที่ใชเครื่องยนต โดยเฉพาะในวัยรุนหญิงและวัยรุนที่อาศัยในเขตชนบท (p < 0.01) เมื่อ พิจารณาถึงป,จจัยดานสถานภาพทางเศรษฐสังคม (Socioeconomic status) ของครอบครัวพบวา วัยรุนที่อยูในกลุมครอบครัวที่มีรายไดต่ํามีคากิจกรรมทางกายสูงกวาวัยรุนในครอบครัวที่มีรายไดสูง (p < 0.01) โดยเฉพาะในกลุมวัยรุนเพศหญิงพบวา กลุมที่ครอบครัวมีรายไดสูงจะผานเกณฑแนวปฏิบัติและ ขอเสนอแนะการมีกิจกรรมทางกายสําหรับเด็กและวัยรุนนอยกวากลุมที่มาจากครอบครัวที่มีรายไดที่ต่ํา XXIX.
(30) กวาอยางมีนัยสําคัญทางสถิติ (p < 0.01) การศึกษาครั้งนี้จึงชวยเพิ่มองคความรูดานลักษณะของ กิจกรรมทางกายในชีวิตประจําวันกับป,จจัยทางกายภาพตางๆที่เกี่ยวของในวัยรุนไทย และแสดงใหเห็น วาการสนับสนุนใหมีกิจกรรมทางกายที่เพิ่มขึ้นโดยอางอิงกับผลการศึกษาขางตนนั้น ถือเป+นสิ่งสําคัญ เรงดวนที่จะชวยในการสงเสริมเพื่อลดหรือชะลออุบัติการณภาวะน้ําหนักเกินและโรคอวนในวัยรุนไทยได ตอไป แตอยางไรก็ตามการสรางแบบแผนหรือยุทธวิธีเหลานี้ใหตรงจุดและมีประสิทธิภาพนั้น มีความ จําเป+นอยางยิ่งที่ตองพิจารณาป,จจัยจําเพาะระหวางนักเรียน โรงเรียน ครอบครัว และชุมชนควบคูกันไป อยางเป+นบูรณาการณ คําสําคัญ: เครื่องวัดความเคลื่อนไหวรางกายแบบพกพา, วัยรุน, องคประกอบของรางกาย, แนวปฏิบัติ และขอเสนอแนะ, โรคอวน, กิจกรรมทางกาย. XXX.
(31) List of abbreviations. ANOVA. : Analysis of variance. AOR. : Adjusted odds ratio. BF. : Body fat. BIA. : Bioelectrical impedance analysis. BMI. : Body mass index. BMR. : Basal metabolic rate. CDC. : Centers for disease control and prevention. CHD. : Coronary heart disease. CSEP. : The Canadian Society for Exercise Physiology. CVD. : Cardiovascular disease. cm. : Centimeter. cpm. : Counts per minute. CVD. : Cardiovascular diseases. DEXA. : Dual energy x-ray absorptiometry. DLW. : Doubly labeled water. EE. : Energy expenditure. HDL. : High-density lipoprotein. IASO. : The International association for the study of obesity. IOTF. : The international obesity task force. kg/m2. : Kilogram per square meter. LDL. : Low-density lipoprotein. METs. : Metabolic equivalents. MVPA. : Moderate-to-vigorous physical activity. n. : Frequency of sample. NSO. : National statistical office (of Thailand). OR. : Odds ratio. OW/OB. : Overweight/obesity or Overweight and obesity. p. : p-value. PA. : Physical activity. PAEE. : Physical activity energy expenditure. XXXI.
(32) PAG. : Physical activity guidelines (recommendations). PALs. : Physical activity levels. PAP. : Physical activity patterns. PASW. : The Predictive Analytics Software. r. : Reliability or correlation coefficient. RMR. : Resting metabolic rate. SED. : Sedentary behavior. SEE. : Standard error of estimate. SES. : Socioeconomic status. SPSS. : Statistical package for the social sciences. SD. : Standard deviation. TEE. : Total energy expenditure. TFM. : Total fat mass. UK. : The United Kingdom. US. : The United States (of America). VPA. : Vigorous physical activity. WC. : Waist circumference. WHO. : World health organization. %BF. : Percentage of body fat. 2. V. : Chi-square test : Cramer’s V coefficient. XXXII.
(33) CHAPTER I INTRODUCTION AND BACKGROUND.
(34) 2.
(35) CHAPTER I INTRODUCTION AND BACKGROUND. The prevalence of childhood obesity is high and still increasing at an alarming rate throughout the world, in almost all developed countries for which data are available; additionally, evidence suggests that the prevalence of overweight and obesity (OW/OB) has increased to relatively high levels in many developing countries (Wang & Lobstein, 2006; WHO, 1998). A growing number of studies worldwide (Janssen et al., 2005; Wang & Lobstein, 2006) help to shed light on the patterns and time trends of OW/OB in children and adolescents. Currently, our understanding of the global circumstances surrounding obesity in children and adolescents is still limited due to the lack of comparable representative data from different countries, and varying criteria for defining overweight and obesity. This methodological problem of consistency between classifications of childhood obesity is the major obstacle in studying global secular trends for younger age groups (Lobstein, Baur, & Uauy, 2004; Wang & Lobstein, 2006). Almost all researchers in this field agree that prevention of OW/OB in children and adolescents could be the key strategy for controlling the current epidemic of OW/OB, a good understanding of the global situation can provide useful insights on the causes of the current OW/OB epidemic and will assist the planning and development of international collaborations and programs to address this growing public health crisis (Wang & Lobstein, 2006). Insufficient PA and prolonged sedentary behavior (SED) are widely acknowledged as the primary mechanisms underlying the rise in excess body weight, and is associated with a range of poor health outcomes (Dietz, 1996; Jirapinyo, Densupsoontorn, Chinrungrueng, Wongarn, & Thamonsiri, 2005). While regular PA is widely recognized as a mean of preventing the occurrence of many chronic diseases and reduced risk of all-cause mortality (Hallal, Victora, Azevedo, & Wells, 2006). Childhood and adolescence are crucial times for public health, while the decline in PA during adolescence is a key public health concern (Allison, Adlaf, Dwyer, Lysy, & Irving, 2007) and the increasing. 3.
(36) prevalence of OW/OB is also noticeable in this age-period (Telama & Yang, 2000). Furthermore, it has been well documented that the highest risk for childhood obesity that persists into adulthood occurs among overweight adolescents (Dietz, 1996; Dietz & Robinson, 1998). There is a critical need for a better understanding of adolescents’ PA patterns (PAP) and the trends in childhood OW/OB to shape their physical health status, and it can contribute towards improving quality of life for many people of all age groups in later adolescence. In addition, an understanding of how SED and PA relates to health status may provide new avenues for clinical and public health approaches in disease prevention and control. Consequently, PA is now included in most global health promotion recommendations. Attempts to reduce the decline in PA in adolescence have been the focus of many public health interventions in recent years. For example, in Canada, the national approach has shifted from assessing physical fitness in youth to assessing and promoting PA, and aimed at positively influencing knowledge, belief, and attitudes about PA and health lifestyles (Morrow, Jackson, Disch, & Mood, 2000). Prevention of declines in PA in adolescent is also a Scottish public health priority (Group, 2010).. 1. Prevalence and trends in overweight and obesity among children and adolescents. 1.1 Worldwide trends in childhood overweight and obesity The increasing prevalence of OW/OB is clearly visible throughout the world, and an epidemic of OW/OB affected children and adolescents across the developed and developing countries (Bertoncello, Cazzaro, Ferraresso, Mazzer, & Moretti, 2008; Bundred, Kitchiner, & Buchan, 2001; de Onis & Blossner, 2000; Martorell, Kettel Khan, Hughes, & Grummer-Strawn, 2000; Ogden et al., 2006; Ramachandran et al., 2002). However, it should be noted that direct comparison of those prevalence rates with reports from country to country and from age to age, should be made with caution as each report had used different. 4.
(37) criteria for classifying OW/OB (Tee, 2002). Nevertheless, the lack of data for certain age groups such as adolescents need to be addressed. In most of the currently available data, the prevalence of childhood OW/OB in developed countries is higher than that in developing countries, but the vast majority of affected children live in developing countries (de Onis, Blossner, & Borghi, 2010). Additionally, the relative increase in the last two decades has been higher in developing countries (+65%) than in developed countries (+48%).. Asia has the highest number of overweight and obese. children, because more than half (18 million in 2010) of the affected children from developing countries live in this region (de Onis, et al., 2010). Recently, a total of 450 nationally representative cross-sectional surveys from 144 countries showed that, in 2010, 43 million children (81.4% or 35 million in developing countries) were estimated to be overweight and obese whereas 92 million are estimated to be at risk of overweight (de Onis, et al., 2010). Meanwhile, another study published in the same year reported by The International Association for the Study of Obesity/The International Obesity Task Force (IASO/IOTF) estimated that approximately 1 billion adults are currently overweight [Body mass index (BMI) = 25-29.9 kg/m²]), and a further 475 million are obese (BMI > 30 kg/m2). When Asian-specific cut-off points for the definition of obesity (BMI > 28 kg/m2) are taken into account, the number of adults considered obese globally is over 600 million (IOTF, 2010). World Health Organization (WHO) further projects that by 2015, approximately 2.3 billion adults will be overweight and more than 700 million will be obese. Globally, IASO/IOTF also estimate that up to 200 million school aged children are either overweight or obese, of those 40-50 million are classified as obese (IOTF, 2010). These findings confirm the need for effective interventions and programs to reverse anticipated trends starting from childhood.. 5.
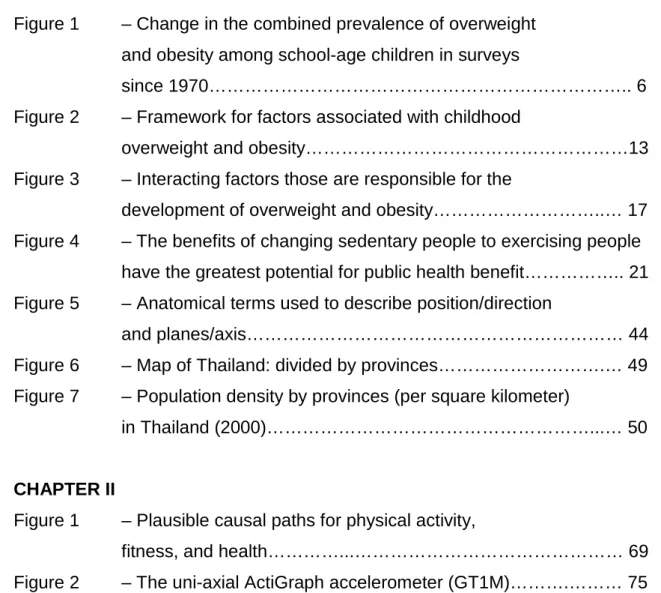
(38) Figure 1. Change in the combined prevalence of overweight and obesity among schoolage children in surveys since 1970. The chart shows country, method of measurement, and period of assessment for prevalence change. Methods of IOTF cut-point for overweight and th. th. obesity: 85 and 90 = percentiles for local or WHO Body Mass Index reference charts, 110% = percent of ideal body weight (locally defined). *Self-reported data. [Adapted from Wang, Y., & Lobstein, T. (2006). Worldwide trends in childhood overweight and obesity. Int J Pediatr Obes, 1(1), 11-25.) (Wang & Lobstein, 2006)]. 1.2 The prevalence of childhood overweight and obesity in Asia The sustained economic growth, the increasing political stability, the improving health facilities, as well as the transition from a rural to an urban lifestyle (e.g., increased consumption of high energy dense foods and decrease in PA) is associated with increased levels of obesity in many Asian populations. However, countries and regions in Asia are at different phases of development. Some like Vietnam and Indonesia are in the early stages of development whereas others like Japan, Singapore, Malaysia, and Hong Kong are at more. 6.
(39) advanced stages. Nevertheless, childhood OW/OB has also reached epidemic proportions and is major public health problems in many Asian countries. Similar trends can also be seen in Thailand. In 1995, an estimated 17.6 million children were overweight in the developing countries. Of this total, 61% or 10.6 million were in Asia (de Onis & Blossner, 2000; Tee, 2002). Interestingly, the highest rate of OW/OB in Asia is in Thailand (overweight 28.3% and obesity 6.8%) (Aekplakorn et al., 2004; Ramachandran & Snehalatha, 2010). A 1997 national survey of children under 5 years of age in Brunei Darussalam showed a high prevalence of overweight ranging from 7.7% to 10.2% in different parts of the country, and averaging 9.1% for the whole country. In Kuala Lumpur, Malaysia, the prevalence of overweight in primary school children was observed to be 8.4% (Tee, 2002), boys were almost 1.4 times more likely to be overweight than girls. In a nationally representative cross-sectional data from the 2002 China National Nutrition and Health Survey, OW/OB percentage of Chinese children aged 7-17 years was 4.5 and 2.2, respectively (Y. Li et al., 2007). For the same period (2002), a study conducted among urban Indian adolescents aged 13-18 years have also demonstrated that the prevalence of overweight was 17.8% for boys and 15.8% for girls, while obesity was reported in 3.6% boys and 2.7% girls (Ramachandran, et al., 2002). A more recent study (2010) in India also revealed that, school children of 12-18 years of age, from different areas, found a prevalence of overweight of 14.3% among boys and 9.3% among girls, with an obesity prevalence of 1.5%-2.9% (Goyal et al., 2010). A six-year longitudinal study in Japanese primary school children, conducted between 2001 and 2007, showed that the prevalence of overweight in boys has changed over the 6 years: from 15%-18.3% in 2001 to 16.5%-21.7% in 2007, and obesity prevalence has also increased, from 4.9%5.9% in 2001 to 3.6%-5.4% in 2007. During the same period, in girls, there has changed from 15.2%-17.1% to 14.7%-15.5% for overweight, and 4.0%-4.1% to 2.0%-2.1% for obesity (Nakano et al., 2010).. 1.3 Prevalence and determinants of childhood overweight and obesity in Thailand. 7.
(40) There is no doubt that the prevalence of childhood OW/OB is also rapidly increasing at an alarming rates in Thailand – directly parallels that which is occurring in the West or other developed countries. Furthermore, the impact of engulfment of western culture due to globalization has resulted in attenuation of Thai traditional practices and behaviors, like eating (Mo-suwan & Geater, 1996), and the living standard in Thailand has been much improved. A previous study performed by Mo-suwan and colleague reported that the prevalence of obesity (weight-for-height > 120% of the Bangkok reference) in 6- to 12-year-old children rose from 12.2% in 1991 to 13.5% in 1992 and 15.6% in 1993 (Mosuwan & Geater, 1996). In the 4th National Nutrition Survey 1995 of Thailand, the prevalence of overweight among children 0-5 years of age was reported to be 17.6%, whereas 5.4% of the children were reported to be obese (Department of Health, 1995). The study conducted in 1997 in Saraburi Province where is located in the Central Region of Thailand, which is approximately 100 km northeast of Bangkok. Three districts were randomly selected from the 13 districts in the province for representatives of children in rural areas, and the Saraburi municipality was chosen for representatives of children in urban areas, the prevalence of childhood obesity over 97th percentile for weight-for-height (>p97) was 22.7% in urban and 7.4% in rural areas whereas the prevalence of overweight (p90-97) was 16.1% in urban group, and 8.7% in rural group (Sakamoto, Wansorn, Tontisirin, & Marui, 2001). A 6-year longitudinal study published in 2005 found that, during adolescence (grades 712), the rates of OW/OB increased with age. The prevalence of overweight in boys and girls at grade 7 were 13.6% and 9.9%, and at grade 12 were 14% and 10.5%, respectively. In addition, the prevalence of obesity in boys and girls at grade 7 were 26.8% and 13.5%, and at grade 12 were 15% and 10.8%, respectively (Jirapinyo, Densupsoontorn, Chinrungrueng, et al., 2005). A 6-year retrospective study of body weights of primary-school children from grade 1 to grade 6 in three cities with different urbanization levels showed that the prevalence of obesity increased at quite dramatic rates during the primary school period: the prevalence of obesity in children in grade 1 from schools in Bangkok, Saraburi (100-km northeast from Bangkok) and Sakolnakorn (600-km. 8.
(41) northeast. from Bangkok) was 16%, 23% and 4% respectively, and this. increased to 31%, 30% and 9%, respectively, by 6th grade (Jirapinyo, Densupsoontorn, Kongtragoolpitak, Wong-Arn, & Thamonsiri, 2005). In 2008, prevalence of obesity among students grade 7-12 in Nakhon Pathom province (56-km northwest from Bangkok), a rural-urban area, was 8.7%, and this prevalence was higher in boys (10.89%) than in girls (6.98%). Additionally, father’s occupation and family income had a significant association with obesity status in children (Nguyen, Kamsrichan, & Chompikul, 2008). Although comparison is difficult because those surveys use a variety of definitions of OW/OB and employ a range of different measures, all the studies mentioned above show that the prevalence of childhood obesity in Thailand has increased dramatically over the last decade. Therefore, if those trends of OW/OB are allowed to go on as mentioned above, the prevalence of obesity in the Thai population in the near future will be much higher than the current figure, and the magnitude of the public health problem caused by obesity in the next. decade. will. also. be. much. higher. (Jirapinyo,. Densupsoontorn,. Kongtragoolpitak, et al., 2005). In addition, the international age- and genderspecific cut-off points should be used in future research in order to eliminate inconsistencies in choice of measurements, cut-points, and also to facilitate international comparisons.. 2. Potential determinants of childhood obesity and overweight prevalence trends. A number of factors have been linked to OW/OB, including age, gender socioeconomic status, racial/ethnic groups, and geographic location.. 2.1 Differences in prevalence associated with age and gender Although OW/OB seems to be growing in children and adolescents regardless of gender, previous studies suggested that the prevalence of OW/OB are different between genders. Reilly has suggested that gender differences in prevalence are also possible for any population and may emerge. 9.
(42) in future, though not present now, so prevalence estimates should always consider the genders separately, at least initially (Reilly, 2005), and age-related differences in the prevalence should also be considered. In one study, the secular trends in obesity in the United States (US) suggest that gender differences may become more marked over time, as increases in prevalence during the period 1986-1998 were much greater in boys than in girls (Strauss & Pollack, 2001) whereas in the United Kingdom (UK), the apparent gender difference is an artifact of the IOTF definition, which has much lower sensitivity in boys than girls (Reilly, Dorosty, & Emmett, 2000). A six-year longitudinal study published in 2010 on the prevalence of OW/OB in Japanese children, showed that boys (15-23% for overweight, and 4-7% for obesity) are fatter than girls (15-18% for overweight, and 2-4% for obesity), while up to 70% of OW/OB Japanese primary school children track into junior high school OW/OB adolescents. The tracking of OW/OB status is higher among boys than girls (Nakano, et al., 2010). In India, the prevalence of overweight in urban adolescents aged 13-18 years was 17.8% for boys and 15.8% for girls; obesity was seen in 3.6% of boys and 2.9% of girls, additionally its prevalence was found to be significantly associated with age (Ramachandran, et al., 2002). In developed countries such as the UK, the prevalence of childhood obesity also increased with age; moreover, an association between socioeconomic deprivation and childhood obesity was strong, especially in girls (Kinra, Nelder, & Lewendon, 2000).. 2.2 Differences in prevalence associated with socioeconomic status The pandemic of obesity has been restricted to developed and highincome countries until few decades ago, but recently, it has penetrated even the developing. and. poor. countries.. Asia. has. undergone. considerable. socioeconomic transition in the past few decades which has resulted in increased availability of food, better transport facilities, and better health care facilities. In general, the prevalence of OW/OB is associated with higher socioeconomic status (SES) in both children and adults (Powell, Hoffman, & Shahabi, 2001; Ramachandran & Snehalatha, 2010; Wardle & Griffith, 2001).. 10.
(43) In developing nations child obesity is most prevalent in wealthier sections of the population (Danielzik, Czerwinski-Mast, Langnase, Dilba, & Muller, 2004; Lobstein, et al., 2004). On the other hand, the major causative factors are related to the lifestyle changes occurring due to rapid socioeconomic transition, increasing economic development tends to be associated with increases in prevalence of childhood obesity in developing countries (Martorell, et al., 2000). Adolescents from socially advantaged backgrounds also tend to be heavier than those from disadvantaged backgrounds (Nunez-Rivas, Monge-Rojas, Leon, & Rosello, 2003; Wang, 2001). In China, the OW/OB prevalence increased with the family’s income level and the mother’s educational level (Y. Li, et al., 2007). However, the reasons for the differences in prevalence of childhood obesity among groups are complex and not entirely clear, likely involving country, age, gender, culture, ethnicity, environment, and interactions among these variables and SES on childhood obesity not fully recognized. Importantly, understanding the influence of those variables on the patterns of PA that lead to OW/OB will be critical to developing public policies and effective clinical interventions to prevent and treat childhood obesity. Thus, the magnitude of SES differences in obesity risk is worth considering.. 2.3 Differences in prevalence associated with racial or ethnicity Although racial or ethnic differences in obesity risk may be explained in part by socioeconomic factors in developed counties (i.e., the US), racial/ethnic differences in obesity risk are not merely the result of differences in income and education,. whereas. in. developed. countries. with. smaller. and. more. geographically diffuse populations of ethnic minorities than the US, the extent of ethnic differences in the prevalence of obesity is less clear (Reilly, 2005; Reilly, Wilson, Summerbell, & Wilson, 2002), there appears to be a cultural component to lifestyle which is responsible for the high obesity risk in some minority groups (Gordon-Larsen, Adair, & Popkin, 2003). Asian populations show several differences in genetic factors when compared with the Western population. Thus, future research should continue to explore racial/ethnic differences in. 11.
(44) OW/OB prevalence in an effort to identify policies and interventions that are more effective in Asian population.. 2.4 Differences in prevalence associated with geographical areas Rural and urban residents are known for having different lifestyles (Arambepola, Allender, Ekanayake, & Fernando, 2008). Rural communities are culturally more homogeneous than urban communities, and they have less exposure to different lifestyles. Generally, lifestyle and diet were the most important risk factors to explain the differences between urban and rural residents; these lifestyles create their own patterns of food demand and time allocation. The consequences for diets, PA, and health have been enormous (Gao et al., 2011). Additionally, people’s lifestyles have changed rapidly over the last decade and were found to be a contributory factor for the rising rates of obesity (Ramachandran et al., 2004); in other words, a urban-rural setting is associated with increases in OW/OB (Davison & Lawson, 2006). Most western countries show a greater regional distribution of obesity in rural areas (Borders, Rohrer, & Cardarelli, 2006; Jackson, Doescher, Jerant, & Hart, 2005; Peytremann-Bridevaux, Faeh, & Santos-Eggimann, 2007). In Costa Rica, one of Central America’s countries, 7-12-year-old children from urban areas had a higher prevalence of overweight than those living in rural areas (36.7% vs. 30.0%, respectively), whereas the obesity prevalence was 28.4% in urban and 21.5% in rural areas (Nunez-Rivas, et al., 2003). But a study using the adult samples of 10 European countries found no differences in the prevalence of OW/OB between rural and urban areas (Peytremann-Bridevaux, et al., 2007). While one study in Southern European country, such as Italy shows that school-aged children residents in rural areas have a higher risk of OW/OB compared with children residents in urban areas (Bertoncello, et al., 2008). However, in developing countries, there is a clear difference with respect to the geographical areas. A higher prevalence of OW/OB occurring in urban areas as compared to rural areas, because urbanization is associated with a variety of lifestyles and behavioral changes, including physical inactivity and. 12.
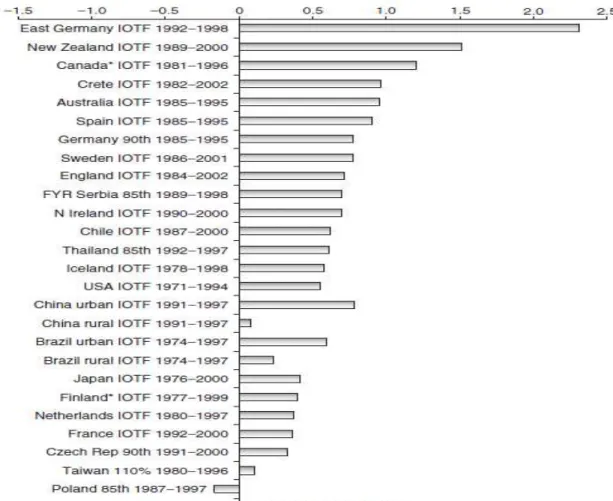
(45) high-fat, energy-rich diets, which influence body weight (Gao, et al., 2011). In Malaysia, the OW/OB prevalence in primary school children was about 4 times higher in urban areas than in rural areas (Tee, 2002). One study in India also highlighted. a. high. prevalence. of. overweight. in. urban. adolescents. (Ramachandran, et al., 2002). A more recent study (Gao, et al., 2011) conducted in Chinese adult sample confirmed that urban residents have a much higher prevalence of OW/OB than that in rural counterparts. The prevalence of OW/OB in urban residents was 3 times as much as that in rural residents (42.6% vs. 14.1%). However, it is important to note that most previous studies on the influence of a rural/urban setting on OW/OB prevalence in children and adolescents were not sufficiently controlled for race, gender, age, grade level, school location, and perhaps, may not have included a representative sample of rural and urban children/adolescents. Consequently, our understanding of how OW/OB rates vary depending on the level of urbanization may help health professionals to either tailor programs to the needs of the individuals living in these different areas or to target existing programs to the contexts where they are most likely to have an impact.. Figure 2. Framework for factors associated with childhood overweight and obesity (Adapted from Davison, K. K., & Birch, L. L. (2001). Childhood overweight: a contextual model and recommendations for future research. Obes Rev, 2(3), 159-171.) (Davison & Birch, 2001). 13.
(46) 3. Standard definition of child overweight and obesity worldwide. For medical purposes, overweight or obesity refers to excess body fat (BF); however, it is difficult to measure BF percentage (%BF) without special equipment, and is impracticable for epidemiological use. Generally, for clinical practice and epidemiologic studies, child OW/OB are assessed by means of indicators based on weight and height measurements, such as weight-for-height measures or BMI [weight/height2 (kg/m2)]. BMI does not measure BF directly but it is strongly correlated with %BF (Mei et al., 2002; Pandit, Chiplonkar, Khadilkar, Khadilkar, & Ekbote, 2009; R. W. Taylor, Jones, Williams, & Goulding, 2002); additionally, BMI is an inexpensive and easy-to-perform method of screening for weight categories that may lead to health problems, and therefore has become the standard indicator to describe the degree of excess weight, and it is a reasonable indicator of body fatness for most children and adolescents. Different international and national reference systems based on BMI have been proposed to define OW/OB in childhood, and the dispersion in systems mentioned before, turns it difficult to establish comparisons between different methods. An international reference will be useful for making appropriate comparisons across studies and monitoring the global epidemic of OW/OB. To meet such demands, the Childhood Obesity Working Group of the IOTF proposed the international age- and gender-specific BMI cut-off points to define OW/OB for 2- to 18-year-old children (see Table 1). In this definition, used data from 6 national studies conducted in different countries (Brazil, Great Britain, Hong Kong, the Netherlands, Singapore, and the US) and provided centile curves that linked to the widely accepted cut-off points of a BMI of 25 kg/m2 and 30 kg/m2 for adult OW/OB (Cole, Bellizzi, Flegal, & Dietz, 2000). This BMI definition provides a useful practical reference for surveys aimed at estimating the prevalence of OW/OB among adolescents (Al-Sendi, Shetty, & Musaiger, 2003; Y. Li, et al., 2007).. 14.
(47) Table 1. International body mass index cut-offs for overweight and obesity by sex between 2 and 18 years old, defined to pass though body mass index 25 and 30 kg/m2 at age 18 years old. (Adapted from Cole, T. J., Bellizzi, M. C., Flegal, K. M., & Dietz, W. H. (2000). Establishing a standard definition for child overweight and obesity worldwide: international survey. BMJ, 320(7244), 1240-1243.) (Cole, et al., 2000). Age. Body Mass Index 25 kg/m. 2. Body Mass Index 30 kg/m. (years). Boys. Girls. Boys. Girls. 2. 18.4. 18.0. 20.1. 19.8. 2.5. 18.1. 17.8. 19.8. 19.5. 3. 17.9. 17.6. 19.6. 19.4. 3.5. 17.7. 17.4. 19.4. 19.2. 4. 17.6. 17.3. 19.3. 19.1. 4.5. 17.5. 17.2. 19.3. 19.1. 5. 17.4. 17.1. 19.3. 19.2. 5.5. 17.5. 17.2. 19.5. 19.3. 6. 17.6. 17.3. 19.8. 19.7. 6.5. 17.7. 17.5. 20.2. 20.1. 7. 17.9. 17.8. 20.6. 20.5. 7.5. 18.2. 18.0. 21.1. 21.0. 8. 18.4. 18.3. 21.6. 21.6. 8.5. 18.8. 18.7. 22.2. 22.2. 9. 19.1. 19.1. 22.8. 22.8. 9.5. 19.5. 19.5. 23.4. 23.5. 10. 19.8. 19.9. 24.0. 24.1. 10.5. 20.2. 20.3. 24.6. 24.8. 11. 20.6. 20.7. 25.1. 25.4. 11.5. 20.9. 21.2. 25.6. 26.1. 12. 21.2. 21.7. 26.0. 26.7. 12.5. 21.6. 21.1. 26.4. 27.2. 13. 21.9. 22.6. 26.8. 27.8. 13.5. 22.3. 23.0. 27.2. 28.2. 14. 22.6. 23.3. 27.6. 28.6. 14.5. 23.0. 23.7. 28.0. 28.9. 15. 23.3. 23.9. 28.3. 29.1. 16. 23.9. 24.4. 28.9. 29.4. 15. 2.
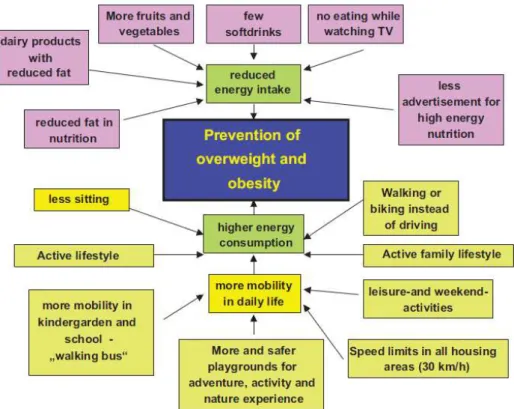
(48) Table 1 (continued). International body mass index cut-offs for overweight and obesity by sex between 2 and 18 years old, defined to pass though body mass index 25 and 30 kg/m2 at age 18 years old. Age. Body Mass Index 25 kg/m. 2. Body Mass Index 30 kg/m. (years). Boys. Girls. Boys. Girls. 16.5. 24.2. 24.5. 29.1. 29.6. 17. 24.5. 24.7. 29.4. 29.7. 17.5. 24.7. 24.8. 29.7. 29.8. 25. 25. 30. 30. 18. 2. 4. Prevention of overweight and obesity. OW/OB are associated with significant health problems in the pediatric age group and is an important early risk factor for much of adult morbidity and mortality (Dietz, 1996; Ippisch & Daniels, 2008; Reilly, 2005; Rowell, Evans, Quarry-Horn, & Kerrigan, 2002; Williams et al., 2002). In order to prevent childhood obesity and its health consequences, population-based strategies improve social and physical environmental contexts for healthful eating and PA are essential (Kumanyika et al., 2008) (see Figure 3).. Population-based. approaches to OW/OB prevention are complementary to clinical preventive strategies and also to treatment programs for those who are already overweight or obese. Engaging in regular PA is widely accepted as an effective preventative measure, therefore, over the last decade, several experts have developed and provided the health-benefit PA guidelines (PAG) for children and adolescents (Cavill, Biddle, & Sallis, 2001; Martinez-Gomez et al., 2010; Strong et al., 2005; Tremblay, Warburton, et al., 2011). They suggest that the guideline of 60 minutes of moderate-to-vigorous PA (MVPA) per day is associated with further health benefits. In contrast, SED such as watching television, playing on the computer and with video games have been associated with potentially adverse health conditions such as child OW/OB (Gortmaker et al., 1996), reducing sedentary time can also help prevent childhood obesity (Robinson, 1999). Therefore, a. 16.
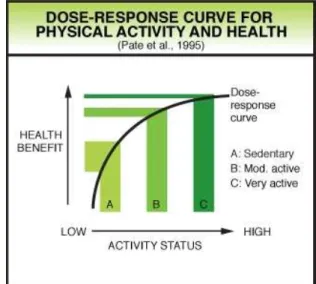
(49) major challenge in public health is to develop efficacious and effective health promotion strategies targeting children and adolescents in the population to alleviate the potential future burden of preventable lifestyle diseases; in other words, interventions aimed at increase PA and reduce SED among children and adolescents should be considered.. Figure 3. Interacting factors those are responsible for the development of overweight and obesity (Adapted from Lob-Corzilius, T. (2007). Overweight and obesity in childhood--a special challenge for public health. Int J Hyg Environ Health, 210(5), 585-589.) (Lob-Corzilius, 2007). 5. Definition, dimension, and classification of physical activity. 5.1 Definition of physical activity PA is defined as “any bodily movement produced by skeletal muscles that requires energy expenditure”; it includes occupational work, chores, leisure activity, playing sports, and exercise that is planned for fitness or health purposes (Caspersen, Powell, & Christenson, 1985). A daily life PA is “a behavior that involves all large muscle movements for various purposes and. 17.
Imagem

+7


Documentos relacionados
A complexidade da situação de João Crisóstomo em seus últimos anos, do episcopado ao exílio, para além das narrativas de Paládio, Sócrates e Sozomeno, nos leva a
Ao longo do estudo, percebemos que muitos alunos entendem que os morcegos são importantes para o ambiente, mas quando questionados se esses animais habitam a cidade e se a presença
O modelo de negócio de Osterwalder (2004) poderá ser uma mais-valia na aplicação do modelo de avaliação da qualidade das respostas sociais, (antes que a instituição seja alvo
A ideia do dossiê parte da articulação entre os conceitos de territórios e fronteiras e das diversas interfaces que a área de ensino de história tem
Los diferentes resultados que se presentan a continuación, muestran rasgos que demarcan las características en lo que respecta a aspectos vinculados a la investigación, referente a
considerados como os estabelecidos, nesta problemática, são os de descendência germânica, chegados do sul do Brasil e proprietários de terras, enquanto os
A partir daí muitos conceitos surgiram na literatura, tais como: conjunto de intangíveis que criam valor organizacional mediante uma prática coletiva (MARR, 2005);
Para Leff (2002, p.59), “a problemática ambiental também está aliada ao efeito de acumulação de capital e da maximização da taxa de lucro a curto prazo, que induzem
