Introduction
Muscle strength is a component of physical itness, and different health conditions can be identiied by speciic musculoskeletal itness tests, such as the lumbar force test1,2,3. In addition to the importance of adequate levels of lumbar force for sports performance, lumbar force measurement is relevant in the clinical context, as it assists in the identiication of risk factors and of bone, muscle and joint complications in the lumbar region4. Low levels of lumbar force in adolescents are directly associated with lower back pain, postural deviations, back pain and functional incapacity for the performance of activities of daily living5-8.
Adolescence is marked by rapid changes in body composition and physical growth due to biological maturation9,10. As a result of these transformations, boys are more likely to increase muscle mass, while girls tend to increase body fat10. The relationship between body fat and muscle strength has already been veriied in literature2, in which excess body fat was directly associated with lower strength levels. The justiication for this interrelationship would be the reduction of growth rate and muscle development as a result of the interaction of adipose tissue with sex hormones (testosterone and estrogen)10, resulting in decreased muscle mass and strength6,8.
In addition to the relationship between strength levels and biological variables, it has been well established in literature that the practice of physical activity and sedentary behavior inluences on muscle strength11,12. Physical inactivity leads to
less demand for stimuli to the skeletal muscles, which implies less development of muscle mass and strength2,13. The increase in the time spent in sedentary behaviors is another aspect that can directly contribute to body fat accumulation due to the reduction of energy expenditure 2, and loss of tone and muscular volume, resulting in the reduction of strength levels2,14.
Several studies have investigated the relationship of muscular strength in adolescents according to sexual maturation; however, much of the content described in literature refers to strength performance in the upper limbs15-17 and abdomen15. In addition, information regarding lumbar force in adolescents is scarce8, although greater knowledge regarding lumbar force could help in the early diagnosis of health problems related to lower levels of lumbar force, such as musculoskeletal pain and postural deviations8.
Thus, the aim of this study was to compare the performance of the lumbar force test between pubertal and post-pubertal adolescents by controlling the interference of physical growth, body fat, screen time and physical activity.
Material and Methods
This school-based epidemiological survey is part of the macroproject “Brazilian Guide of Assessment of Physical Fitness Related to Health and Life Habits - Stage I”. A cross-sectional study was carried out in the city of São José, Santa Catarina, Brazil. The municipality has a Human Development Index (HDI) of 0.809, with a life expectancy at birth of 77.81
Original Article (short paper)
Comparison of lumbar force between pubertal
and post-pubertal adolescents: interference of
physical growth, body fat and lifestyle.
Mikael Seabra Moraes1, Tiago Rodrigues de Lima1, Diego Augusto Santos Silva*1
1Universidade Federal de Santa Catarina, UFSC, Florianópolis, SC, Brazil
Abstract — Aim: To compare performance in the lumbar force test in pubertal and post-pubertal adolescents by controlling the interference of physical growth, body fat, screen time and physical activity. Methods: A cross-sectional study with 933 adolescents (492 girls) aged 14-19 from the city of São José, Brazil. Lumbar strength was assessed using the isometric lumbar extension test proposed by the Canadian Society of Exercise Physiology. Sexual maturation was classiied according to Tanner’s criteria. Physical growth variables (age, body weight, stature, BMI), body fat (triceps and subscapular skinfolds), sedentary behavior based on screen time and overall physical activity were controlled in the Analysis of Covariance (ANCOVA), with a signiicance level of 5%. Results: Post-pubertal boys presented higher lumbar force compared to pubertal ones only when interference of BMI, body fat, screen time and physical activity was controlled. Pubertal girls presented higher lumbar force compared to post-pubertal ones, both when controlling the analysis for the studied variables and when not controlled by them. Conclusion: BMI, body fat, screen time and physical activity interfere in the difference in lumbar strength of boys, in which post-pubertal boys presented better performance in lumbar force compared to pubertal ones. Regardless of interference or not of these variables, pubertal girls presented better performance in lumbar force when compared to post-pubertal ones.
years, a per capita income of R$ 1.157,43 and a GINI index of 0.4418.
The study population was comprised of 5,182 high school adolescents aged 14-19 from state public schools in the municipality of São José, Santa Catarina, Brazil, distributed in 11 eligible schools and 170 high school classes.
The sampling process was determined in two stages: 1) stratiied by public high schools (n = 11); 2) groupings of classes considering the study period and grade (n = 170 classes). In stage two, all high school students who were present in the classroom on the days of data collection were invited to participate in the study. The probabilistic sample consisted of 1,132 students. Details on estimates for the sample size calculation and the entire sampling process (inclusion, exclusion and eligibility criteria) can be found in literature19.
The study was approved by the Ethics Research Committee of the Federal University of Santa Catarina under Protocol 746.536 / 2014 and was developed from August to November 2014. Only adolescents who returned the informed consent form signed by parents (<18 years) or by themselves (≥18 years), together with the Consent Term signed by adolescents themselves, participated in the study.
The assessment team was previously trained and everyone was familiar with tests and instruments. Data collection took place in two stages. Firstly, adolescents answered the survey questionnaire in the classroom. Then, they were directed to the school gym or adequate place for body composition evaluation and physical itness tests.
The dependent variable was lumbar force. The method used to assess lumbar strength levels was the isometric test proposed by the Canadian Society of Exercise Physiology3. The trunk extension and support test, dorsal isometry, was performed on a bench in which the participant remained in ventral decubitus position, with only the legs and hips resting on a bench, and with the legs supported by a rope prepared with padding in the posterior regions of the thighs and legs. At the signal of the evaluator, the participant lifted the trunk to the horizontal, remaining as long as possible in that position. The test was stopped when the subject was no longer able to remain in that position or held it for up to three minutes (180 seconds). For analyses, the values obtained in the lumbar force test were treated in a continuous manner.
Sexual maturation was evaluated according to the criteria proposed by Tanner20, validated and reproduced for the Brazilian population21. Sexual maturation stages were indicated by self-evaluation (igures) of breast development (females) and genital development (males). Students were individually oriented by same-sex evaluators. There was a low frequency of adolescents in the pre-pubertal stage (2%), therefore they were excluded from the analysis. Thus, from this variable, adolescents were classiied as “pubertal” and “post-pubertal”.
Anthropometric measurements (body mass, height, and triceps and subscapular skinfolds) were collected according to standardizations proposed by Marfell-Jones22. Anthropometric measures were taken by single evaluator with level-1 international certiication from the International Society for the Advancement of Kinanthropometry. Height was collected using Sanny® stadiometer with tripod (São Paulo, Brazil) and G-Tech® digital scale for body mass (Zhongshan, China). BMI was also
calculated. Triceps and subscapular Skinfolds (SF) were collected with Cescorf ® adipometer (Porto Alegre, Brazil). The sum of SF (triceps and subscapular) was used as study variable. For analyses, these variables were used continuously.
Socio-demographic variables and factors related to sedentary behavior and physical activity were collected through a self-administered questionnaire. Sociodemographic variables included in the study were sex (male and female) and age (full years). Sedentary behavior was analyzed through the identiication of the period spent in front of a screen using a questionnaire with six different questions, which veriied the amount of hours spent in front of a television (TV), computer (PC) and videogame (VG) during the week and also on weekends. Screen time was calculated by summing the hours spent in front of a screen on weekdays (multiplying the hours and minutes by ive) and weekends (multiplying hours and minutes by two), resulting in total screen time23.
The global physical activity variable was evaluated by the Brazilian version of the Youth Risk Behavior Surveillance (YRBSS) questionnaire, used in the United States, translated and validated for Brazil24. This questionnaire presented a moderately high kappa concordance index, with a mean of 68.3% and a median of 68.5%. The question used to assess overall physical activity was “During the past seven days, on how many days were you physically active for at least 60 minutes a day? (Consider moderate and / or vigorous physical activity)”. Options varied from one to seven days a week. From the option chosen, the number of days in the week in which the adolescent responded was multiplied by 60 minutes, which allowed calculating the amount of minutes per week that the adolescent performed physical activity25.
Statistical analysis
For data analysis, normality was initially tested by means of graphs, kurtosis and skewness values, with data showing normal distribution. Descriptive statistics was used with mean values and standard error. To compare the sample according to sex, the t-test was used for independent samples. In addition, the effect size was calculated according to literature, in which values below 0.2, 0.5 and 0.8 are respectively classiied as low, medium and high26. The Pearson correlation coeficient was calculated to determine the relationship among study variables.
The interaction between independent variables (age, body mass, height, BMI, triceps and subscapular SF and sum of triceps and subscapular SF, screen time and total physical activity) was tested. As there was no interaction among variables, the analysis of covariance (ANCOVA) was used. Comparison models between groups (pubertal and post-pubertal) were constructed: Model 1, considered a crude model, veriied the difference between groups without covariates; Model 2 had age as a covariate; Model 3 had age, body mass and stature as covariates; Model 4 included age, body mass, stature, BMI, triceps and subscapular SF and sum of SF (triceps and subscapular); Model 5 included all variables of the previous model plus total physical activity and screen time.
Professionals, Texas), version 13.0 was used for data analysis. The Statistical Package for the Social Sciences (SPSS) version 22.0 was used to calculate the effect size.
Results
Of the 1,132 students investigated, 199 did not have
information about the variables used in the present study or had not reached the stage of pubertal maturation, resulting in 933 adolescents included in analyses. Boys presented higher values than girls for variables age, body mass, height, period in sedentary behavior based on screen time, minutes of physical activity per week and performance in the lumbar force test (p <0.01). Girls presented higher values for triceps SF, subscapular SF and sum of SF compared to boys (Table 1).
Table 1. Descriptive statistics of the sample according to sex.
Variables Total Male Female
M (SE) M (SE) M (SE) p Cohen’D
Age (years) 16.1(0.3) 16.2 (0.5) 16.0 (0.4) <0.01* 0.17
Total body weight (kg) 61.9 (0.4) 65.7 (0.5) 58.5 (0.5) <0.01* 0.59
Height (cm) 166.4 (0.3) 172.7 (0.3) 161.3 (0.3) <0.01* 1.70
BMI (kg/m²) 22.2 (0.1) 21.9 (0.1) 22.4 (0.2) 0.31 0.14
Triceps SF (mm) 14.9 (0.2) 10.7 (0.2) 18.7 (0.3) <0.01* 1.30
Subscapular SF (mm) 13.3 (0.2) 10.7 (0.2) 15.5 (0.3) <0.01* 0.77
∑ triceps and subscapular SF (mm) 28.2 (0.4) 21.5 (0.5) 34.2 (0.6) <0.01* 1.08
Screen time (h/day) 6.5 (0.1) 7.1 (0.2) 5.95 (0.2) <0.01* 0.24
Physical activity (min/week) 155.7 (3.9) 177.5 (6.0) 137.4 (5.0) <0.01* 0.31
Lumbar strength (sec) 124.6 (1.7) 133.0 (2.3) 117.2 (2.4) <0.01* 0.31
M - mean; SE - Standard error; Kg - kilograms; Cm - centimeters; BMI - Body Mass Index; m² - squared meters; SF - Skin Folds; Mm - millimeters; Σ - Sum; h/ day - hours per day; min / week - minutes per week; Seconds; P value <0.05. Student’s t test for independent samples.
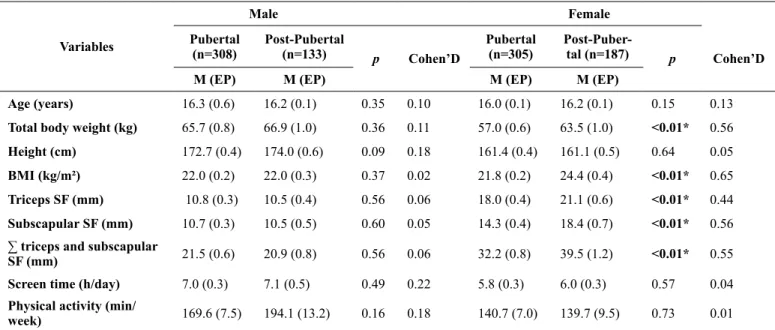
Post-pubertal girls presented higher values for body mass, BMI, triceps SF, subscapular SF, and sum of SF as compared to pubertal ones (p <0.01). In girls, there was no difference when comparing the other variables in relation to stages of
sexual maturation. In boys, no differences were found between variables and stages of sexual maturation (Table 2). Table 3 presents the correlation values of variables investigated for boys and girls.
Table 2. Distribution of variables investigated by sex according to stages of maturational development of adolescents.
Variables
Male Female
Pubertal (n=308)
Post-Pubertal
(n=133) p Cohen’D
Pubertal (n=305)
Post-Puber-tal (n=187) p Cohen’D
M (EP) M (EP) M (EP) M (EP)
Age (years) 16.3 (0.6) 16.2 (0.1) 0.35 0.10 16.0 (0.1) 16.2 (0.1) 0.15 0.13
Total body weight (kg) 65.7 (0.8) 66.9 (1.0) 0.36 0.11 57.0 (0.6) 63.5 (1.0) <0.01* 0.56
Height (cm) 172.7 (0.4) 174.0 (0.6) 0.09 0.18 161.4 (0.4) 161.1 (0.5) 0.64 0.05
BMI (kg/m²) 22.0 (0.2) 22.0 (0.3) 0.37 0.02 21.8 (0.2) 24.4 (0.4) <0.01* 0.65
Triceps SF (mm) 10.8 (0.3) 10.5 (0.4) 0.56 0.06 18.0 (0.4) 21.1 (0.6) <0.01* 0.44
Subscapular SF (mm) 10.7 (0.3) 10.5 (0.5) 0.60 0.05 14.3 (0.4) 18.4 (0.7) <0.01* 0.56
∑ triceps and subscapular
SF (mm) 21.5 (0.6) 20.9 (0.8) 0.56 0.06 32.2 (0.8) 39.5 (1.2) <0.01* 0.55
Screen time (h/day) 7.0 (0.3) 7.1 (0.5) 0.49 0.22 5.8 (0.3) 6.0 (0.3) 0.57 0.04
Physical activity (min/
week) 169.6 (7.5) 194.1 (13.2) 0.16 0.18 140.7 (7.0) 139.7 (9.5) 0.73 0.01
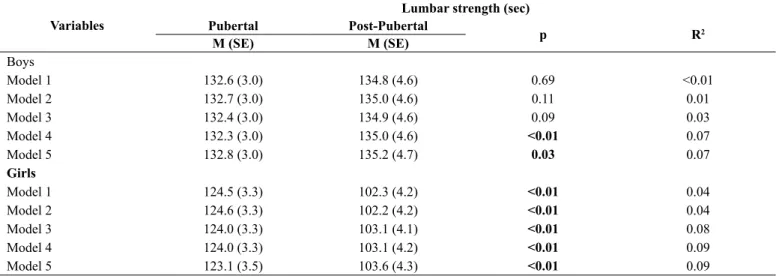
For boys, both in the crude model (model 1) and in models with the covariates of age, body mass and height (Models 2 and 3), there were no differences in the performance of the lumbar force test in relation to the maturational stage. However, when considering the effect of BMI, triceps SF, subscapular SF, sum
of SF (Model 4), screen time and physical activity (Model 5), post-pubertal boys presented better performance in the lumbar force test compared to pubertal ones (p <0.05). The inal model with all covariates had an explanatory power of 7% of lumbar force variation in relation to sexual maturation in boys (Table 4).
Table 3. Pearson correlation coeficient among variables investigated according to the sex of adolescents. Pearson correlation coeficient (p value)
Age
Total Body Weight
Height BMI Triceps
SF
Subscapular SF
∑ triceps and
subscapular SF
Screen time
Physical activity
Boys
Total body weight 0.13* -
-Height 0.14* 0.52* -
-BMI 0.09 0.89* 0.09*
-Triceps SF -0.03 0.64* 0.05 0.73*
-Subscapular SF 0.12* 0.73* 0.10* 0.79* 0.82* -
∑ triceps and subscapular SF 0.04 0.71* 0.08 0.79* 0.96* 0.95*
-Screen time -0.06 -0.05 -0.06 -0.02 0.06 0.06 0.06
-Physical activity -0.05 0.06 0.13* 0.01 -0.14* -0.12* -0.14* -0.21*
-Lumbar strength 0.10 -0.11* 0.03 -0.14* -0.20* -0.22* -0.22* -0.11* 0.06
Girls
Total body weight 0.11* -
-Height 0.09* 0.43* -
-BMI 0.09* 0.92* 0.06
-Triceps SF 0.03 0.72* 0.10* 0.75*
-Subscapular SF 0.03 0.71* 0.05 0.77* 0.81*
-∑ triceps and subscapular SF 0.03 0.75* 0.08 0.90* 0.95* 0.95*
-Screen time -0.14* -0.02 -0.02 -0.01 -0.06 0.02 0.04
-Physical activity 0.04 0.04 0.01 0.04 0.02 -0.01 0.01 -0.01
-Lumbar strength 0.01 -0.25* -0.08 -0.24* -0.23* -0.25* -0.27 -0.02 -0.01
BMI - Body Mass Index; SF - Skinfolds; Σ - Sum, * p <0.05.
Table 4. Comparison of lumbar force between pubertal and post-pubertal adolescents.
Variables
Lumbar strength (sec)
Pubertal Post-Pubertal
p R2
M (SE) M (SE)
Boys
Model 1 132.6 (3.0) 134.8 (4.6) 0.69 <0.01
Model 2 132.7 (3.0) 135.0 (4.6) 0.11 0.01
Model 3 132.4 (3.0) 134.9 (4.6) 0.09 0.03
Model 4 132.3 (3.0) 135.0 (4.6) <0.01 0.07
Model 5 132.8 (3.0) 135.2 (4.7) 0.03 0.07
Girls
Model 1 124.5 (3.3) 102.3 (4.2) <0.01 0.04
Model 2 124.6 (3.3) 102.2 (4.2) <0.01 0.04
Model 3 124.0 (3.3) 103.1 (4.1) <0.01 0.08
Model 4 124.0 (3.3) 103.1 (4.2) <0.01 0.09
Model 5 123.1 (3.5) 103.6 (4.3) <0.01 0.09
Sec- seconds; M - Mean; SE - Standard Error; R2 - Determination coeficient; BMI - Body Mass Index; SF Skinfolds.
Model 1: Crude model, without covariant;
Model 2: Analysis of covariance with variable age as covariate;
Model 3: Analysis of covariance with variables age, total body weight and height as covariates;
Model 4: Analysis of covariance with variables age, total body weight, stature, BMI, triceps SF, subscapular SF and sum of SF as covariates;
Pubertal girls presented better results in comparison to post-pubertal ones (Model 1). When the model was adjusted for age (Model 2), body mass and stature (Model 3), BMI, triceps SF, subscapular SF and sum of SF (Model 4), screen time and physical activity (Model 5), this difference was maintained (p <0.05). The inal model, with all variables, explained approximately 9% of lumbar force variation in relation to sexual maturation in girls (Table 4).
Discussion
The results of the present study identiied that post-pubertal boys presented better performance in the lumbar force test compared to pubertal boys. Such a difference was only possible when the effects of body fat, screen time and physical activity were controlled in the analysis. For girls, those who were in the pubertal maturational stage presented better performance in the lumbar force test compared to post-pubertal girls. This difference was observed both in controlling and in not controlling the analyses for possible interference variables in the lumbar force test.
For boys, the indings of the present study are in agreement with a survey carried out in England, with the participation of 313 adolescents aged 11-16 years, in which higher strength levels in the upper limbs was observed for post-pubertal boys in comparison to pubertal boys, even when interference of body mass and height was controlled17. Similar results were found in a study carried out with adolescents from public schools in southern Brazil, in which boys who belonged to the more advanced stages of sexual maturation had better performance in strength tests of upper limbs and abdomen compared to those in the initial stages of maturation15.
The higher levels of lumbar force in post-pubertal boys can be explained by natural variations due to growth, maturation and development of muscular structures2,27. Peak height growth occurs approximately at the age of 14 years in boys, followed by peak muscle gain27,28. This occurs because during this period, the production of anabolic hormones testosterone and growth hormone (GH) are higher in post-pubertal boys, which leads to a greater amount of muscle mass and strength11,17,27.
The difference in lumbar force performance between pubertal and post-pubertal boys was only identiied after controlling BMI, SF, screen time and physical activity interference. The literature reports that excess weight and body fat are directly associated with lower strength levels8,29. In addition, during adolescence, boys are more likely to engage in regular physical activity, and stimuli at muscle level resulting from the practice of physical activity lead to increased muscle strength levels, regardless of the natural changes that occur in body composition during adolescence11,12,29,30.
Girls in the pubertal maturational stage presented higher values in the lumbar force test compared to girls in the post-pubertal maturational stage, regardless of whether or not analyses were controlled by age, body mass, height, BMI, body fat, screen
time and physical activity. Unlike boys, muscle strength in girls tends to decrease as maturational stages progress27. After peak height growth, approximately at the age of 12 years, menarche occurs, which is characterized by increased production of female hormones (estradiol) and decreased production of testosterone and GH9,27. Deiciency in GH secretion inhibits the rhythm of pubertal development, causing an increase in the amount of body fat in girls13,27. Thus, excess adiposity associated with muscle mass reduction results in decreased strength levels as maturational development occurs9,27,28.
In girls, the possible interference variables analyzed in the present study did not inluence strength levels of pubertal and post-pubertal girls. A possible justiication for this fact would be related to decreased somatic growth and increased production of the estrogen hormone concomitant with the increased age of girls27, both of which increase body fat and decrease muscle strength levels13,29. In addition, sedentary behavior and physical inactivity are more prevalent in older girls than in boys, and such behaviors are directly associated with lower strength levels11,12. Thus, regardless of variables analyzed, pubertal girls tend to perform better in lumbar force tests compared to post-pubertal girls.
The limitations of this study refer to the cross-sectional design that does not allow establishing causal relationships between performance in the lumbar force test and maturational stages (pubertal and post-pubertal). Another study limitation was the fact that sexual maturation was self-reported. The literature recommends that the most accurate way to evaluate this variable is through direct observation or magnetic resonance imaging19.
The representativeness of the sample, composed of school adolescents from a city in southern Brazil, is a strong point of the present study. In addition, the results of this research provide information regarding the interference of aspects related to physical growth, body fat and lifestyle behaviors in the lumbar force of adolescents according to maturational development.
Conclusion
Post-pubertal boys presented better performance in the lumbar force test compared to pubertal boys when interference of body fat, screen time and physical activity was controlled. Pubertal girls presented better lumbar force when compared to post-pubertal girls, controlling or not the interference of physical growth, body fat, screen time and physical activity.
as a major ield of activity, is conigured as an ideal scenario for the promotion of stimuli aimed at strengthening the skeletal muscles and reducing sedentary behaviors.
Thus, through the results of this study, Physical Education teachers can direct activities of learning, development and motor control, sports practices and development of physical itness related to health, so that adolescents, when they become adults, present lower risks of diseases due to low levels of strength in the lower back.
References
1. Caspersen CJ, Powell KE, Christenson GM. Physical activity,
exercise, and physical itness: deinitions and distinctions for health-related research. Public Health Rep. 1985;100(2):126–31. 2. Plowman SA. Top 10 research questions related to musculoskeletal physical itness testing in children and adolescents. Res Q Exerc Sport. 2014;85(2):174–87.
3. Gledhill N, Jamnik V. The canadian physical activity, itness and lifestyle approach (CPAFLA). Canadian Society for Exercise Physiology, Ottawa, Canada, 2003.
4. Hasler CC. Back pain during growth. Swiss Med Wkly. 2013;143(January):1–22.
5. Dorneles RCG, Oliveira HL da R, Bergmann ML de A, Bergmann GG. Flexibility and muscle strength/resistance indicators and screening of low back pain in adolescents. Rev Bras Cineantropom Hum. 2016;18(1):93–102.
6. Graup S, de Araújo Bergmann ML, Bergmann GG. Prevalence of nonspeciic lumbar pain and associated factors among adolescents in Uruguaiana, state of Rio Grande do Sul. Rev Bras Ortop. 2014;49(6):661–7.
7. Lemos AT de, Santos FR dos, Moreira RB, Machado DT, Braga FCC, Gaya ACA. Ocorrência de dor lombar e fatores associados em crianças e adolescentes de uma escola privada do sul do Brasil. Cad Saude Publica. 2013;29(11):2177–85.
8. Silva DAS, Gonçalves ECDA, Grigollo LR, Petroski EL. Fatores associados aos baixos níveis de força lombar em adolescentes do Sul do Brasil. Rev Paul Pediatr. 2014;32(4):360–6.
9. Rogol AD, Clark PA, Roemmich JN. Growth and pubertal development in children and adolescents: effects of diet and physical activity. Am J Clin Nutr. 2000.72(Suppl):521–8. 10. Malina R, Bouchard C, Bar-Or O. Crescimento, maturação e
atividade física. 2a edição. São Paulo: Phorte; 2009. 1-784. 11. Bacil EDA, Mazzardo Júnior O, Rech CR, Legnani RFDS,
Campos W De. Atividade física e maturação biológica: uma revisão sistemática. Rev Paul Pediatr. 2015;33(1):114–21. 12. Bacil EDA, Piola TS, Watanabe PI, Da Silva MP, Legnani RFS,
De Campos W. Maturação biológica e comportamento sedentário em crianças e adolescentes: uma revisão sistemática. J Phys Educ. 2016;27(1):2730.
13. Taeymans J, Clarys P, Abidi H, Hebbelinck M, Duquet W. Developmental changes and predictability of static strength in individuals of different maturity: A 30-year longitudinal study. J Sports Sci. 2009;27(8):833–41.
14. Alvarez-bueno C, García-hermoso A. Association between physical activity, sedentary behavior, and itness with health related quality of life in healthy children and adolescents: A protocol for a systematic review and meta-analysis. Medicine (Baltimore). 2017;96(12):1–5.
15. Minatto G, Petroski EL, Silva DAS. Gordura corporal, aptidão muscular e cardiorrespiratória segundo a maturação sexual em adolescentes brasileiros de uma cidade de colonização germânica. Rev Paul Pediatr. 2013;31(2):189–97.
16. Silva DAS, Martins PC. Impact of physical growth, body adiposity and lifestyle on muscular strength and cardiorespiratory itness of adolescents. J Bodyw Mov Ther. 2017;6–11.
17. Jones MA, Hitchen PJ, Stratton G. The importance of considering biological maturity when assessing physical itness measures in girls and boys aged 10 to 16 years. Ann Hum Biol. 2000;27(1):57–65.
18. Adaptada Idep. Atlas Brasil. Atlas do desenvolvimento humano no brasil. PNUD. Ipea, FJP, Brasília. Available from: http:// atlasbrasil.org.br/2013/pt/peril_m/sao-jose_sc [Accessed 8 April 2017].
19. Silva DAS, Tremblay M, Pelegrini A, dos Santos Silva RJ, Cabral de Oliveira AC, Petroski EL. Association between aerobic itness and high blood pressure in adolescents in brazil: evidence for criterion-referenced cut-points. Pediatr Exerc Sci. 2016;28(2):312–20.
20. Tanner JM. Growth at adolescence: with a general consideration of the effects of hereditary and environmental factors upon growth and maturation from birth to maturity. 2nd ed. Oxford: Blackwell Scientiic Publications; 1962.
21. Matsudo SMM, Matsudo VKR. Self-assessment and physician assessment of sexual maturation in Brazilian boys and girls: concordance and reproducibility. Am J Hum Biol. 1994;6(4):451–5.
22. Marfell-Jones MJ, Stewart AD, Ridder JH. International standards for anthropometric assessment. Wellingtom, New Zealand: International Society for the Advancement of Kinanthropometry; 2012.
23. Committee on Children with Disabilities AA of P. American academy of pediatrics: Children, Adolescents, and Television. Pediatrics. 2001;107:423–6.
24. Guedes DP, Lopes CC. Validação da versão brasileira do Youth Risk Behavior Survey 2007. Rev Saude Publica. 2010;44(5):840–50.
25. Who WHO. Global recommendations on physical activity for health. Geneva World Heal Organ. 2010;60.
26. Cohen J. Copyright. Revised ed. Statistical power analysis for the behavioral sciences. New York: Academic Press; 1977.
27. Ré AHN. Crescimento, maturação e desenvolvimento na infância e adolescência: implicações para o esporte. Motricidade. 2011;7(3):55–67.
28. Bim RH, Nardo-Junior N. Aptidão física relacionada à saúde de adolescentes estagiários da Universidade Estadual de Maringá. Acta Sci Heal Sci. 2005;27(1):77–85.
30. Malina RM, Claessens AL, Van Aken K, Thomis M, Lefevre J, Philippaerts R, et al. Maturity offset in gymnasts: application of a prediction equation. Med Sci Sport Exerc. 2006;38(7):1342–7.
Acknowledgements
Apoio inanceiro:Conselho Nacional de Desenvolvimento Cientíico e Tecnológi
-co – CNPQ.
Corresponding Author
*Diego Augusto Santos Silva
Universidade Federal de Santa Catarina – Centro de Desportos, Departamento de Educação Física, Campus Universitário, Trindade, Caixa Postal 476, CEP 88040-900, Florianópolis, Santa Catarina, Brasil.
Email: [email protected]
Manuscript received on July 10, 2017 Manuscript accepted on August 31, 2017