Universidade do Minho
Escola de Ciências
Marisa Borges Ferreira
October 2015
Characterization of the oculomotor alterations
in inicial phase of Multiple Sclerosis
Marisa Bor ges F err eir a Characterization of t he oculomo
tor alterations in inicial phase of Multiple Sclerosis
UMinho|20
Universidade do Minho
Escola de Ciências
Marisa Borges Ferreira
October 2015
Characterization of the oculomotor alterations
in inicial phase of Multiple Sclerosis
Work supervised by:
Doctor António Filipe Teixeira Macedo
Department of Physics and Optometry
Doctor Paulo Alexandre Silva Pereira
Department of Mathematics and Applications
Master in Advanced Optometry
IV
A
CKNOWLEDGEMENTS
I would like to start by acknowledge all the volunteers in this study for their enthusiastic participation. This study is dedicated to them and to Paulo Pereira, the head of the Multiple Sclerosis Association and my co-supervisor.
My thanks to Professor Filipe for monitoring and boost my academic career in research. I thank him for guidance in this study and for making me believe that eye movements are the window to the brain. Looking back (something still poorly studied in eye movement) I recognize that my learning was based on the support, motivation and teachings that he provided.
I also would like to thank the work and dedication of the other members of the research project. Particularly thanks to Marta, the psychologist, to João Cerqueira and José Figueiredo, the two neurologists, to Inês Sousa, the other stats expert and enthusiastic control, for their help in data collection, patients’ selection, data analysis and for their general help in the conceiving this study. I also would like to thank Carla Sofia for her help recruiting
participants, and Dora Marques for her help during data collection and to Olga Joana for stats clarifications.
I am grateful to my parents for the confidence in my professional beliefs that turned my desire to do in what I have been doing. To thank the concept of choice that they taught me which leads me to question and seek. Also to my brother for making me realize that it's not all about me and for making me see the world around, by looking at human behavior. Besides my family, I want to acknowledge in special my uncle António for his support and example.
I also want to thank friends’ people and colleagues. A mention to Gonçalo by his desire of I become a successful woman and to have been present.
V
A
BSTRACT
Characterization of the oculomotor alterations in initial phase of Multiple Sclerosis
Relevance
Multiple Sclerosis (MS) is a chronic neurodegenerative disease caused by inflammation of the Central Nervous System and leading to dysfunction of neural circuits. The disease can lead to functional changes in high-level processes such as attention, memory, processing speed information and
decision-making. Currently available techniques to monitor functional changes have limitations with, for example, poor correlation between structural and functional changes. Eye movements are altered from early stages in the condition and can be useful to overcome some of the current limitations faced when measuring functional changes in MS.
Purpose
The purpose of this study was to investigate saccades and anti-saccades in MS and control participants and to compare oculomotor parameters with standard functional outcomes.
Methods
Using a case control design, eye movements’ performance was evaluated in two experiments. Participants performed two functional tasks one consisting in endogenous generated saccades and other consisting in anti-saccades. A battery of neuropsychological tests was also performed to assess fatigue, depression and cognitive functioning.
Results
In both experiments the results of MS group were altered when compared with controls. In saccades, MS fatigued patients showed increased latency when compared with MS non-fatigue (p=0.035) and control groups (p=0.048). It was also found a reduced peak velocity between MS fatigued participants and controls (p=0.041). Fatigue magnitude was correlated with all saccadic parameters: latency (r= 0.4), peak velocity (r= -0.4) and amplitude (r= -0.5). In the anti-saccade task the MS group displayed more directional errors (p=0.03) and prolonged latencies for anti-saccades (p=0.003) and for
corrective-saccades (p=0.017) than controls. A correlation was found between general cognitive functioning score and the percentage of directional errors (r= -0.3).
Conclusion
Results from these the two experiments showed that parameters of saccades and anti-saccades were altered in MS patients and were correlated with others functional measures. These paradigms can be used as alternatives or complementary techniques to detect subclinical deficits caused by MS. More studies and better understanding of the factors causing variability in outcomes of these tests are necessary before using them as markers for MS.
Keywords: Saccades, Anti-saccades, Functional assessment, Fatigue, Cognition, Depression,
VI
R
ESUMO
Caracterização de alterações oculomotoras na fase inicial da Esclerose Múltipla
Relevância
A esclerose múltipla (EM) é uma doença neurodegenerativa crónica causada por inflamação do sistema nervoso central e que conduz a uma disfunção dos circuitos neuronais. A doença pode levar a alterações funcionais em processos de nível superior, tais como atenção, memória, velocidade de processamento de informação e tomada de decisão. Atualmente, técnicas disponíveis para monitorar as alterações funcionais têm limitações com, por exemplo, falta de correlação entre as alterações estruturais e funcionais. Os movimentos oculares são alterados desde estágios iniciais da doença e podem ser úteis para superar algumas das limitações atuais enfrentadas quando se mede alterações funcionais em EM.
Objetivo
O objetivo deste estudo foi investigar sacádicos e anti-sacádicos em EM e participantes controlo e comparar parâmetros oculomotores com resultados funcionais padrão.
Métodos
Através de um estudo caso-controle, o desempenho dos movimentos oculares foi avaliado em duas experiências. Os participantes realizaram duas tarefas funcionais que consistem em uma de sacádicos gerados endogenamente e outra de anti-sacádicos. Uma bateria de testes neuropsicológicos também foi realizada para avaliar a fadiga, depressão e funcionamento cognitivo.
Resultados
Em ambas as experiências os resultados do grupo EM estavam alterados quando comparados com os controlos. Nos sacádicos, pacientes fadigados com EM apresentaram aumento da latência quando comparados com os grupos de pacientes não-fadigados (p=0.035) e controlo (p=0.048). Verificou-se também um pico de velocidade reduzida entre participantes fadigados com EM e controlos (p=0.041). A magnitude da fadiga foi correlacionada com todos os parâmetros sacádicos: latência (r =0.4), pico de velocidade (r =-0.4) e amplitude (r =-0.5). Na tarefa de anti-sacádicos o grupo EM exibiu mais erros direcionais (p=0.03) e latências prolongadas para os anti-sacádicos (p=0.003) e para os sacádicos-corretivos (p=0.017) do que os controles. Foi encontrada uma correlação entre o score do funcionamento cognitivo geral e a percentagem de erros direcionais (r=-0,3).
Conclusão
Os resultados destes duas experiências demonstraram que os parâmetros das sacádicos e anti-sacádicos estavam alterados em pacientes com EM e foram correlacionados com outras medidas funcionais. Estes paradigmas podem ser usados como técnicas complementares ou alternativas para detetar défices subclínicos causados por EM. Mais estudos e melhor compreensão dos fatores que causam variabilidade nos resultados destes testes são necessários antes de usá-los como marcadores para a EM.
Palavras-chave: Sacádicos, Anti-sacádicos, Avaliação funcional, Fadiga, Cognição, Depressão,
VII
C
ONTENTS
Acknowledgements ... IV Abstract ... V Resumo ... VI Contents ... VII List of abbreviations/acronyms ... X List of figures ... XI List of tables ... XIII1st Chapter: Multiple Sclerosis ... 1
-1.1 Definition of Multiple Sclerosis ... 1
-1.2 Neurocognitive deficits ... 3
-1.3 Eye Movements and Vision changes caused by MS ... 4
-1.4 Summary of chapter ... 5
2nd Chapter: The Saccadic System... 6
-2.1 Definition and characterization of saccades ... 6
-2.2 Types of saccades and neural saccadic control ... 8
-2.2.1 Types of saccades ... 8
-2.2.2 Neural networks involved in planning and execution of saccades ... 10
-2.3 Summary of chapter ... 11
3rd Chapter: Functional measures in MS using EM ... 12
-3.1 Fatigue and saccades ... 12
-3.2 Cognition and antisaccades ... 14
-3.3 Summary of chapter ... 16
4th Chapter: Hypothesis and aim of this thesis ... 17
-4.1 Main purpose ... 17
-VIII
4.3 Hypothesis ... 18
-4.4 Rationale... 18
5th Chapter: General Methods ... 20
-5.1 Participants ... 20
-5.2 Equipment ... 21
-5.3 Collect room conditions ... 21
-5.4 Saccades detection... 22
6th Chapter: Endogenous Saccades and Fatigue ... 23
-6.1 Neuropsychological inventories ... 23
-6.2 Procedure for endogenous saccades paradigm ... 24
-6.3 Saccadic variables analysed ... 25
-6.4 Trialbytrial analysis ... 25
-6.5 Participants excluded after data collection ... 26
-6.6 Statistical analysis ... 27
-6.7 Results of saccades paradigm ... 27
-6.7.1 Neuropsychological results ... 27
-6.7.2 Saccades results ... 28
-6.7.3 Correlations between fatigue and saccades results ... 29
7th Chapter: Antisaccades and neurocognitive performance ... 30
-7.1 Neuropsychological tests... 30
-7.2 Procedure during the antisaccade paradigm ... 32
-7.3 Antisaccades parameters analysed ... 33
-7.4 Trialbytrial analysis ... 33
-7.5 Participants excluded after data collection ... 34
-7.6 Statistical analysis ... 35
-7.7 Results of antisaccades paradigm ... 35
-IX
7.7.2 Antisaccade results ... 36
-7.7.3 Correlations between outcomes ... 39
8th Chapter: General Discussion ... 40
-8.1 Discussion of endogenous saccades and fatigue ... 40
-8.2 Discussion of antisaccades and neurocognitive performance ... 42
-8.3 Limitations ... 45
-8.4 Conclusion and future work ... 45
References ... 46
Appendices ... 52
Appendix 1 Montreal Cognitive Assessment ... 52
Appendix 2 Digit Span (WAISIII) ... 53
Appendix 3 Symbol Digit Modalities Test ... 54
Appendix 4 Twenty Questions Test (DKEFS) ... 55
Appendix 5 Stroop Color and Word Test ... 56
Appendix 6 – Supplementary results of saccades ... 57
-X
L
IST OF ABBREVIATIONS
/
ACRONYMS
MS – Multiple Sclerosis EM – Eye Movements
CNS – Central Nervous System
RRMS – Relapsing Remitting Multiple Sclerosis SPMS – Secondary Progressive Multiple Sclerosis PPMS – Primary Progressive Multiple Sclerosis PRMS – Progressive Relapsing Multiple Sclerosis INO – Internuclear Ophthalmoplegia
EDSS – Expanded Disability State Scale MRI – Magnetic Resonance Imaging FSS – Fatigue Severity Scale
MFIS – Modified Fatigue Impact Scale BDI – Beck Depression Inventory
MOCA – Montreal Cognitive Assessment SDMT – Symbol Digit Modalities Test
XI
L
IST OF FIGURES
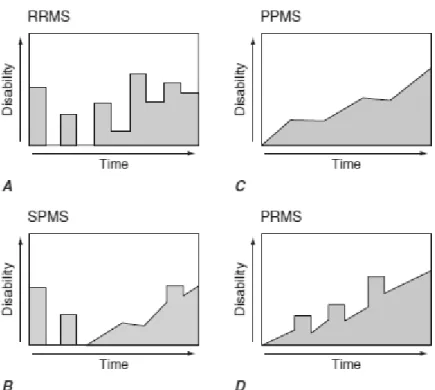
Figure 1 Graphical representation of the four courses of MS considering disability over time. (A) Relapsing/remitting MS; (B) Secondary progressive MS; (C) Primary progressive MS and (D) Progressive/relapsing MS ... 3 -Figure 2 Representation of INO caused by demyelination of MLF responsible to transport the
innervation message from abducens neurons into the brainstem to activate the
contralateral medial muscle for an effectuated eye movement ... 5 -Figure 3 Plots representing characteristic parameters of accurate 10deg saccade made by a
normal subject ... 7 -Figure 4 Main sequence representing the relationship between peak velocity and amplitude of
typical saccades ... 8 -Figure 5 Main cortical areas and network involved in planning of saccades. Highlight 3
principal areas associated with the neuropsychological processes ... 9 -Figure 6 Representation of two common saccades, in which the arrow represents the direction
that the participant has to make. ... 10 -Figure 7 Setup of the system consists of 2 computers used to perform eye movement tasks.
On the left side, the monitor coupled to the eyetracker is connected to SMI computer and on the right side a PC that controlled the stimulus presentation. ... 21 -Figure 8 Illustration of collecting data conditions showing the head support with a distance of 70cm from the monitor ... 22 -Figure 9 Procedure of the saccadic paradigm and the variables analysed. On the left hand side
is represented the paradigm. The graph on the right side represents the output of “valid” trials amplitude vs time. ... 25 Figure 10 Decision algorithm for analysis of trials in the saccadic paradigm ... 26 -Figure 11 Saccade latency for the 3 groups of participants: MS fatigue, MS non-fatigue and
-XII
Figure 12 Saccade peak velocity for the three groups of participants: MS fatigue, MS nonfatigue and control group ... 29 -Figure 13 The anti-saccade task. A- Procedure and B - Representation of changes in eye
movement amplitude with time during a typical block ... 32 Figure 14 Decision algorithm for analysis of trials in the antisaccadic paradigm ... 34 Figure 15 Comparison of latencies among MS and control groups... 37 -Figure 16 a, b, c – Kaplan-Meier curves represent the proportion of participants of each group
(MS and controls) reacts over time for a) anti-saccade, b) pro-saccade and c) corrective latencies... 38
-XIII
L
IST OF TABLES
Table 1 Summary of the demographic, clinical, fatigue and depression information of the final sample of participants for three groups (SD = standard deviation) ... 28 -Table 2 Summary of the demographic and clinical information of the final sample of
participants for both groups (SD = standard deviation) ... 35 -Table 3 Summary of the psychological evaluation results of the final sample of MS patients
-- 1 --
1ST CHAPTER:
MULTIPLE SCLEROSIS
This chapter gives an overview of multiple sclerosis (MS). It starts with concept and classification of the disease addressing also some epidemiologic facts and then describes typical neurocognitive and visual consequences of MS.
1.1 D
EFINITION OF
M
ULTIPLE
S
CLEROSIS
Multiple Sclerosis (MS) is a neurodegenerative disease characterized by a widespread multilesion demyelination and consequent reduction of neural conduction within the central nervous system (CNS) leading to functional impairments (Archibald & Fisk, 2000; Kurtzke, 1983). MS represents the most common cause of chronic impairment (Confavreux, Vukusic, & Adeleine, 2003) by damage of white matter fibre and consequent inflammation of the CNS (Keegan & Noseworthy, 2002). Represents the main cause of disability in non-traumatic neurological diseases in young adults (Sadovnick & Ebers, 1993) affecting up to 1 in 1000 people in some countries (Kingwell et al., 2013) and in Portuguese population a recent study has found a prevalence of approximately 40 cases per 100,000 inhabitants (Figueiredo, Silva, Cerqueira, & Fonseca, 2015). The age of diagnosis range individuals between 20 and 40 years old. Although pathological etiology is still poor specified some investigation presuppose that MS might result of a multifactor combination such as hereditary and environmental causes (Risco et al., 2011).
- 2 -
The neurologic impairment in MS is measured by a clinical scale, the Expanded Disability Status Scale (EDSS). An EDSS of 0 represents normal neurologic exam and 10 indicates death due to MS. According with the type of evolution MS is characteristically classified in 4 clinical courses (Hauser & Goodkin, 2001): 1) Relapsing/remitting MS
(RRMS), shown in Figure 1-A, is the most common course affecting around 85% of MS
cases with an onset manifestation of discrete attacks that could be a duration of days until a few weeks. Generally, patients have complete recovery over the following weeks to months except if the affection is several. 2) Secondary progressive MS (SPMS), shown in Figure 1-B, at the beginning present the RRMS behaviour and subsequently around 2% develop a steady deterioration associated with fixed neurologic disability. 3) Primary progressive MS
(PPMS) shown in Figure 1-C occur in approximately 15% of cases characterized only by a
steady functional decline from disease onset without history of attacks. This type is
associated with a later appearance of disease around the fourth decade of life with a marked development of the symptoms in relation to the typical course. 4) Progressive/relapsing MS
(PRMS) shown in Figure 1-D, is a combination of PPMS and SPMS courses exhibiting
steady deterioration and occasional attacks overlaps the progressive condition with a prevalence of 5% of MS patients. An early stage for the majority of patients with EDSS scores <3.5 is linked with RRMS, walk normally and are generally not disabled. Conversely, patients classified with EDSS scores >5.5 have progressive MS (SPMS or PPMS), are gait-impaired, and, typically, are occupationally disabled.
- 3 -
Figure 1: Graphical representation of the four courses of MS considering disability over time. (A) Relapsing/remitting MS indicating sporadic outbreaks; (B) Secondary progressive MS type overlaps the discrete attacks, but with development of a progressive form of disability; (C) Primary progressive MS is an amplified dysfunctional form without experience of outbreaks and (D) Progressive/relapsing MS present progressive neurological impairment combined with intermittent attacks (Hauser & Goodkin, 2001).
1.2 N
EUROCOGNITIVE DEFICITS
Cognitive impairment often is the first indicator of the disease progression (Patti et al., 2009; Ruggieri et al., 2003) with a prevalence ranging from 40% to 65%, depending of the study setting. Magnetic Resonance Imaging (MRI) findings demonstrated reserved links between cognitive deterioration with increased brain lesion load and brain atrophy. Although cognitive impairments can be present at all stages of the disease and in all clinical courses, they are less frequent and evident at early stages (low EDSS) or in the RRMS course compared to PPMS and SPMS courses. The EDSS index typically portrays well motor abilities but is insensitive to cognitive changes. High level processes commonly affected are attention, memory, processing speed information and decision making (Hutton, 2008). This type of impairment can lead to disabilities and handicaps in work and social life that are independently of the degree of physical disability (Amato, Zipoli, & Portaccio, 2006).
Fatigue is one of the most common problems in multiple sclerosis, typically reported by 50% of the patients (Leocani, Colombo, & Comi, 2008). Fatigue complaints seem to be
- 4 -
physical, if results from prolonged physical tasks, or cognitive, when associated with, for example, attentional performance disruption (Lauren B Krupp, Serafin, & Christodoulou, 2010).
Evaluation of cognitive function has been studied typically through neuroimaging techniques (Chiaravalloti & DeLuca, 2008) and neuropsychological tests (Benedict et al., 2006; Rogers & Panegyres, 2007). Currently is useful a considerable quantity of
neuropsychological tests. The amount is useful to collect a reliable report of the cognitive deficits at early stage and standardize the point of deterioration. Neuropsychological tests serve for comparison the cognitive behaviour to experimental assessment of computerized eyetracking measures (Fielding, Kilpatrick, Millist, & White, 2009c) and denotes the basis of association to the evident structural damage into brain networks conducted by MRI studies (Louapre et al., 2014).
1.3 E
YE
M
OVEMENTS AND
V
ISION CHANGES CAUSED BY
MS
Sensory visual and oculomotor systems are commonly affected by MS. Abnormalities extend from optic neuritis to eye movements (EM) paralysis or nystagmus (Hickman, Raoof, McLean, & Gottlob, 2014). The optic neuritis is caused by an inflammation of the optic nerve in the affected eye and is normally active during relapses (Balcer, Miller, Reingold, & Cohen, 2015). In contrast, oculomotor abnormalities can be present most of the time even outside relapsing periods. Impaired control of eye movement is caused mainly by alterations in the brainstem, oculomotor centres. Eye movements’ abnormalities can be clinically visible because they can cause double vision due to nerve paralysis or disturbances of conjugate gaze responses. Poor enervation of the muscles can lead to longer reaction times (or latency) during visually guided eye movements, decreased peak velocity and inaccurate spatial precision of such movements (Frohman, Frohman, Zee, McColl, & Galetta, 2005). The pathways involved in eye movements control comprise several areas of the CNS. Because of that, oculomotor measures can be used to investigate neurologic impairments including fatigue (Chahin, 2014).
Binocular diplopia is associated with a CNS dysfunction and is common in MS due to incoordination of the extraocular muscles (Chahin, 2014). Diplopia affecting more than 40% of people with MS is normally due to internuclear ophtalmoplegia (INO). INO, illustrated in Figure 2 (Chen & Gordon, 2005), is characterized by an oculomotor impairment in which,
- 5 -
during voluntary and reflexive eye movements, the speed of the adducting eye is slower than the speed of the abducting eye. INO is likely to be caused by demyelination of the neuronal pathways at the level of the brainstem and, in many cases, is visible in clinical examinations (Frohman et al., 2002). More specifically, INO is due to a lesion of the medial longitudinal fasciculus (MLF) which carries interneurons from the abducens nucleus to the medial rectus subnucleus of the contralateral oculomotor nucleus (Frohman et al., 2005).
Figure 2: Representation of INO caused by demyelination of MLF responsible to transport the innervation message from abducens neurons into the brainstem to activate the contralateral medial muscle for an effectuated eye movement. When looking in right side the left eye present a lag or in advanced stage does not reach the final target position and the right eye often is accompanied with nystagmus (Matta, Leigh, Pugliatti, Aiello, & Serra, 2009) (Chahin, 2014).
1.4 S
UMMARY OF CHAPTER
This chapter provided the fundamental background to understand what is multiple sclerosis and some of its implications. The next chapter provides detailed background about
- 6 -
2ND CHAPTER: THE
SACCADIC SYSTEM
This chapter describes the fundamental background about the saccadic system. It starts with a definition and characterization of saccades and provides an overview of the neural networks involved in saccade control.
2.1 D
EFINITION AND CHARACTERIZATION OF SACCADES
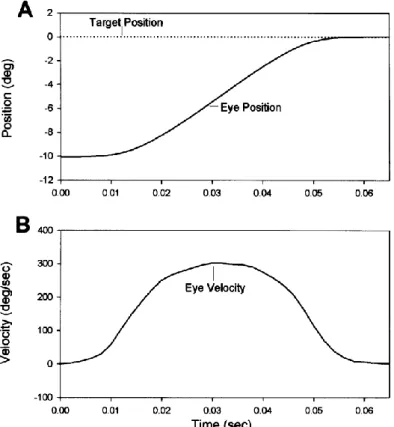
Saccades are rapid eye movements that align the fovea with the object of interest. (Becker, 1989). Saccades can be triggered by visual, auditory, remembered, tactile or even imaginary targets. Initiation of saccades from the stimulus takes a delay about 200ms to neural processing in the retinal, cerebral cortex, superior colliculus and cerebellum (R. J. Leigh & Zee, 2006). Visual system of normal subjects produces the fastest movements of the eye, saccades with extremely high acceleration and deceleration, up to 30 000 deg/sec², and velocities up to around 500 deg/s (Bahill, Clark, & Stark, 1975) or around 300 deg/sec for 10deg amplitude. Figure 3 shows the velocity and amplitude profile of the eye during a saccade.
- 7 -
Figure 3: Plots representing characteristic parameters of accurate 10deg saccade made by a normal subject. (A) Graph representing the position of the eye adjacent to the target position and (B) graph of the velocity of the eye over time (R. Leigh & Kennard, 2004).
A saccade is usually defined considering some parameters such as amplitude, peak velocity, and duration. Typically, a proportional relationship between parameters is maintained, e.g., a variation in amplitude implies a variation in speed (peak velocity) and duration. Another characteristic of saccades is that there is no time for visual feedback to correct the saccade after the eye jumps (Becker, 1989). From the velocity trace in Figure 3 is visible that the duration of a saccade with 10 degrees of amplitude is under 65msec. The main sequence illustrated in Figure 4 gives the relationship between these variable, peak velocity and size with deviations of typical values indicate abnormal saccades.
- 8 -
Figure 4: Main sequence representing the relationship between peak velocity and amplitude of typical saccades. The dots in the graph show saccades of normal subjects and the cross points represents data from a patient with abnormal saccades outside the prediction interval (R. Leigh & Kennard, 2004).
2.2 T
YPES OF SACCADES AND NEURAL SACCADIC CONTROL
The division of the various types of saccades that follows is made according with the circuitry involved in its control.
2.2.1 Types of saccades
For the purpose of this study is important to distinguish between saccades that made on the basis of goals of the observer that are called endogenous (top-down control or goal directed), and saccades made on the basis of stimulus properties, irrespective of the goals of the observer, are called exogenous (bottom-up control or stimulus driven) (Godijn &
Theeuwes, 2002). Both circuitries might be disrupted in MS because the affection of cortical and subcortical areas that establish the basis for their control (Jennifer E McDowell, Kara A Dyckman, Benjamin P Austin, & Brett A Clementz, 2008). These circuitries are illustrated in Figure 5.
- 9 -
Exogenously generated saccades
These type of saccades are controlled by neural circuitry that involves subcortical (striatum, thalamus, superior colliculus, and cerebellar vermis) and cortical (primary visual, extrastriate, and parietal cortices, and frontal and supplementary eye fields) structures. This types of saccades can then be subdivided in two types: i) Express saccades that are
characterized by short latency and can be elicited when a novel stimulus is presented after the fixation stimulus has disappeared (gap stimulus) and ii) Visually guided saccades that are saccades that redirect the gaze to a visual stimulus. These are also known as pro-saccades.
Figure 5: Main cortical areas and network involved in planning of saccades. Highlight 3 principal areas associated with the neuropsychological processes related to this work. First, beside the frontal eye field (FEF) associated with planning of endogenous generated saccades, the dorsolateral pre-frontal cortex (DLPFC) is responsible by decisional processes governing ocular motor behaviour such as inhibition and spatial memory (short term). The second region located in the posterior parietal cortex – parietal eye field within the posterior half of the intraparietal sulcus (ips) controlling spatial integration and attention. The last the parietal cingulate cortex (PCC) controls the externally guided eye movements and also attentional mechanisms (Pierrot-Deseilligny, Milea, & Müri, 2004).
- 10 -
Endogenous generated saccades
These saccades are generated by complex circuitry similar to exogenous driven saccades with involvement of additional regions such as prefrontal and anterior cingulate cortices, associated with decision and attentional functions. This circuitry is typically responsible to voluntary saccades made as part of purposeful behaviour (Jennifer E
McDowell et al., 2008). Endogenous generated saccades can be divided into: i) Predictive
and anticipatory - saccades generated in anticipation of the appearance of a target at a
particular location; ii) Anti-saccades - saccades generated voluntarily in the opposite direction to the sudden appearance of a target; iii) Memory-guided saccades - saccades generated to the location in which a target has been previously present and iv) Sequences of
saccades – memory-guided saccades made in response to targets presented sequentially at
series of locations (R. Leigh & Kennard, 2004).
2.2.2 Neural networks involved in planning and execution of saccades
The present section describes two common types of saccades that are pro-saccades and anti-saccades from both circuitries above, which were implemented in the tasks of this work. Figure 6 illustrates the difference between each type.
Figure 6: Representation of two common saccades, in which the arrow represents the direction that the participant has to make. In the left scheme the target appears in the same side that the desired
movement designated pro-saccade. By contrast, the right illustration indicates a mirror movement that required a look to the opposite side of the appearance of the target from the centre position.
- 11 -
To program the amplitude of a saccade the saccadic system calculates the retinal error, the distance between the retinal location of an image and the fovea to generate the main input (R. J. Leigh & Zee, 2006). Depending on the task demand activity in the visual cortex
predicts the type of saccade that to be executed by top-down activity. Records of functional MRI, electroencephalography and magnetoencephalography have shown more activity in areas such as medial Frontal Eye Field (FEF), Supplementary Eye Field (SEF) and prefrontal cortex during anti-saccades than during pro-saccades task (J. E. McDowell, K. A. Dyckman, B. P. Austin, & B. A. Clementz, 2008). Studies to distinguish between preparation and execution phases involved in the generation of anti-saccades using fMRI concluded that exist a high activation of FEF being lower before reflexive pro-saccades errors compared to correct antisaccades (Samuel B Hutton & Ulrich Ettinger, 2006).
The programing of anti-saccades requires an inhibitory phase and a generation phase. During inhibition and generation phases involved in anti-saccades ventrolateral and
dorsolateral cortices are active. These are areas also involved in cognitive processes such as decision making (Ettinger et al., 2008). More detailed medial frontal eye field (FEF) activity is more associated with inhibition during the planning period of movement and reflexive saccades have increased activity in the lateral FEF (J. E. McDowell et al., 2008). The generation of complex volitional saccades as anti-saccade involves basic network that supports simple pro-saccades command with additional areas responsible by inhibition process.
The additional requirements of the task demands explain the complexity of circuitry control and prolonged reaction times compared to pro-saccades.
2.3 S
UMMARY OF CHAPTER
This chapter related the description of the various types of saccades and functioning of the system control. The next chapter introduces the functional measures of fatigue and cognition commonly used.
- 12 -
3RD CHAPTER:
FUNCTIONAL
MEASURES IN MS
USING EM
Saccades can be measured non-invasively using infrared eyetracker and the interpretation of abnormalities can be performed with minimal training. Thus, some experts believe that eye movements might play an important role in understanding cognitive behaviour (R. Leigh & Kennard, 2004; Pierrot-Deseilligny et al., 2004).
3.1 F
ATIGUE AND SACCADES
Consequences of MS go beyond the physical disability and symptoms of fatigue and depression are commonly reported at any stage of the disease (Janardhan & Bakshi, 2002). Distressing symptoms of physical and mental fatigue have detrimental implications in career, employment and other activities reducing significantly the quality of life of those affected (Frohman et al., 2005; Janardhan & Bakshi, 2002). MRI is the reference imaging technique to monitor structural changes in the brain however at early of MS, cortical atrophy, measured by MRI, is poorly and not correlated with others functional symptoms (Calabrese et al., 2013).
- 13 -
Currently available techniques to assess, for example, fatigue have limitations. Poor agreement between self-report symptoms and structural changes at initial stages of the disease has been frequently found (Abhijit Chaudhuri & Peter O Behan, 2004).
The definition of fatigue is rather subjective and its origin difficult to define. The MS Council define fatigue as “a subjective lack of physical and/or mental energy that is perceived by the individual or caregiver to interfere with usual and desired activities” as cited by Kos et al. (Kos, Kerckhofs, Nagels, D'Hooghe M, & Ilsbroukx, 2008). The pathogenesis of fatigue remain under scrutiny (Induruwa et al., 2012) but some authors distinguish two types: i) primary fatigue, is likely to be a result from centrally mediated processes characterized by the disease such as inflammation, demyelination, or axonal loss and ii) secondary fatigue, which can be associated with, for example, reduced sleep quality or depression (Kos et al., 2008). Given this classification, one can say that the type of fatigue affecting patients with MS is likely to be a mixture of these two types.
There have been attempts to quantify fatigue using objective measures such as MRI (Genova et al., 2013; Mainero et al., 1999). However fatigue inventories are the most commonly used instruments to quantify, albeit subjectively, fatigue levels and its impact (Dittner, Wessely, & Brown). Two commonly used inventories in MS are the Fatigue Severity Scale (FSS) and the Modified Fatigue Impact Scale (MFIS) (Dittner, Wessely, & Brown, 2004). However, according to a review by Chaudhuri and Behan in 2004 these inventories have some limitations. According with this review these inventories, and other self-reported methods, often fail to regard fatigue as a multidimensional state of cognitive, physical and psychological components. More importantly, these questionnaires can
introduce bias into a study population because of participants’ knowledge that they are being studied (Hawthorne effect) (A. Chaudhuri & P. O. Behan, 2004). Given these limitations and the importance of fatigue in the context of MS, alternatives or complementary methods to study fatigue would be useful to the field.
Some studies suggest that eye movements are used to study fatigue in healthy people (LeDuc, Greig, & Dumond, 2005; Schmidt, Abel, Dell'Osso, & Daroff, 1979) and also in people with MS, in particular in patients with INO represented in Figure 2 (Matta et al., 2009),. Matta and colleagues speculate that mechanic disconjugacy, reflected by lower velocity of the adduction eye, observed in patients with INO is likely to be measuring not only fatigue but also oculomotor problems (Matta et al., 2009). More importantly, a recent
- 14 -
study gave evidence that eye movements, in these case saccades, can be used to monitor fatigue in MS patients without INO. In this study, investigators monitored saccades whilst participants performed an ocular motor ‘‘fatigue task’’ (Finke et al., 2012). Finke et al. observed longer saccade latencies in patients with fatigue symptoms and reduced peak-velocity over time in an exogenous saccade oculomotor task. In our understanding, the study by Finke and colleagues measured induced fatigue (fatigability) rather than basal fatigue, e.g. the fatigue that the patients report when asked about their subjective every day symptoms in inventories.
Fatigue have a negative impact on cognition, which predicts the degree of brain working load or their subjective overestimation (Leocani et al., 2008). Additionally, other consequents abnormalities associated to reasoning functions such as attention, working memory and executive functions are largely witnessed by interfere in the cognitive impairment (Rogers & Panegyres, 2007).
A recent study by Fielding and colleagues using an endogenous generated saccades paradigm was able to capture disruption of higher-order process such as attention (Fielding, Kilpatrick, Millist, & White, 2009b). Given the close interaction between fatigue and
attention(Faber, Maurits, & Lorist, 2012) we extended the study of Fielding and colleagues to investigate if the performance of endogenous generated saccades could be used to capture and characterization the influence of primary fatigue in patients with MS.
3.2 C
OGNITION AND ANTISACCADES
Cognitive impairment involves a variety of functions such as processing speed, executive functions, and attention (Chiaravalloti & DeLuca, 2008). Longitudinal studies have shown that reduced processing speed, resulting from efficiency lacks of the neural
transmission, is the most prevalent cognitive impairment in MS (Bergendal, Fredrikson, & Almkvist, 2007). Reduced processing of information is linked with difficulties in learning capacities that afterward could disrupt decision-making processes and memory (Chiaravalloti & DeLuca, 2008). Computerized tests of information processing, an alternative
psychophysical method to assess information processing speed in MS, gave evidence of increased reaction times in MS patients compared to healthy controls (Reicker, Tombaugh, Walker, & Freedman, 2007).
- 15 -
Eye movements’ abnormalities in MS patients are likely to reflect oculomotor
alterations that are under control of high level processes in the brain. According with Hutton et al., areas that control the ocular motility are also involved in cognitive functions such as working memory and attention (Hutton, 2008). Anti-saccades assessment has been receiving significant attention by measuring a wide range of cognitive control dysfunction (S. B. Hutton & U. Ettinger, 2006; Munoz & Everling, 2004). Anti-saccades as defined by Hallett consist in making an equal and opposite movement of a point steps horizontally (Munoz & Everling, 2004).
This type of eye movements is likely to capture effect of cognitive functions because their generation involves subcortical and cortical areas. For the generation of the
anti-saccades complex processes like inhibition and working memory are required and regions such as the prefrontal and anterior cingulate cortices are recruited (J. E. McDowell et al., 2008). This gives indication that specific alteration in saccades parameters as directional errors, pro-saccade latency and anti-saccade latency could be functioning as a marker of the cerebral affection.
Reviews from Everling et al. (1988) and Munoz and Everling (2004) suggest that anti-saccades are a potential tool to improve characterization and cognitive deficits in neurological diseases such as Multiple Sclerosis but little studies have been conducted about this subject. (Everling & Fischer, 1998; Munoz & Everling, 2004). So far only a few studies investigated possible correlations between alterations in anti-saccades and cognitive deficits. High quality studies have been conducted recently by group in Australia that published 3 interesting papers reporting, baseline results (Fielding, Kilpatrick, Millist, & White, 2009a),
longitudinal consistency (Fielding, Kilpatrick, Millist, Clough, & White, 2012) and structural evidences (S. C. Kolbe et al., 2014) that anti-saccade parameters were consistently associated with cognitive deficits such as attention, working memory and executive functions.
Inspired by the studies conducted by Fielding et al. (2009), White et al. (2012) and Scott and al. (2014), and in order to contribute to the characterizations of anti-saccades as a potential marker for cognitive deficits caused by MS this study was designed to investigate changes in anti-saccades parameters in patients diagnosed with MS at early stages of the disease.
- 16 -
3.3 S
UMMARY OF CHAPTER
MS is a chronic process which frequently becomes silent and hence monitoring disease is crucial to improve prognosis. Thus, alternative and objective methods are crucial to
perceive the conduction of messages from brainstem and cerebellar pathways and the signals manifested in order to provide better and prompt solutions for patients.
This chapter introduced functional measures of fatigue and cognition. The next chapter makes states or research questions, hypothesis and rationale.
- 17 -
4TH CHAPTER:
HYPOTHESIS AND
AIM OF THIS THESIS
This chapter describes the aim of the study, the questions studied, the hypothesis and the rationale for the investigation.
4.1 M
AIN PURPOSE
The aim of this study was to investigate if eye movements, saccades and anti-saccades, are altered at early stages of MS. Additional aims were to correlate those alterations with other functional measures such as fatigue symptoms or cognitive impairments.
4.2 G
ENERAL RESEARCH QUESTIONS
Question 1Are saccades altered in patients with multiple sclerosis?
Question 2
- 18 -
Question 3
Are the anti-saccades parameters such as directional errors altered in patients with MS?
Question 4
Are anti-saccades parameters correlated with others cognitive measures?
4.3 H
YPOTHESIS
Hypothesis 1Saccade latency, peak velocity and amplitude in patients with MS are different of controls.
Hypothesis 2
Saccade parameters such as latency are correlated with fatigue scores in patients with MS.
Hypothesis 3
The number of directional errors, latency and spatial accuracy in anti-saccades for patients with MS is altered when compared with controls.
Hypothesis 4
Anti-saccades parameters such as latency and directional errors are correlated with scores in neuropsychological tests assessing inhibitory control, memory and/or attention.
4.4 R
ATIONALE
Multiple sclerosis is a chronic inflammatory demyelinating disease of the central nervous system that leads to several functional impairments. One of the well-known consequences of the disease is impairment of eye movement control, in particular disturbances of conjugate eye movements.
Impairment of eye movements control in MS provides evidence that centres and cranial nerves responsible for its control are affected from early stages of the disease. Also affected from early stages of the disease are some cognitive functions controlled by higher level functions of the brain. Eye movements are controlled by bottom-up visual information and top-down decisions and because of that brain regions and networks involved in its control are also involved in cognitive functions. Because of this, eye movements in MS are likely to be
- 19 -
altered not only due to impairment of the oculomotor system but also due to difficulties in top-down cognitive control.
Therefore, when correct paradigms are used for recruiting specific brain areas or networks such are paradigms that recruit the endogenous circuitry, oculomotor disturbances are likely to capture functional changes reflecting demyelination caused by MS.
- 20 -
5TH CHAPTER:
GENERAL METHODS
This chapter provides information about participants, equipment and general protocol for data collection. Further details are given in specific methods for each experiment.
5.1 P
ARTICIPANTS
Fifty-eight MS patients were recruited by a neurologist (JJC) at Hospital de Braga. Seventy-one healthy controls without ties of consanguinity, age and gender matched, were selected from the local community. The inclusion criteria for the MS group were: age between 18 and 45 years old, relapsing-remitting course, early stages of disease severity as measured by the EDSS ≤3 (Kurtzke, 1983), and normal or corrected to normal visual acuity. Exclusion criteria for the MS group were: ongoing relapse/relapse in the previous month, clinical diagnosis of cognitive impairment, history of traumatic brain injury or stroke, clinical diagnosis of depression and clinically visible oculomotor deficits (e.g., nystagmus or
clinically apparent). Controls were subject to equivalent exclusion criteria. The study was reviewed by the ethics committee for Life Sciences and Health of the University of Minho. All participants were thoroughly informed about all the study procedures and gave volunteer informed consent.
- 21 -
5.2 E
QUIPMENT
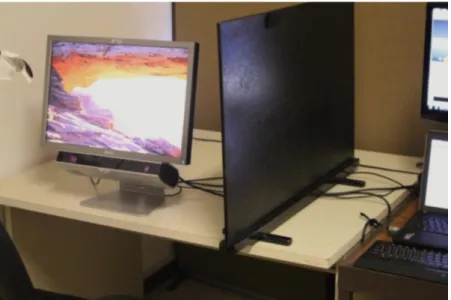
Eye movements were monitored using a binocular eyetracker running at 250Hz (RED250, SMIGmb Germany) illustrate in Figure 7. The eyetracker has a spatial resolution<0.4°, is controlled with iView X software (v2.8, August 2011, SMIGmb
Germany) and stimuli were presented on a 22inch LCD monitor (Dell P2210). A system is formed of two computers connected by a high speed Ethernet. A computer controlled the eyetracker and a second computer controlled the stimulus presentation. A Matlab SDK provided by SMI and elements of the Psychophysics toolbox developed by Brainard and Pelli (Brainard, 1997; Pelli, 1997) was used for running the experiment. Code for data analysis was also written in Matlab (Mathwork Inc). A standard 9 points calibration was used, after calibration a validation was performed. Only calibrations with a mean vertical and/or horizontal deviation less than 1 degree during the validation process were accepted.
Figure 7: Setup of the system consists of 2 computers used to perform eye movement tasks. On the left side, the monitor coupled to the eyetracker is connected to SMI computer and on the right side a PC that controlled the stimulus presentation.
5.3 C
OLLECT ROOM CONDITIONS
Experiments were performed in a dimly light room. Participants were seated 70cm away from the monitor with the head supported by a headband attached to the seat to minimize head movements as is represented in Figure 8.
- 22 -
Figure 8: Illustration of collecting data conditions showing the head support with a distance of 70cm from the monitor.
5.4 S
ACCADES DETECTION
Computations were based in recordings from one eye. Gaze position for both eyes was averaged during the recording, the iViewX algorithm provides a mean value equivalent for both eyes (same speed and amplitude) when the “Average Left Right Channel” is checked – default option of the eye tracker. Trials with blinks were discarded. For trials analysed, saccade detection was performed after smoothing xy positions with a 5 sample moving average centred in each individual sample. This method has been proposed by others to reduce noise (Engbert & Kliegl, 2003). After smoothing, eye velocity and acceleration was computed. To avoid catch noise and microsaccades from output of eye movements recording was implemented in experiments of saccades for both 5 and 10 degrees of eccentricity a detection criterion using the velocity threshold of 30 deg/sec, an acceleration threshold of 8500 deg/sec2 and the minimum duration of 12msec.
- 23 -
6TH CHAPTER:
ENDOGENOUS
SACCADES AND
FATIGUE
This chapter describes specific procedures and results from one experiment measuring endogenous generated saccades. Saccade parameters were also compared with functional tests such as the Fatigue Severity Scale (FSS) and the Modified Fatigue Impact Scale (MFIS).
6.1 N
EUROPSYCHOLOGICAL INVENTORIES
Depression was assessed with Beck Depression Inventory (BDI). BDI consists in a series of questions developed to measure the intensity, severity and depth of depressive symptoms. It is composed of 21 questions, each with four possible responses. Each response is assigned a score ranging from zero (not a problem) to three (serious problem). The sum of all BDI item scores indicates the severity of depressive symptoms with higher scores
representing higher severity (Beck, Steer, & Carbin, 1988).
Fatigue severity was assessed with the FSS what was designed to assess the functional intensity of fatigue and its correlation with functional disability. The FSS, which consists of 9 questions, uses a 7 point Likert scale ranging from strongly disagree to strongly agree (L. B.
- 24 -
Krupp, LaRocca, Muir-Nash, & Steinberg, 1989). In the FSS, higher scores represent higher fatigue intensity.
The impact of fatigue in daily living was assessed through the MFIS that is the
modified version of the 40-item Fatigue Impact Scale (FIS). Patients rate the extent to which fatigue has affected their life in the past 4 weeks on a questionnaire consisting of 10
“physical” items, 10 “cognitive” items, and 20 “social” items, with 0 indicating “no problem” and 4 indicating “extreme problem” (Kos et al., 2005)(Portuguese validated versions by Luciana Gomes, 2013). Again, higher scores represent higher fatigue impact.
All three inventories have normative data for the Portuguese population, results from the MS group were compared with the normative values and these tests were not applied to controls.
6.2 P
ROCEDURE FOR ENDOGENOUS SACCADES PARADIGM
Saccades were performed to 10deg to the left or to the right of the fixation target using an endogenous paradigm. The paradigm shown in Figure 9 consisted in 3 steps. In step 1 subjects had to fixate a centrally located target (cross), in step 2 the cross was replaced by a left or right pointing arrow and in step 3, subjects were presented with a peripheral target (cross) appearing at 10deg to the left or the right of the fixation target (in a random way). Trials were defined as “valid” if the arrow in step 2 was pointing to the same direction of the target appearance and “invalid” if the arrow was pointing to the direction opposite of the target. We used this paradigm to improve the precision of the latency measured and to minimize induced experimental fatigue. Before the first trial, participants were instructed to fixate the centre of the monitor and look as quickly as possible to the target (30x30mm cross) after the disappearance of the arrow. A block of 8 practice trials was performed before data collection, instructions were restated verbally and the behaviour during practice monitored to ensure that the task was well understood. Each subject performed 40 trials (20% invalid) and the duration of the task was approximately 3min.
- 25 -
Figure 9: Procedure of the saccadic paradigm and the variables analysed. On the left hand side is represented the paradigm. In the beginning of each trial, in step 1 a central fixation cross was visible for 850ms followed by step 2 in which an arrow visible for 500msec pointed to an unpredictable direction and finally in step 3 the target appeared to the right or left side. The graph on the right side represents the output of “valid” trials amplitude vs time; the horizontal dashed arrow represents latency and the vertical continuous arrow represents amplitude.
6.3 S
ACCADIC VARIABLES ANALYSED
Saccadic variables analysed were latency, peak velocity and amplitude. Latency
represents the time from stimulus appearance until the reaction of the eye moving towards the target. Amplitude was measured as the distance in degrees from the central position to the final eye position in the horizontal plane. Both amplitude and latency are represented on the right-hand side of Figure 9.
6.4 T
RIAL
-
BY
-
TRIAL ANALYSIS
To a diagrammatic representation of the data analysis of trials a decision algorithm was implemented as illustrated in Figure 10. First saccades (detected after the target was visible, step3 in Figure 9) with amplitude less than 0.6deg were ignored and the next saccade in the same trial was analysed (considered as first saccade). Trials were excluded if they meet any of the criteria: i) the starting point was outside a 200x200px fixation box in the centre of the screen, or ii) the amplitude of the first saccade was less than 2deg or iii) the latency was above 799msec (delayed saccades) or below 100msec (anticipatory saccades).
- 26 -
Figure 10: Decision algorithm for analysis of trials in the saccadic paradigm. The decision process in each trial starts to identify the amplitude of the first saccade to select the real saccade, which corresponds to the first saccade that was not excluded until the trial ends.
6.5 P
ARTICIPANTS EXCLUDED AFTER DATA COLLECTION
The mean number of analysed trials for the 129 participants in the sample was
computed and the minimum number of trials (mean-1standard deviation) per participant was 9. Participants with less than 9 good trials were excluded from further analysis. In total, after data collection, 12 participants with MS and 18 participants from the control group were excluded due to the application of these criteria, resulting 46 participants with MS and 53 healthy controls. From the 46 participants with MS, 6 showed BDI scores above the normative values were considered clinically depressed and excluded from groups comparisons.
- 27 -
6.6 S
TATISTICAL ANALYSIS
Presence of a normal distribution was tested with the Kolmogorov-Smirnoff test. Differences between groups were tested for an alpha value of 0.05 with t-test for independent samples, when the variable was normally distributed, and with non-parametric
Mann-Whitney U test when it was not. Scores for severity and impact of fatigue were correlated with latency, peak velocity and amplitude and the results analysed with Pearson’s correlation test.
6.7 R
ESULTS OF SACCADES PARADIGM
The final sample was made of 40 participants with MS and 53 controls. FSS scores were used to define two subgroups, the MS fatigue group (FSS score outside normal range) and the MS non-fatigue. As defined in procedure of saccades paradigm (section 6.2) were used “valid” and “invalid” trials, however saccade results presented here are from valid trials only. Demographic characteristics and mean values for depression symptoms (BDI score) and fatigue severity and impact (FIS and MFIS, respectively) are summarized in Table 1.
6.7.1 Neuropsychological results
According to the reference norms for the Portuguese population (Gomes, 2011) subjects were considered fatigued if they had a score higher than 1SD above the mean of the reference population, corresponding to 42 in the FSS and 37 in the MFIS. In total 13 (32.5%) participants scored a level of fatigue outside the normal range (in the FSS) and 17 (42.5%) reported a significant impact of fatigue in their daily living (in the MFIS). Demographic, clinical and neuropsychological information is summarized in Table 1. No subject had a clinically significant score on the BDI because those with clinical depression were excluded from analysis.
- 28 -
Table 1: Summary of the demographic, clinical, fatigue and depression information of the final sample of participants for three groups (SD = standard deviation)
Variable Group MS Fatigue (n=13) MS Non-Fatigue (n=22) Controls (n=53)
Gender [n] 7 females (54%) 13 females (59%) 26 females (49%)
Age [mean(SD)] 39 (6) 34 (7) 33 (8)
Months since diagnosis
[mean(SD)] 88 (55) 83 (60) --
FSS Total [mean(SD)] 57 (7) 28 (10) --
MFIS Total [mean(SD)] 48 (13) 19 (15) --
BDI Total [mean(SD)] 11 (4) 5 (4) --
6.7.2 Saccades results
Results for the saccade latency are summarized in Figure 11. Only results of “valid” trials are shown. The mean latency was 266msec (SD=61) in MS fatigue group, 225msec (SD=26) in MS non-fatigue group and 228msec (SD=35) in the control group. Latency in MS fatigue group was significantly different from the MS non-fatigue, mean difference 41msec (t(15)=-2.32, p=0.035), and control, mean difference 38msec (t(14)=2.17, p=0.048), groups.
Figure 11: Saccade latency for the 3 groups of participants: MS fatigue, MS non-fatigue and control group. Bars show the mean value and error bars represent 1 standard deviation
- 29 -
Results for the saccade peak velocity are summarized in Figure 12. The median peak-velocity was 307deg/sec (IQR=96) in MS fatigue group, 320deg/sec (IQR=70) in the MS non-fatigue group and 327deg/sec (IQR=76) in the control group. The mean difference between the MS fatigue group and the control group was 52deg/sec (Mann-Whitney U test =-2.0, p=0.041).
The median amplitude was 8.7º (IQR=1.2) in MS fatigue group, 9.0º (IQR=1.5) in MS non-fatigue group and 8.6º (IQR=0.9) in the control group. Differences in amplitude between groups were not statistically significant.
6.7.3 Correlations between fatigue and saccades results
Graphs of correlations found are illustrated in Appendix 6. Fatigue magnitude (FSS score) was correlated negatively with peak velocity, 0.4(p=.009) and amplitude, r=-0.5(p=.005) and positively correlated with latency, r=0.4(p=.019). Impact of fatigue (MFIS score) was correlated negatively with the amplitude, r=-0.3(p=.037), but not with peak velocity or latency.
Figure 12: Saccade peak velocity for the three groups of participants: MS fatigue, MS non-fatigue and control group. Box contains the 25-75 percentile and the whiskers show the 95% confidence interval
- 30 -
7TH CHAPTER:
ANTISACCADES AND
NEUROCOGNITIVE
PERFORMANCE
This chapter describes specific methods and the results of one experiment measuring anti-saccades. Results about cognitive status and correlations between cognitive and anti-saccades parameters are also reported.
7.1 N
EUROPSYCHOLOGICAL TESTS
Psychological dimension was evaluated with a battery of 6 tests: 1) Montreal
Cognitive Assessment (MOCA), 2) Digit Span (WAIS-III: Wechsler Adult Intelligence Scale - Version III), 3) Symbol Digit Modalities Test (SDMT), 4) Twenty Questions Test (D-KEFS: Delis-Kaplan Executive Function System), 5) Stroop Colour and Word Test and 6) Beck Depression Inventory (the same as presented in section 6.1).
General cognitive functioning was assessed through MOCA, which is a test that provides information about general cognitive functioning evaluating: executive functions, visuospatial ability, working memory and attention (Hajek, Gagnon, & Ruderman, 1997). MOCA score corresponds to the sum of correct responses in each dimension, 1 point for
- 31 -
correct items and 0 for wrong items. The test score ranges from 0 to 30, higher scores correspond to better general cognitive functioning (Appendix 1) (Freitas, Simões, Martins, Vilar, & Santana, 2010; Nasreddine et al., 2005).
The subset of the WAIS-III used was the Digit Span that consists in the repetition of a digit sequence. This test is expected to provide a measure of attention, when the sequence is verbalized in direct order, or working memory, when numbers are verbalized in inverse order (Seabra-Santos et al., 2003; Wechsler, 1997). To this subtest is attributed a maximum of 16 points per correct answer in direct order sequences and 14 points in inverse order sequences. The final classification is the sum of all points obtained in both sequence orders. Then the total points attributed are converted to a scaled score that range from 1 to 19. Higher scores represent better levels of attention and working memory (Appendix 2).
SDMT was used to provide a measure of cognitive processing speed. In this test subjects are presented with a key that includes 9 numbers, each one paired with a different symbol. Below the key is an array of these same symbols in a pseudorandom order paired with empty spaces. Subjects must then provide the correct numbers that accompany the symbols as indicated in the key. The number of correct paired symbols corresponds to the total score. Higher scores correspond to better performance (Appendix 3) (da Costa Pinto, 2004).
Twenty Questions Test (D-KEFS) consists in the identification of 30 targets (common objects). During testing, subjects are allowed to enquire the experimenter about the
characteristics of the target and the experimenter is only allowed to answer yes or no. This test is used to assess assertiveness of decision-making processes and evaluates cognitive dimensions such as categorical processing, abstraction and mental flexibility. The number of questions to correctly identify a target is counted, smaller number of questions correspond to higher scores that correspond to better performance (Appendix 4) (Delis, Kramer, Kaplan, & Holdnack, 2004).
The Stroop Color and Word Test is based on the observation that individuals can read words much faster than they can identify and name colors. This test evaluates the inhibitory control (also seem as a measure of interference), cognitive flexibility, executive function and tolerance to frustration. The final score of colour and word test corresponds to the number of color correctly nominated in 45 seconds, the maximum score is 100 (Appendix 5) (Castro, Cunha, & Martins, 2009; Golden, 1975).
- 32 -
All inventories have normative data for the Portuguese population and results from the MS group were compared with the normative values (table 2) therefore these tests were not applied to controls.
7.2 P
ROCEDURE DURING THE ANTISACCADE PARADIGM
The paradigm shown in Figure 13-A consisted in 2 steps. In step 1 subjects had to fixate a cross presented at the centre of the screen during a variable interval of 1250 or 1600ms assigned in a random order. After the interval defined for step 1 a peripheral target appeared 5 or 10 degrees to the right or left side also assigned in random order, the target remained visible for 1500ms. Before data collection and during practice trials subjects were clearly instructed to look to the empty side of the screen to a position equivalent to where the target was visible (anti-saccade). They were also instructed to perform this movement as quickly as possible.
A block of 8 practice trials was performed before data collection, instructions were restated verbally and the behaviour during practice monitored to ensure that the task was well understood. Each subject performed 40 trials and the duration of the task was approximately 3min.
A B
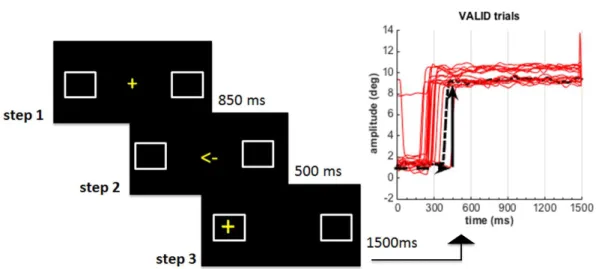
Figure 13: The anti-saccade task. A- Procedure for the anti-saccade paradigm, in step 1 a central fixation cross was visible for 1250 or 1600ms followed by step 2 in which the target was shown (the grey arrow points the direction of the eye movements expected, anti-saccade). B - Representation of changes in eye movement amplitude with time during a typical block. In this analysis anti-saccades were performed to the left when the target was presented at 10deg from the central fixation target on right side of the screen. The pink line shows a trial in which a corrective-saccade was performed and the purple line shows a correct anti-saccade.
- 33 -
7.3 A
NTI
-
SACCADES PARAMETERS ANALYSED
Anti-saccade parameters analysed were latencies of: correct anti-saccades, pro-saccades and corrective-pro-saccades. The percentage of directional errors and spatial accuracy was also computed. Latency of an anti-saccade shown in Figure 13-B represents the amount of time necessary to the eyes to initiate a saccade after the target was presented in the screen. If the first saccade was made towards the target the movement is defined as a pro-saccade and corresponds to an error. When, after a pro-saccade, participants made a further saccade away from the target, the latency of a corrective-saccade was also defined.
Spatial accuracy was computed in a variable called gain. Gain of the final eye position (Gf) is the ratio between the final eye position in degrees (EPfin) and the absolute amplitude required by the stimulus position in degrees (SP):
Gf=EPfin/SP
Hypometric anti-saccades correspond to Gf below 1 and hypermetric to Gf above 1.
Absolute position error (APerror) was used to quantify the magnitude of the error and is given by:
APerror = |(EPfin-SP)/SP| × 100
Here spatial precision is not indicative of the direction of the error (Heitger et al., 2004). Amplitude are also represented in Figure 13-B.
7.4 T
RIAL
-
BY
-
TRIAL ANALYSIS
Figure 14 shows the trial-by-trial algorithm used for data analysis. First saccades, detected immediately after the appearance of the target, see Figure 13-B for a representation of saccades, with the amplitude less than 0.6 deg were ignored and the next saccade in the same trial was analysed and treated as first saccade. Trials were excluded if: i) the starting point was outside a 200x200px fixation box in the centre of the screen, ii) trials in which the amplitude of the first saccade was less than 2deg and iii) trials with latency above 799msec (delayed saccades) or below 100msec (anticipatory saccades).
- 34 -
Corrective-saccades were considered when a saccadic eye movement was performed after a pro-saccade and if its amplitude was equal or higher that 2 degrees and performed in a direction contrary to the target.
Figure 14: Decision algorithm for analysis of trials in the anti-saccadic paradigm. The decision process in each trial starts to identify the amplitude of the first saccade to select the real saccade or the pro-saccade and follow corrective-saccade depending to the direction of the first saccade that was not excluded before the trial ends.
7.5 P
ARTICIPANTS EXCLUDED AFTER DATA COLLECTION
The mean number of non-excluded trials (valid) per participant for 129 participants from both groups was computed. Participants with a number of trials outside the mean ± 1 standard deviation were excluded, the minimum number of trials required was14. After data collection 10 participants from the MS group and 19 participants from the control group were excluded. From the 48 participants in the MS group, 8 presented BDI scores indicative of clinical depression and were also excluded from group comparisons.
- 35 -
7.6 S
TATISTICAL ANALYSIS
Variables were tested for normality using Kolmogorov-Smirnov test. For variables normally distributed t-test for independent samples was used to compare groups, if not normally distributed a non-parametric Mann-Whitney U test was used. Scores of
psychological tests were compared with anti-saccades results using Pearson’s correlation test. All differences tested were considered significant for alpha value of 0.05 or less.
7.7 R
ESULTS OF ANTI
-
SACCADES PARADIGM
The final sample was made of 40 participants with MS and 52 controls.
7.7.1 Neuropsychological results
Demographic characteristics are summarized in Table 2.
Table 2: Summary of the demographic and clinical information of the final sample of participants for both groups (SD = standard deviation)
Mean values the psychological tests MOCA, Digit Span (WAIS-III), SDMT, Twenty Questions (D-KEFS), Stroop and BDI are in Table 3.
Variable Group
MS group (n=40)
Controls (n=52)
Gender – n (%) 26 females (65%) 30 females (58%)
Age – mean (SD) 37 (7) 33 (8)
- 36 -
Table 3: Summary of the psychological evaluation results of the final sample of MS patients and normalized data for the Portuguese population (SD = standard deviation)
Variable Group
MS group (n=40)
Normative
data* p-value MOCA Total - mean(SD) 24.1 (2.6) 26.4 (2.2) 0.000
Digit Span (WAIS-III) – mean(SD) 9.8 (2.2) 10 (3) 0.56
SDMT Women- mean(SD) 51.2 (8.2) 51.1 (10.7) 60 (10.1) 65.9 (12.2) 0.000 0.000 SDMT Men – mean(SD)
Abstraction (D-KEFS) - mean(SD) 8.54 (1.7) 10.5 (3.2)
10 (3) 10 (3)
0.000 0.35
Questions (D-KEFS) - mean(SD)
Stroop Test - mean(SD) 43.1 (9.0) 50 (10) 0.000
BDI – mean (SD) 6.8 (4.7) 13.9 (4.2) 0.000
7.7.2 Anti-saccade results
The mean proportion of directional errors was 26% (SD=18) for the MS group and 16% (SD=11) for the control group. The difference in the number of errors between the MS group and the control group was statistically significant with a mean difference of 10%, t(60)=3.14, p=0.03. Figure 15-A shows the latency for correct anti-saccades. Latency for the MS group was 323msec (IQR=82) and 280ms (IQR=71) for the control group, difference between median values 43ms, Z=-2.96, (p=0.003). The median prosaccade latency for the MS group was 208ms (IQR=46) and 206ms (IQR=33) for the control group, median
difference 2ms (n.s.). Figure 15-B shows results for corrective-saccade latencies. The mean corrective saccade latency for the MS group was 152ms (SD=45) and 128ms (SD=47) for the control group, mean difference 24ms, t(87)=2.4, p=0.017.