Flashing LEDs for microalgal production 1
Peter S.C. Schulze1,2, Rui Guerra3,Hugo Pereira2, Lisa M. Schüler2 and João C.S. Varela2* 2
3
1Faculty of Biosciences and Aquaculture, Nord University, 8049 Bodø, Norway 4
2Centre of Marine Sciences, University of Algarve, Campus de Gambelas, 8005-139 Faro, 5
Portugal 6
3Centro de Electrónica, Optoelectrónica e Telecomunicações, University of Algarve, Campus 7
de Gambelas, 8005-139 Faro, Portugal. 8
9
* Corresponding author. Tel.: +351-289800051. Email address: [email protected] (J. Varela). 10
Key words: Linear electron transfer chain; pulsed artificial light; light attenuation, 11
photosynthesis; microalgae; non-photochemical quenching. 12
Abstract 13
Flashing lights are next-generation tools to mitigate light attenuation and increase the 14
photosynthetic efficiency of microalgal cultivation systems illuminated by light emitting diodes 15
(LEDs). Optimal flashing light conditions depend on the reaction kinetics and properties of the 16
linear electron transfer chain, energy dissipation and storage mechanisms of a phototroph. In 17
particular, extreme short and intense light flashes potentially mitigate light attenuation in 18
photobioreactors without impairing photosynthesis. Intelligently controlling flashing light units 19
and selecting electronic components can maximise light emission and energy efficiency. We 20
discuss the biological, physical and technical properties of flashing luminaries for algal 21
production. We combine recent findings about photosynthetic pathways, self-shading in 22
photobioreactors and developments in solid-state technology towards the biotechnological 23
application of LEDs to microalgal production. 24
1. Artificial light in microalgal production
25Microalgae are a promising biological resource for the mass production of lipids, sugars, 26
polymers or proteins for the food, feed and chemical industries [1]. The co-production of high- 27
value biomolecules such as polyunsaturated fatty acids, carotenoids, beta-glucans and 28
phycobiliproteins for nutraceutical, pharmaceutical and biomedical applications increases the 29
value of microalgal biomass and the economic feasibility of microalgae-based biorefineries [2]. 30
Presently, high production costs of 5-25 € Kg-1 hinders the economic feasibility of microalgal-31
based commodities [3, 4]. The European Commission supports research and development of 32
microalgal biotechnology by allocating between 2007 and 2017 ca. 40 million € annually to 33
microalgae-based ventures. For photo- and mixotrophic (see Glossary Box for definitions) 34
microalgal cultivation, light is one of the most important growth parameters; it can come from 35
natural (sun) or artificial (lamps) sources [4, 5]. Although artificial light costs more than 36
sunlight, it allows tight control of microalgal biochemistry and growth, increasing the reliability 37
of industrial processes for the production of high value biomolecules [4, 5]. 38
However, the competitiveness of any artificial light-driven microalgal production hinges 39
on energy consumption. A decrease of energy costs requires improvements in photon harvesting 40
by microalgae and the photon conversion efficiency of light sources. Better light energy usage 41
by phototrophs can be achieved by tailoring species-specific emission spectra of artificial light 42
sources [5, 6]. Another strategy concerns not the light quality, but rather light delivery. Instead 43
of using continuous illumination, recent studies propose using flashing lights (Fig. 1). Flashing 44
light is intermittent light that can provide highly intense light flashes with a short duration 45
(hereafter called light flash period or tl) alternating with extended dark periods (td). One flash 46
period followed by a dark period can be defined as a flashing cycle (tc, in which tc = tl + td). The 47
use of high light flash intensities (Il) enables light to penetrate deeper into the culture and 48
mitigate light attenuation [7-9] in photobioreactors, maintaining a high photosynthetic 49
efficiency of concentrated cultures [10, 11]. To prevent photo-damage and inhibition of the 50
phototroph under cultivation by too intense light flashes, the repetition rate of the light-dark 51
transition (i.e., flashing light frequency, f) and the relative proportion of the light flash period 52
(i.e., the duty cycle, ø) within the flashing cycle should be adjusted to the biological reaction 53
kinetics of photosynthetic processes and energy dissipation mechanisms (also often referred to 54
as non-photochemical quenching or simply NPQ). Nonetheless, well-engineered luminaries are 55
essential to emit efficiently flashing light regimes that are advantageous for phototrophic 56
cultivation [4, 12]. Balancing these factors, flashing light can result into higher growth 57
performance per input energy as if the same light energy is supplied in a continuous way [4, 58
12]. We discuss the techno-biological threshold for an efficient flashing light system in terms 59
of (i) biological, (ii) physical and (iii) technical factors that are crucial for applying this 60
promising tool to microalgal cultivation. 61
62
63
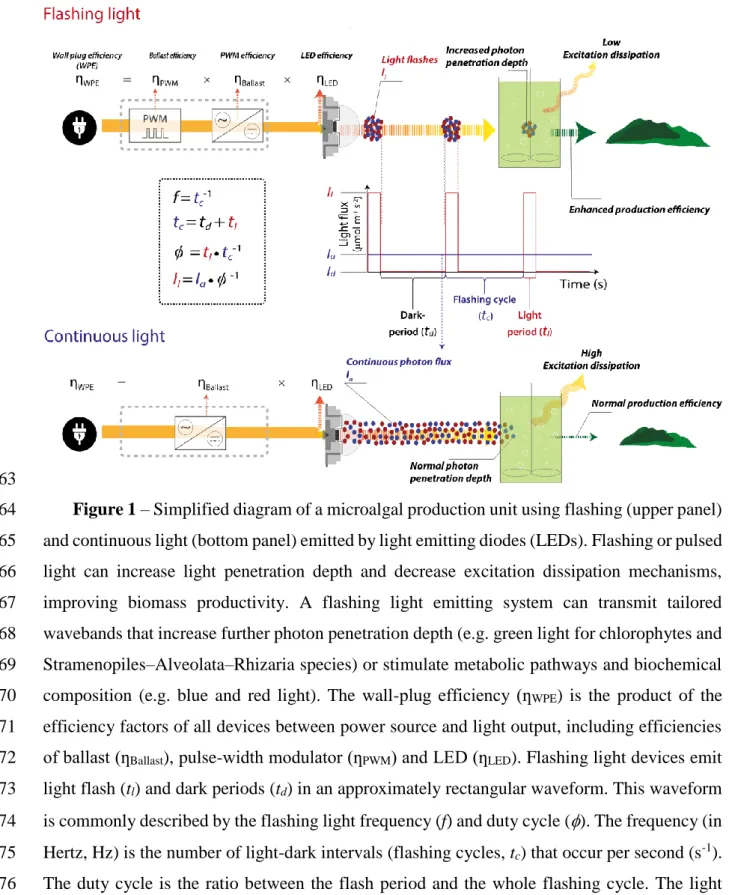
Figure 1 – Simplified diagram of a microalgal production unit using flashing (upper panel) 64
and continuous light (bottom panel) emitted by light emitting diodes (LEDs). Flashing or pulsed 65
light can increase light penetration depth and decrease excitation dissipation mechanisms, 66
improving biomass productivity. A flashing light emitting system can transmit tailored 67
wavebands that increase further photon penetration depth (e.g. green light for chlorophytes and 68
Stramenopiles–Alveolata–Rhizaria species) or stimulate metabolic pathways and biochemical 69
composition (e.g. blue and red light). The wall-plug efficiency (ƞWPE) is the product of the 70
efficiency factors of all devices between power source and light output, including efficiencies 71
of ballast (ƞBallast), pulse-width modulator (ƞPWM) and LED (ƞLED). Flashing light devices emit 72
light flash (tl) and dark periods (td) in an approximately rectangular waveform. This waveform 73
is commonly described by the flashing light frequency (f) and duty cycle (). The frequency (in 74
Hertz, Hz) is the number of light-dark intervals (flashing cycles, tc) that occur per second (s-1). 75
The duty cycle is the ratio between the flash period and the whole flashing cycle. The light 76
intensity (in µmol photons m-2 s-1) during tl is defined as flash intensity (Il), while during td no 77
light is emitted (e.g., Id = 0 µmol photons m-2 s-1). Under this condition, the time-averaged light 78
intensity (Ia) during one flashing cycle can be expressed as 𝐼𝑎 = ø × 𝐼𝑙 and is used to compare 79
flashing with continuous light treatments. Moreover, the flash intensity and the duty cycle are 80
inversely proportional at a given averaged light intensity. 81
2. Biological boundaries
83Microalgal cultures can display similar or higher photosynthetic rates under flashing light than 84
under continuous light at the same averaged light intensity. This is referred to as “flashing light 85
effect” [13, 14] or “light integration effect” [15] and occurs if the photosynthetic apparatus is 86
working close to its full capacity (biological factor). However, in cultures with light attenuation, 87
the flashing light effect can additionally be achieved by enhanced light delivery into the culture 88
(physical factor), even though the photosynthetic apparatus is working at rates that are far lower 89
than its full capacity. In this section, we define the flashing light conditions (e.g. frequency or 90
duty cycle) at which the photosynthetic apparatus perceives a flashing light effect as a biological 91
boundary. Generally, the flashing light effect refers to the response of a phototroph to time-92
averaged light intensity (Ia) during the flashing cycle, and not to the instantaneous light intensity 93
of the light (Il) or dark (Id) periods (Fig. 1). When exposed to too low frequencies (e.g. f = 1-94
10 Hz) with too low duty cycles (e.g., ø > 0.5), no flashing light effect takes place and 95
phototrophs quench excess energy during the light period, and might experience enhanced 96
respiration during the dark period (e.g., post-illumination respiration; [13, 15, 16]). This results 97
in less growth and biomass losses. Moreover, molecular responses to stress in the phototroph 98
under cultivation can also be activated. 99
The biological boundary depends on reaction kinetics of energy dissipation mechanisms, 100
energy storage and the linear electron transfer chain (see Box 1). Flashing light studies on single 101
leaves of land plants or microalgal cultures with low light attenuation potential can identify the 102
biological boundary, and may be described as a function of frequency (f) and duty cycle (ø), 103
i.e. f(ø,f) [17, 18]. For example, Jishi et al. [17] identified such function of the flashing light 104
effect for lettuce (Lactuca sativa). Interestingly, their model also fits the photosynthetic 105
performances of microalgal cultures with low biomass concentrations (< 0.1 g L-1) or short light 106
path lengths (<1-2 cm) and for land plants (e.g. tomato) under various flashing light conditions 107
[19-27]. 108
2.1. Excitation dissipation and energy storage efficiencies
109Absorbed light energy is able to bring chlorophyll from its ground state (Chl) to a singlet 110
excited state (1Chl*). 1Chl* can pass its excitation energy via resonance or excitation energy 111
transfer to adjacent chlorophyll molecules in the light harvesting complexes or the reaction 112
centres of photosystem I or II (PSI or PSII). In the reaction centres, charge separation takes 113
place and excitons can be photochemically quenched by provoking the transfer of electrons to 114
the photosynthetic linear or cyclic electron transfer chains [28]. These photosynthetic pathways 115
are essential for the production of adenosine triphosphate (ATP) and reducing equivalents such 116
as plastoquinol and nicotinamide adenine dinucleotide phosphate (NADPH; [28]). If the 117
reaction centres are “closed”, i.e. if they are not able to process photon excess under high light 118
conditions, 1Chl* can dissipate absorbed energy as heat through excitation dissipation 119
mechanisms or re-emit a photon (fluorescence) when falling back to its ground state (Chl). Both 120
processes prevent the formation of triplet Chl (3Chl*), which causes reactive oxygen species 121
(ROS) evolution [28]. If, for example, the storage capacity for reducing equivalents cannot cope 122
with the excess electrons under high light, the likelihood of ROS accumulation increases. Such 123
high ROS levels suppress protein synthesis, which is essential for repairing PSII upon 124
photodamage [29]. To avoid excess ROS evolution during high light (flash) periods and 125
maintain their metabolism during prolonged dark periods, phototrophs employ different energy 126
quenching and storage strategies under flashing light with a low duty cycle (e.g., ø < 0.1; Fig. 2; 127
[14, 16, 30, 31]). Usually, alternation between light and dark periods longer than seconds, 128
minutes or hours (implying frequencies < 1 Hz) are referred to light that is supplied 129
intermittently, discontinuously or through light/dark cycles or photoperiods. For the sake of 130
convenience, however, the term “flashing light” and associated parameters will be used in all 131
time scales. 132
In this context, mechanisms of short-term energy storage (fs-ps time scale) follow the laws 133
of quantum dynamics and energy transport takes place via quantum coherence. The excitation 134
energy delivered by fs-ps lasting high light flashes can be stored in pigment cofactors (e.g. 135
chlorophylls, carotenoids or phylloquinones) as excitons or through inter-protein hopping 136
within the light harvesting complexes [32]. If reaction time permits, energy may be stored in 137
reaction centre II. In this time scale, excess energy may be dissipated through ultrafast reacting 138
quenchers (e.g. chlorophyll a; [32, 33]), resulting in pigment internal thermal decay or 139
fluorescence. 140
141
Figure 2 - Response time scales of phototrophs exposed to different flash period durations 142
(tl) with a high intense flash intensity (Il) that arise if flashing light composed of a short constant 143
duty cycle (e.g., ø < 0.1) and a saturating averaged light intensity (Ia) is used. A given flash 144
period duration is inversed proportional to the flashing light frequency (f). Time scales of events 145
were obtained from results summarised in Tables 1 and S1 and elsewhere [33, 34, 37]. Bar 146
length represents the approximate time scale of the initiation of a given event. Abbreviations: 147
CET, Cyclic Electron Transfer; Chl, Chlorophyll; Dd-Dt, diadinoxanthin-diatoxanthin; FDPs, 148
flavodiiron proteins; LET, linear electron transfer chain; LHC, light harvesting complex; LHP, 149
light harvesting pigment; Lx-L, lutein epoxide; PGR5, proton gradient regulator 5; PGRL1, a 150
ferredoxin-plastoquinone reductase that is apparently involved in CET in chlorophytes; PQ, 151
plastoquinone; PQH2, plastoquinol; PS, photosystem; Q1/2, quenching sites 1 and 2; qE, energy 152
state quenching; qI, photoinactivation of photosystem II; RC, reaction centre; RuBisCO, 153
ribulose-1,5-bisphosphate-carboxylase/oxygenase; STN7, Serine/threonine-protein kinase 154
involved in the adaptation to changing light conditions; VAZ, violaxanthin-astaxanthin-155
zeaxanthin. 156
157
A medium-term energy storage (ns-µs time scale) may take place via components and 158
products of the non-cyclic photosynthetic electron transfer chain. Examples are the 159
plastoquinone bound to PSII (Qa-), plastoquinol (PQH2) in the plastoquinone (PQ) pool [34], 160
protons in the stroma coming from the water-splitting reaction catalysed by the water oxidising 161
complex and ATP produced by the ATP synthase in the thylakoid [35]. However, if the previous 162
storage mechanisms are unable to handle excess energy, other non-photochemically quenching 163
reactions and biomolecules seem to play a protective role: e.g. Mehler-like reactions, the 164
proton gradient regulator PGR5, the ferredoxin-plastoquinone reductase PGRL1, the 165
serine/threonine-protein kinase STN7, and several flavodiiron proteins [8, 36-38]. 166
For long-term energy storage (ms-s time scale), phototrophs produce reduced equivalents 167
(e.g. NADPH) or “high energy” chemical bonds via ATP-dependent nitrogen and sulphur 168
assimilation as well as carbon fixation. The last process yields Calvin-Benson cycle 169
intermediates containing ATP-dependent high energy bonds, such as bisphosphoglycerate or 170
triose-phosphate [30]. At this time scale, excess energy can be quenched via re-oxidation of the 171
PQ pool through the quinol terminal oxidase, phosphorescence or through the initiation of 172
diadinoxanthin-diatoxanthin, violaxanthin-astaxanthin-zeaxanthin or lutein epoxide cycles [39-173
41]. 174
Even longer-term energy storage is possible. Biochemical processes at time scales of 175
minutes and hours, such as the accumulation of non-structural low molecular weight sugars, 176
starch or amino acids (e.g. glutamine as the first amino acid resulting from nitrogen 177
assimilation) can be used to store energy [42]. Under these conditions, excess energy can be 178
quenched through the same photoprotective pigment cycles as under ms-s conditions, but also 179
through high-energy-state (qE) quenching and photoinactivation of PSII (here referred to as qI; 180
[33, 41, 43]). In order to decrease excess energy that phototrophs receive under long-lasting 181
light periods, reversible phosphorylation of the light harvesting complex II and decrease in the 182
light harvesting antenna size might occur [37, 39]. 183
Generally, the ratio between non-photochemically and photochemically quenched energy, 184
and the probability of damaging the photosystems by ROS evolution, due to a failure of the 185
excitation dissipation mechanisms in place, increases with light flash period duration, causing 186
a drop in photosynthetic efficiency. Under frequencies and duty cycles that are too low and too 187
short, respectively, for obtaining a biological flashing light effect, phototrophs use more 188
complex and energy demanding excitation dissipation mechanisms during the light period (e.g. 189
photoprotective pigment synthesis or high-energy-state quenching [33]) and respiration rates 190
exceed photosynthetic rates during the extended dark period [15, 44, 45]. Both situations will 191
ultimately decrease or restrict net photosynthetic efficiency [27] and alter the biochemical 192
profile and appearance of microalgal and cyanobacterial cells. Changes include cell size, 193
pigment composition, intracellular ultrastructure, expression of protective proteins (e.g. PGR5 194
or STN7), the ratio between PSI and PSII [8], light harvesting antenna size, ribulose-1,5-195
bisphosphate-carboxylase/oxygenase (RuBisCO) activity, or sugar and starch contents [8, 11, 196
30, 46-51]. These changes are typical for responses of microalgae to intense light [49, 50] and 197
thus can be used as indicators if the frequency and duty cycle are inadequate for a phototroph 198
to experience the biological flashing light effect. Conversely, if phototrophs are exposed to 199
increasing frequencies (e.g. f > 10 Hz; ø ≈ 0.1-0.5), these changes become less obvious [46-48, 200
52, 53], because a phototroph buffers and quenches photoenergy delivered during the light 201
period with a similar efficiency to that under continuous light. Nevertheless, lower intracellular 202
chlorophyll a and carotenoid contents are probably not good indicators for the flashing light 203
effect, as lower amounts of these pigments occur in several species under a wide range of 204
flashing light conditions (e.g. f = 0.1-100 Hz; Table 1; [44, 46-49]). 205
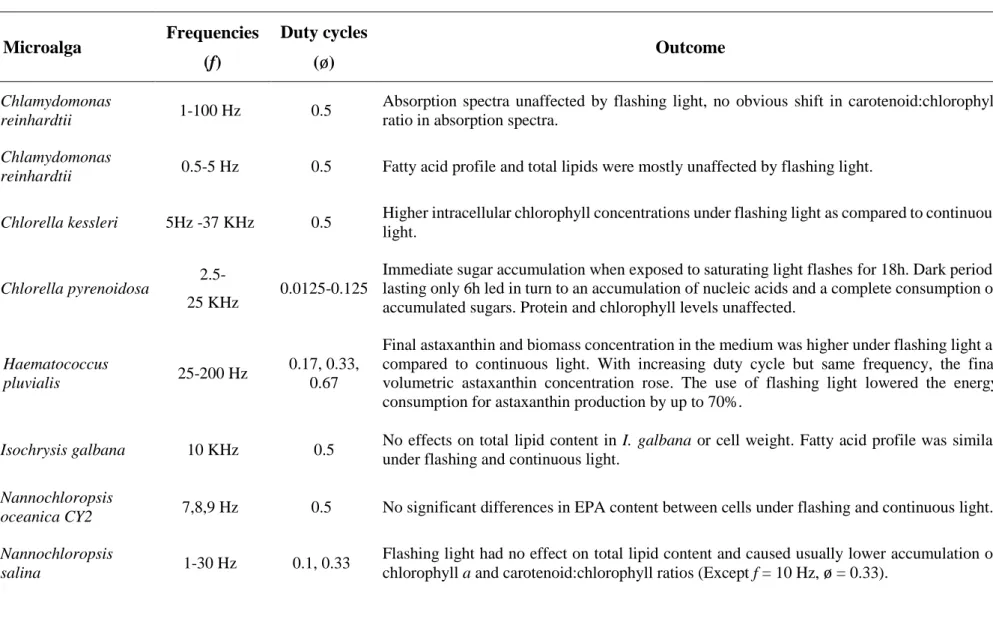
Table 1 - Impacts of flashing light with different duty cycles and frequencies on microalgal composition. Refer to Table S1 (supplementary data) for a detailed
207
overview of relevant flashing light studies on microalgae, cyanobacteria and plants.
208 Microalga Frequencies (f) Duty cycles (ø) Outcome Ref. Chlamydomonas reinhardtii 1-100 Hz 0.5
Absorption spectra unaffected by flashing light, no obvious shift in carotenoid:chlorophyll
ratio in absorption spectra. [20, 21]
Chlamydomonas
reinhardtii 0.5-5 Hz 0.5 Fatty acid profile and total lipids were mostly unaffected by flashing light. [54]
Chlorella kessleri 5Hz -37 KHz 0.5 Higher intracellular chlorophyll concentrations under flashing light as compared to continuous
light. [11]
Chlorella pyrenoidosa 2.5-
25 KHz 0.0125-0.125
Immediate sugar accumulation when exposed to saturating light flashes for 18h. Dark periods lasting only 6h led in turn to an accumulation of nucleic acids and a complete consumption of accumulated sugars. Protein and chlorophyll levels unaffected.
[24]
Haematococcus
pluvialis 25-200 Hz
0.17, 0.33, 0.67
Final astaxanthin and biomass concentration in the medium was higher under flashing light as compared to continuous light. With increasing duty cycle but same frequency, the final volumetric astaxanthin concentration rose. The use of flashing light lowered the energy consumption for astaxanthin production by up to 70%.
[55]
Isochrysis galbana 10 KHz 0.5 No effects on total lipid content in I. galbana or cell weight. Fatty acid profile was similar
under flashing and continuous light. [52]
Nannochloropsis
oceanica CY2 7,8,9 Hz 0.5 No significant differences in EPA content between cells under flashing and continuous light. [53]
Nannochloropsis
salina 1-30 Hz 0.1, 0.33
Flashing light had no effect on total lipid content and caused usually lower accumulation of
chlorophyll a and carotenoid:chlorophyll ratios (Except f = 10 Hz, ø = 0.33). [48]
Porphyridium
purpureum 0.17- 100 Hz 0.17, 0.5
The frequency of 0.17 Hz increased the intracellular phycoerythrin and chlorophyll a content as compared to continuous light and 25 Hz and ø = 0.33. Bound and free polysaccharides were affected marginally. Production rates of phycoerythrin and free polysaccharides were highest under f = 100 Hz, ø= 0.5 (Il = 540 µmol photons m-2 s-1).
[56]
Scenedesmus
bicellularis ~100 Hz 0.5
The long-term exposure to flashing light did not affect total lipids, proteins, carbohydrates, fatty acids and amino acids. However, flashing light lowered slightly chlorophyll a and b levels, increased chlorophyll a/b ratios, decreased carotenoid contents and increased carotenoid/chlorophyll a ratio. RuBisCO initial activity (not activated) and RuBisCO total activity (activated) were significant higher only under flashing light at a moderate irradiance of Ia = 175 µmol photons m-2 s-1, whereas low (Ia = 87.5 µmol photons m-2 s-1) and high
(Ia = 350 µmol photons m-2 s-1) averaged light intensities had no effect.
[47]
Scenedesmus obliquus 5, 10, 15 Hz 0.5 Carotenoid:chlorophyll ratio and chlorophyll a content in cells were lower under flashing light.
Carbohydrate, lipid, and protein contents were unaffected. [46]
Chlamydomonas
reinhardtii 0.00138-1 Hz 0.5
Decreasing chlorophyll a content with increasing frequency (Ia = 220 µmol photons m-2 s-1).
Lowest amount of chlorophyll a, b and carotenoids under f = 1 Hz. [44]
Dunaliella salina 0.017-5 Hz 0.4-0.66
Usually lower chlorophyll a content under flashing light (Ia = 400 µmol photons m-2 s-1) as
compared to continuous light. A f = 5 Hz showed similar results as compared to continuous light. D. salina exposed to flashing light conditions showed always lower total lipid content.
[50]
[26] Abbreviations: EPA, eicosapentaenoic acid; Ia, time averaged light intensity during a flashing cycle; Il, light flash intensity; RuBisCO, Ribulose-1,5-bisphosphate 210
carboxylase/oxygenase.
2.2. Limits of flashing light on the electron transfer chain
212Emerson and Arnold [57] demonstrated that a short light period with an adequate flash 213
intensity can excite all “open” reaction centres, whereas a sufficient long dark period allows all 214
reaction centres to “re-open” and harvest most of the incoming photons of the next light flash. 215
A later study by Radmer and Kok [58] quantified that a light harvesting complex containing 216
400 chlorophyll molecules harvest ~2,000 electrons per second under full sunlight, whereas the 217
subsequent carbon fixation reactions are able to process only 100-200 electrons per second. 218
They showed that the photosynthetic apparatus could only use a small portion of incident light 219
under continuous light, while, most of the time, reaction centres are closed and light is non-220
photochemically quenched. 221
Recent findings about excitation dissipation mechanisms and the quenching role of the PQ 222
pool may allow other approaches to determine the optimal flashing light settings required for 223
photosynthesis. It has been suggested that the species-dependent storage capacity of the PQ 224
pool for plastoquinol may define the threshold frequency, duty cycle and the required averaged 225
light intensity beyond which the flashing light effect occurs [26, 59]. Vejrazka and colleagues 226
[21] and Hüner et al. [34] pointed out that if excess plastoquinol is generated, the 227
plastoquinol:plastoquinone (PQH2:PQ) ratio becomes too high, leading to over-reduction of the 228
PQ pool, which will prevent the reaction centre II from re-opening [34]. Such over-reduction 229
occurs if transfer rates of photonic energy exceed the kinetics of its use by metabolic pathways 230
that promote growth, including those involved in nitrogen, sulphur and carbon utilization. 231
Detrimentally, excess energy can lead to photoinhibition and photo-oxidative damage due to 232
ROS evolution. Phototrophs can dissipate this energy by, for example, (i) activating the cyclic 233
electron flow, (ii) phosphorylating and migrating the light harvesting complex II towards PSI 234
to reinforce the cyclic electron transfer used to oxidize the PQ pool or (iii) activating the 235
xanthophyll cycle [39]. However, to avoid photoprotective mechanisms and thus inefficient 236
photonic energy usage, light supply should take place in balance with the reaction kinetics of 237
the linear electron transfer chain. Interestingly, a light flash lasting picoseconds is already long 238
enough to excite and close the PSII reaction centres [26]. To restore the ground state of PSII, 239
and thus to re-open the reaction centre II, requires the transfer of this charge from the PSII to 240
the PQ pool in the form of plastoquinol [60] and the reduction of PSII through the water 241
oxidising complex. In order to avoid excess of plastoquinol reducing equivalents in the PQ-242
pool, the reduction rate of PQ to plastoquinol at the Qb site of PSII should be similar to the 243
plastoquinol oxidation rate at the Qo site of the cytochrome b6f complex. However, an imbalance 244
easily arises because the oxidation of one plastoquinol takes longer (ca. ≈ 3-5 ms) than reducing 245
PSII by the water oxidising complex (≈ 1-3 ms). To mitigate such imbalances in the linear 246
electron transfer chain, flashing light may be tailored to a flash period duration of a few hundred 247
picoseconds to reduce efficiently the reaction centre II without triggering excitation dissipation 248
mechanisms, and a dark period of 3-5 ms to allow the timely oxidation of plastoquinol, avoiding 249
the overreduction of the PQ pool. 250
However, this kinetics would correspond to a duty cycle of only ≈ 10-8 and a frequency 251
of f ≈ 300-500 Hz. Such settings require low switching times, which are problematic to 252
implement with the current technologies available (Box 2). Indeed, frequencies higher than 253
300 Hz did usually result in a flashing light effect in most phototrophs if the averaged light 254
intensity was near saturation (e.g., Ia ≥ 100 µmol photos s-1 m-2; Table S1). However, 255
decreasing the averaged light intensity towards sub-saturating levels appears to require higher 256
frequencies to obtain the flashing light effect [26, 61]. More specifically, Martín-Girela et al. 257
[61] found a CO2 fixation efficiency of 6.2 photons per fixed CO2 molecule, which was beyond 258
theoretical limits (~8 photons CO2-1) at a frequency of 10,000 Hz (ø = 0.05) with an averaged 259
light intensity that was only 5% of the photosaturating intensity. 260
On the other hand, it remains to be seen how phototrophs respond if they are exposed to 261
extremely low duty cycles (e.g. ø < 10-8), with a flash intensity ≈108 times higher than the 262
averaged light intensity, which corresponds also to a photon penetration depth 8 times higher 263
as compared to that of continuous lighting [7]. Under such timescale, dissipation of excess 264
energy may only take place via fluorescence or thermal decay, and other more complex and 265
energy-demanding quenching mechanisms (e.g. mediated by PGR5, PGRL1, flavodiiron 266
proteins or STN7) cannot be activated in time [37, 62]. This may lead to a more efficient light 267
utilisation and higher photosynthetic efficiencies. On the other hand, these conditions could 268
also increase flash intensities above a threshold that would instantly cause photodamage. If so, 269
an under-saturating averaged light intensity could be sufficient to achieve the same or even 270
enhanced photosynthetic rates compared to continuous lighting with a saturating light intensity, 271
leading to lower power consumption of artificial lighting. Notably, flash intensities that are 272
inhibitory if emitted continuously do not inhibit the phototroph if the frequency is high and duty 273
cycle is short enough (e.g. f > 1 KHz, ø < 0.1) for a given averaged light intensity [24-26, 63-274
65]. For example, Tennessen et al. [26] exposed tomato leaves to photoinhibitory flash 275
intensities (If = 5000 µmol s-1 m-2) at a short duty cycle (ø = 0.01) and a high frequency 276
(f = 5000 Hz) without impairing photosynthesis. Nevertheless, Ley and Mauzerall [66] found 277
that flash intensities higher than 22,000-37,000 µmol photons m-2 s-1 (e.g., 1016 photons cm-2 278
supplied during light periods of 450-750 ns) can indeed cause a decline of oxygen evolution 279
rates in Chlorella vulgaris cultures (td = 2 s). These findings indicate that averaged light 280
intensity, flash intensity, frequency and duty cycle are interdependent and must be well 281
balanced to reap the benefits of artificial flashing light-based phototrophic cultivation. 282
3. Physical boundaries
283The most important physical factor of flashing light is the potential to mitigate light 284
attenuation and increase light delivery in concentrated microalgal cultures [13, 49, 64, 67, 68]. 285
Current efforts to enhance light delivery include intensive mixing, light path minimization, 286
antenna size reduction, waveband tailoring or inclusion of fibres and nanoparticles as 287
waveguides into the photobioreactor [9, 69-72]. In addition to these approaches, high light 288
intensities can increase photon penetration depth in suspensions as defined by Beer-Lambert’s 289
law [7]. The Beer-Lambert´s law [7] describes a linear increasing light penetration depth into 290
microalgal cultures with exponentially rising light intensity, though effects by fluorescence or 291
light scattering by different algae are not considered. 292
Too high light intensities cause photoinhibition of microalgae at the periphery of the 293
photobioreactor, an effect that is mitigated by increasing mixing rates. Higher mixing rates 294
minimise retention time of cells in the high light zone near the walls and in the dark zones in 295
the middle of the reactor. These high mixing rates improve light and can provide light-dark 296
cycles for cells fast enough to obtain the flashing light effect [13, 14]. Particularly high 297
productive cultivation systems benefit from high culture concentrations and light intensities 298
[73]. However, these conditions require extreme high mixing velocities, resulting in high 299
energy consumption [44, 65, 74], shearing, cavitation and pressure changes that impair the 300
physiology and viability of the microalgal cell [73]. Alternatively, a light source can directly 301
emit flashing light, which allows the generation of intense light flashes at frequencies and low 302
duty cycles that do not occur in nature or in any culturing vessel just by adjusting the mixing 303
velocity of the growth medium. 304
As mitigating light attenuation is one of the main arguments for flashing light-induced 305
growth enhancement [13, 49, 64, 67, 68], production systems that operate at high cell 306
concentrations or culturing vessels with long light path lengths are promising targets for 307
flashing light-related power savings. Although such trend has only be observed among few 308
studies [11, 64, 73], the true potential of mitigating light attenuation in dense microalgal 309
cultures remains uncertain, particularly at extreme high light flash intensities (e.g. 310
If > 10,000 µmol photons m-2 s-1), delivered at low duty cycles (e.g., ø < 0.01) and high 311
frequencies (e.g. f > 1 KHz). 312
4. Technical boundaries
314In artificial light-based microalgal production, light with low and high light periods (e.g., 315
flickering or fluctuating light) is naturally emitted by common gas discharge lamps, whereas 316
flashing light is generated when light intensity of LEDs is controlled via pulse-width 317
modulation (e.g., Fig. 1). The intensity of light emitted by fluorescent lamps and mercury or 318
sodium vapour lamps changes between maximum and minimum values (often referred as 319
“flickering light”) at a ballast- and grid-dependent frequency [47]. For example, fluorescent 320
lamps driven by a conventional magnetic or electronic ballast emit flickering light at a 321
frequency of 100-120 Hz and 40-120 KHz, respectively. On the other hand, induction lamps 322
operate at frequencies from hundreds of KHz to tens of MHz [75]. Therefore, it becomes clear 323
that neither induction nor gas discharge lamps should be used as “non-flashing” controls in any 324
flashing light study. In addition, gas discharge lamps are inefficient in terms of photon 325
conversion efficiency if operated at low duty cycles and may be unsuitable for customised 326
flashing light modulation. Alternatively, amplitude or pulse-width modulated LEDs can 327
efficiently emit continuous and flashing light, respectively. However, commonly available 328
pulse-width modulated dimmers generate flashing light only between frequencies of 150 and 329
300 Hz, which may be not sufficient to obtain a flashing light effect if dimmed, though higher 330
frequencies and lower switching times are possible (Box 2). For microalgal production, a 331
promising flashing LED device may operate at a (sub-)saturating averaged light intensity, 332
which requires a light flash intensity that increases in inverse proportion to the duty cycle. The 333
emission of high light flash intensities is possible if the stock densities of LEDs in a luminary 334
array is increased, which has additional costs. Alternatively, the number of photons emitted per 335
light emitter can be enhanced under flashing light if the forward current to an LED is increased 336
far beyond the nominal currents used under continuous operating conditions. This so-called 337
“overloading” demands precise switching regimes to extract the highest number of photons 338
with the highest efficiency possible. Considering all losses between power source and light 339
emission of a flashing light system (referred to as wall plug efficiency), most discriminative 340
parameters include i) response time and photon conversion efficiency of the LED; ii) operating 341
frequency and duty cycle; and iii) the efficiency factor of the electronic ballast and pulse-width 342
modulation unit. Generally, the wall plug efficiency of a flashing lighting system decreases 343
with increasing frequency, decreasing duty cycle and increasing forward current due to working 344
and switching losses at transistors and LEDs [76]. The efficiency drop can be damped if 345
transistors and LEDs display low response times, low working and switching losses under the 346
used flashing light condition and currents. A joint effort between physicists and biologists is 347
thus necessary for the development of efficient flashing light systems that enhance energy use 348
in artificial light-based microalgal production. 349
350
5. Concluding Remarks and Future Perspectives
351Using flashing lights is a promising strategy to supply photonic energy to phototrophic 352
organisms, increasing biomass productivities and reducing the power consumption in artificial 353
light-based production systems. Flashing light can also be applied to established methods used 354
to improve the photosynthetic performance of microalgal cultures such as mixing, light guides 355
or waveband tailoring. The optimal settings of a flashing light regime should correspond to a 356
frequency high enough to obtain the same or higher photosynthetic efficiencies than those under 357
continuous light (e.g., f > 300-500 Hz; biological factor) at a shortest possible duty cycle to 358
obtain the highest possible photon penetration depth (physical factor), but both within the range 359
of adequate power consumption (technical factor). So far, most studies have tested flashing 360
light conditions with low frequencies (f < 100 Hz) and relatively high duty cycles (ø > 0.1) to 361
mimic conditions that are present in mixed microalgal cultures. However, data beyond these 362
conditions will be of particular interest for artificial light-based microalgal production. 363
Mainstream flashing light research and industrial application benefit specifically from 364
inexpensive and technically mature LED modules as light sources. Nevertheless, current LED 365
technology cannot modulate flashing light in the response time scales close to the boundaries 366
imposed by the biological responses, such as light harvesting events within the range of femto- 367
to picoseconds. A possible solution to this limitation is the use of faster responding laser diodes 368
(see Outstanding Questions), which could replace common LEDs in cutting-edge research, as 369
well as in future industrial production facilities. Cultures exposed to sub-nanosecond light 370
flashes might obey the laws of quantum mechanics, which can result in unforeseeable effects 371
on photosynthesis and growth of phototrophs. Research on charge transfer on quantum level as 372
e.g. implemented by the EU project H2020-MSCA-QuantumPhotosynth may shed new light 373
on the limits of photosynthesis and more efficient photon utilisation by microalgae 374
6. Acknowledgements
375This study was funded by the Foundation for Science and Technology (FCT, Portugal; 376
CCMAR/Multi/04326/2013), Nord University, Nordland County Government (project 377
Bioteknologi– en framtidsrettet næring), and ALGARED+ 1398 EP - INTERREG V-A España-378
Portugal project. Peter S.C. Schulze and Hugo Pereira are PhD students funded by the Nord 379
University and the Portuguese Foundation for Science and Technology 380
(SFRH/BD/105541/2014), respectively. 381
Box 1 - Kinetics of the linear electron transfer chain (LET) 382
Photons coming from a light source are absorbed through light harvesting pigment 383
complexes within femtoseconds. About 300-500 ps are needed to transfer shared excited energy 384
states (excitons) through inter-protein hopping and magnetic resonance to the reaction centres 385
of PSII (reaction centre II or P680), causing the excitation of an electron. The reaction centre 386
requires two electrons for reduction and “closure” (i.e. P680*; Fig. I; [32]). Once the reaction 387
centre is in the “closed” state, further excess photon energy cannot be transferred to the reaction 388
centre II and is released through energy dissipation mechanisms. The low redox state of the 389
P680* reduces the primary electron acceptor pheophytin within 3 to 8 ps, becoming oxidised 390
(P680+). The electrons from pheophytin are transferred to the primary (Qa) and secondary (Qb) 391
acceptor sites within ~200-500 ps and 700-1200 µs, respectively. Upon Qb reduction, this site 392
acquires protons from the stroma, forming plastoquinol.In turn, plastoquinol diffuses towards 393
the PQ pool in the thylakoid membrane upon exchange with one PQ molecule, which binds to 394
the Qb site. The PQ pool serves as energy store. The energy is retrieved upon the oxidation of 395
plastoquinol by the cytochrome b6f complex via the q-cycle [77]. 396
The high redox potential of P680+ initiates an electron transfer from the water oxidising 397
complex through the intermediate electron carrier tyrosine, which reduces P680+ in a succession 398
of steps (S0-S3). Full oxidation of two water molecules and the release of four electrons takes 399
place in about 1-2 ms [35]. As P680 is formed, the reaction centre II re-opens and the 400
subsequent exciton capture takes place. 401
The slowest (~3-5 ms) and thus limiting step in the linear electron transfer chain is the 402
oxidation of plastoquinol by the cytochrome b6f. Two protons are released into the thylakoid 403
lumen and electrons are transferred towards plastocyanin. Plastocyanin transfers electron 404
towards PSI within 150-550 µs. In PSI, electrons are passed to the electron donor P700 (reaction 405
centre I), forming P700* through photon energy delivered by the light harvesting complex I 406
within femtoseconds. Electrons are passed to the electron acceptors A0, A1 and the 4Fe-4S iron 407
sulphur centres Fx, Fa and Fb within picoseconds, reducing the final electron acceptor, 408
ferredoxin. Because of these short turnover times, the reactions in P700 are considered to be a 409
spontaneous reaction [32, 34]. Ferredoxin can donate electrons to ferredoxin-NADP(+) 410
reductase to form NADPH, completing the LET. The cyclic electron transfer chain is activated 411
to produce additional ATP and NAPDH required for carbon assimilation via the Calvin-Benson 412
cycle. 413
414
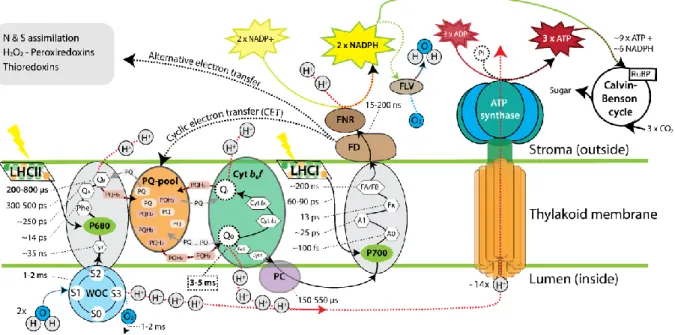
Figure I - Simplified diagram about the major kinetics of electron transfers in phototrophs, 415
where the linear electron transfer chain (LET) is depicted and other alternative pathways are 416
indicated. Reaction times and pathways were summarized from Ref [35, 39]. Note that 417
stoichiometric values for H+, ATP and NADPH are variable. To balance electron flow under 418
fluctuating light regimes, phototrophs use species dependently different Flv proteins to reduce 419
oxygen to water at the expense of NADPH or electrons from the photosystems [85]. 420
Abbreviations: A1, phylloquinone-based electron acceptor; ADP, adenosine diphosphate; Ao, 421
chlorophyll based electron acceptor; ATP, adenosine triphosphate; Cytb6f, cytochrome b6f 422
complex; Cyt bL/H, f, b-type hemes cytochrome bL/H, f; FA/FB & Fx, electron acceptors 4Fe-4S 423
irons sulphur centres; FeS, Rieske iron-sulphur protein; FD, ferredoxin; Flv, flavodiiron 424
protein; FNR, Ferredoxin-NADP(+) reductase; LHC, light harvesting complex; NADP+, 425
nicotinamide adenine dinucleotide phosphate; NADPH, nicotinamide adenine dinucleotide 426
phosphate (reduced); P680, Photosystem II; P700, Photosystem I; PC, plastocyanin; Phe, 427
pheophytin; Pi, inorganic phosphorus; PQ, plastoquinone; PQH2, plastoquinol; QA, primary 428
acceptor site; QB, secondary acceptor site; Qi, quinone reductase; Qo, quinol oxidase; RuBP, 429
ribulose-1,5-bisphosphate; Tyr, tyrosine; WOC, Water oxidising complex. 430
431 432
Box 2 - Technical limits of flashing light sources 433
The efficiency of a flashing light system depends on working and switching losses at 434
transistors built in pulse-width modulators, controlling units and LEDs that interact differently 435
with applied current, frequency and duty cycle. For example, work losses in transistors switches 436
increase if duty cycle and currents are high, but they are frequency-independent. Switching 437
losses increase with frequency, though they are current-independent [76]. Photon extraction 438
potential from LEDs is higher if forward current is increased (i.e. LED overloading), and light 439
and dark periods are short and long enough, respectively, to allow sufficient heat dissipation 440
from the LED-chip (Fig. II). In this case, frequency and duty cycle are interdependent. 441
Overloading is a valuable option for flashing light applications, permitting the operation of 442
an LED under higher currents that exceed nominal levels (e.g., by increasing the supplied 443
voltage), resulting in maximal photon flux during the duty cycle and heat dissipation during the 444
dark period [11, 24]. Through overloading, the LED operates at current densities beyond which 445
the “droop effect” occurs. As result, the photon conversion efficiency drops with increasing 446
forward currents and maximal photon extraction cannot exceed a given threshold [78]. During 447
overloading and shortening duty cycle, the maximal extractable averaged light intensity (Ia) per 448
LED decreases, but the maximal applicable instantaneous forward current and extractable flash 449
intensity increases. 450
Another parameter is the LED minimal response time (tr_min), which is the major cause for 451
electrical losses when emitting flashing light. Here, the depletion region as central internal 452
element of any LED chip creates capacitances that limit the response of single-coloured LEDs 453
to a few nanoseconds (tr_min ≈ 1-50 ns). Note that organic LEDs display high capacitances while 454
phosphor-converted LEDs have long (electro-)luminescence decay times, which restricts 455
tr_min to approximately ≥ 1 µs [79-81]. Standard laser diodes display very low capacitance, 456
allowing tr_min <500 ps [82]. Overloading and chip size increases these capacitances and thus 457
response times, limiting maximal adjustable frequencies or duty cycles. Lowering response 458
times of (organic) LEDs is an active field of research as required for efficient visible light 459
communication or screens [80, 82, 83]. 460
Broadband flashing light research at nanosecond scales can use widely available signal 461
generators connected to high power single-coloured LEDs or laser diodes as a cheap solution 462
(e.g. <2000€). For larger scale systems with high light output, a more robust and cheaper system 463
may be used, based on a slower responding open source system (≥1 µs) consisting of an 464
Arduino microcontroller coupled with standard LED luminaries (for examples see [50, 84]). 465
466
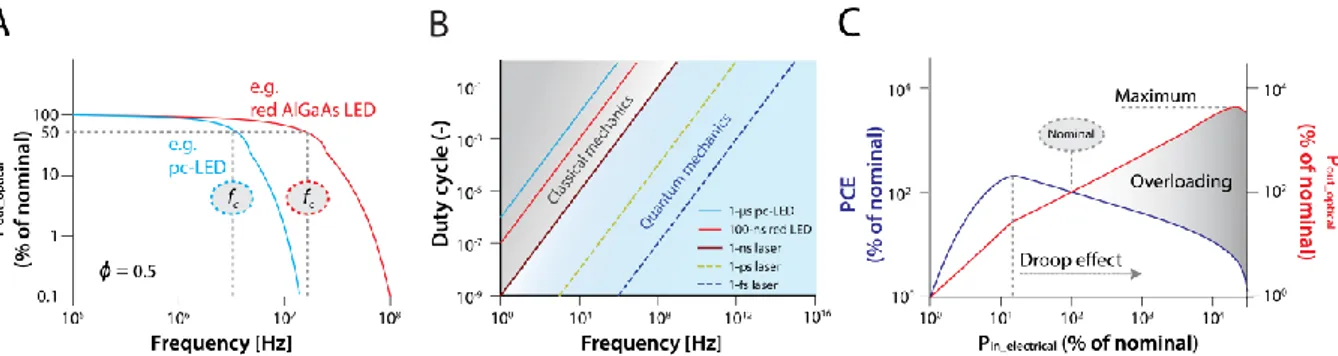
Figure II - The efficiency of LEDs or laser diodes under pulsed power supply can be 467
calculated from frequency response graphs, called bode plots (A). Here, the cut-off frequency 468
(fc) refers to the maximal adjustable frequency with maximal 50% power losses (commonly 469
referred to as 3 dB point). From fc, response times and possible adjustable flashing light regimes 470
can be calculated for different light sources (B). If switching regimes are below 1 ns, a shift 471
from laws of classical to quantum mechanics occurs. Overloading (C) is achieved if the input 472
power (Pin_electrical) increases due to higher forward currents that exceed nominal levels. 473
Nominal conditions are obtained when LEDs operate under continuous power supply and rated 474
(or nominal-) currents at a given temperature. Under a nominal power input (Pin_electical), an LED 475
achieves its nominal light output (Pout_optical) and nominal efficiency (e.g., photon conversion 476
efficiency; PCE = Pout_optical/Pin_electrical) as defined by the manufacturer. LED light output 477
comes at the cost of efficiency after passing a critical current density beyond which the droop 478
effect occurs (dashed line) and usually reaches a peak (maximum) with subsequent decline. All 479
values given are examples and may differ among diodes. Abbreviations: pc-LED: phosphor 480
converted LED, AlGaAs LED: gallium-aluminium-arsenide LED. 481
Glossary box 483
• Intermittent light includes flashing or pulsed light and fluctuating, flickering or 484
oscillating light. Light and dark periods of flashing or pulsed light conditions shift in an 485
all-or-nothing, rectangular waveform. Fluctuating or oscillating light is a fluent 486
transition between high and low light periods, whereas instantaneous light intensities 487
alter continuously over time, following usually a sinusoidal waveform. Sunflecks or 488
cells moving from light to dark zones within a photobioreactor trough mixing usually 489
follow fluctuating light patterns. 490
• Light attenuation: Self-shading by microalgal cells is the most challenging bottleneck 491
limiting the productivity and maximal achievable cell concentration in 492
photobioreactors. Cells located at the periphery of a culture absorb most of the incoming 493
light and may become photoinhibited, whereas cells at the inner layers remain in the 494
dark and become photolimited. This results in high respiration and energy dissipation 495
rates, causing inefficient photobioreactor use. The depth of the light penetration depends 496
primarily on absorption by cells under cultivation, incoming light intensity and 497
wavelength, cell morphology (e.g. cell size) and biochemistry (e.g. pigment contents). 498
• Mehler and Mehler-like reactions are controlling light-depended O2 consumption. 499
Unlike the Mehler reaction, the Mehler-like reaction involves flavodiiron proteins to 500
reduce O2 without ROS evolution. Mehler-like reactions enable cyanobacteria, 501
microalgae, and plants to cope efficiently with intermittent light regimes. 502
• Minimal response times (tr_min): The minimal response time of LEDs and transistors 503
can be calculated by 𝑡𝑟_𝑚𝑖𝑛= ø × 𝑓𝑐−1, where ø is the duty cycle and 𝑓𝑐 is the flashing 504
frequency at “cut-off”, obtained from a frequency response graph (i.e. Bode plot). 505
• Photosynthetic efficiency referrers to how much light (e.g. amount in photons or 506
energy) is required by a phototroph to take up CO2 or produce O2 through 507
photosynthesis (e.g. µmol CO2 or O2 per µmol of photons). Effects of flashing light on 508
the photosynthetic efficiency of single cells or chloroplasts and whole cultures should 509
be distinct. Dilute cultures with narrow light paths and negligible light attenuation are 510
usually used to identify effects of flashing light on single cells or chloroplasts 511
(biological boundary). However, flashing light was mostly found to improve 512
photosynthetic efficiency of whole microalgal cultures with high light attenuation (e.g. 513
highly concentrated cultures). 514
• Photo- and mixotrophy: Phototrophic organisms use light as energy source to fix 515
inorganic carbon dioxide in organic compounds. Heterotrophic organisms obtain energy 516
and carbon from organic sources (glucose or acetate). A few mixotrophic microalgae 517
are able to obtain energy and carbon skeletons by means of photosynthesis, active 518
predation, endocytosis, and membrane-bound transport systems. Some others are even 519
able to steal chloroplasts from other microalgae using a mechanism called myzocytosis. 520
• Pulse-width modulation is a tool used to control the power supply (e.g. dimming) of 521
electrical devices such as LEDs. It generates a pulse wave signal (i.e., rectangular pulse 522
wave) with an asymmetrical shape (i.e. the duration of the on-off cycle) described by 523
the duty cycle. 524
References 525
1. Communication from the comission to the european parliament, the council, the european
526
economic and social committee and the committee of the regions- Blue Growth: opportunities for
527
marine and maritime sustainable growth, European Comission, 2012.
528
2. Enzing, C. et al., Microalgae-based products for the food and feed sector: an outlook for Europe, J R
529
C Scientific and Policy reports, European Comission, 2014.
530
3. Ruiz, J. et al. (2016) Towards industrial products from microalgae. Energy & Environmental Science.
531
4. Blanken, W. et al. (2013) Cultivation of microalgae on artificial light comes at a cost. Algal Res. 2,
532
333-340.
533
5. Schulze, P.S.C. et al. (2014) Light emitting diodes (LEDs) applied to microalgal production. Trends
534
Biotechnol. 32, 422-430.
535
6. Schulze, P.S.C. et al. (2016) Effect of light quality supplied by light emitting diodes (LEDs) on growth
536
and biochemical profiles of Nannochloropsis oculata and Tetraselmis chuii. Algal Res. 16, 387-398.
537
7. Lee, C.-G. (1999) Calculation of light penetration depth in photobioreactors. Biotechnol. Bioproc. E.
538
4, 78-81.
539
8. MacKenzie, T.D. and Campbell, D.A. (2005) Cyanobacterial acclimation of rapidly fluctuating light is
540
constrained by inorganic carbon status. J. Phycol. 41, 801-811.
541
9. Ooms, M.D. et al. (2016) Photon management for augmented photosynthesis. Nat. Commun. 7.
542
10. Park, K.-H. and Lee, C.-G. (2001) Effectiveness of flashing light for increasing photosynthetic
543
efficiency of microalgal cultures over a critical cell density. Biotechnol. Bioproc. E. 6, 189-193.
544
11. Park, K.-H. and Lee, C.-G. (2000) Optimization of algal photobioreactors using flashing lights.
545
Biotechnol. Bioproc. E. 5, 186-190.
546
12. Azevedo, I.L. et al. (2009) The transition to solid-state lighting. P. IEEE 97, 481-510.
547
13. Abu-Ghosh, S. et al. (2016) Flashing light in microalgae biotechnology. Bioresource Technol. 203,
548
357-363.
549
14. Iluz, D. et al. (2012) The enhancement of photosynthesis by fluctuating light. In Artifical
550
Photosynthesis (Najafpour, M.M. ed), pp. 115-134.
551
15. Terry, K.L. (1986) Photosynthesis in modulated light: quantitative dependence of photosynthetic
552
enhancement on flashing rate. Biotechnol. Bioeng. 28, 988-995.
553
16. Pearcy, R.W. (1990) Sunflecks and photosynthesis in plant canopies. Annu. Rev. Plant Biol. 41,
421-554
453.
555
17. Jishi, T. et al. (2015) A kinetic model for estimating net photosynthetic rates of cos lettuce leaves
556
under pulsed light. Photosynth. Res. 124, 107-116.
557
18. Hartmann, P. et al. (2014) The effect of photosynthesis time scales on microalgae productivity.
558
Bioproc. Biosyst. Eng. 37, 17-25.
559
19. Vejrazka, C. et al. (2015) The role of an electron pool in algal photosynthesis during sub-second
560
light–dark cycling. Algal Res. 12, 43-51.
561
20. Vejrazka, C. et al. (2012) Photosynthetic efficiency of Chlamydomonas reinhardtii in attenuated,
562
flashing light. Biotechnol. Bioeng. 109, 2567-2574.
563
21. Vejrazka, C. et al. (2011) Photosynthetic efficiency of Chlamydomonas reinhardtii in flashing light.
564
Biotechnol. Bioeng. 108, 2905-2913.
565
22. Vejrazka, C. et al. (2013) Photosynthetic efficiency and oxygen evolution of Chlamydomonas
566
reinhardtii under continuous and flashing light. Appl. Microbiol. Biotechnol. 97, 1523-1532.
567
23. Brindley, C. et al. (2010) The oxygen evolution methodology affects photosynthetic rate
568
measurements of microalgae in well‐defined light regimes. Biotechnol. Bioeng. 106, 228-237.
569
24. Matthijs, H.C. et al. (1996) Application of light‐emitting diodes in bioreactors: Flashing light effects
570
and energy economy in algal culture (Chlorella pyrenoidosa). Biotechnol. Bioeng. 50, 98-107.
571
25. Nedbal, L. et al. (1996) Microscopic green algae and cyanobacteria in high-frequency intermittent
572
light. J. Appl. Phycol. 8, 325-333.
573
26. Tennessen, D.J. et al. (1995) Efficiency of photosynthesis in continuous and pulsed light emitting
574
diode irradiation. Photosynth. Res. 44, 261-269.
27. Sager, J.C. and Giger, W. (1980) Re-evaluation of published data on the relative photosynthetic
576
efficiency of intermittent and continuous light. Agr. Meteorol. 22, 289-302.
577
28. Varela, J.C. et al. (2015) Production of carotenoids by microalgae: achievements and challenges.
578
Photosynth. Res. 125, 423-436.
579
29. Nishiyama, Y. and Murata, N. (2014) Revised scheme for the mechanism of photoinhibition and its
580
application to enhance the abiotic stress tolerance of the photosynthetic machinery. Appl. Microbiol.
581
Biotechnol. 98, 8777-8796.
582
30. Porcar-Castell, A. and Palmroth, S. (2012) Modelling photosynthesis in highly dynamic
583
environments: the case of sunflecks. Tree Physiol. 32, 1062-1065.
584
31. Pearcy, R.W. and Way, D.A. (2012) Two decades of sunfleck research: looking back to move
585
forward. Tree Physiol. 32, 1059-1061.
586
32. Nelson, N. and Junge, W. (2015) Structure and energy transfer in photosystems of oxygenic
587
photosynthesis. Annu. Rev. Biochem. 84.
588
33. Goss, R. and Lepetit, B. (2015) Biodiversity of NPQ. J. Plant Physiol. 172, 13-32.
589
34. Hüner, N.P. et al. (2012) Chloroplast redox imbalance governs phenotypic plasticity: the “grand
590
design of photosynthesis” revisited. Front. Plant Sci. 3.
591
35. Vinyard, D.J. et al. (2013) Photosystem II: the reaction center of oxygenic photosynthesis*. Annual
592
review of biochemistry 82, 577-606.
593
36. Allahverdiyeva, Y. et al. (2013) Flavodiiron proteins Flv1 and Flv3 enable cyanobacterial growth and
594
photosynthesis under fluctuating light. PNAS 110, 4111-4116.
595
37. Allahverdiyeva, Y. et al. (2014) Photoprotection of photosystems in fluctuating light intensities. J.
596
Exp. Bot. 66, 2427–2436.
597
38. Dang, K.-V. et al. (2014) Combined increases in mitochondrial cooperation and oxygen
598
photoreduction compensate for deficiency in cyclic electron flow in Chlamydomonas reinhardtii. Plant
599
Cell 26, 3036-3050.
600
39. Rochaix, J.-D. (2011) Regulation of photosynthetic electron transport. BBA-Bioenergetics 1807,
601
878-886.
602
40. Krasnovsky, A. and Kovalev, Y.V. (2014) Spectral and kinetic parameters of phosphorescence of
603
triplet chlorophyll a in the photosynthetic apparatus of plants. Biochemistry-US 79, 349.
604
41. Erickson, E. et al. (2015) Light stress and photoprotection in Chlamydomonas reinhardtii. Plant J.
605
82, 449-465.
606
42. Leakey, A. et al. (2002) Relative enhancement of photosynthesis and growth at elevated CO2 is 607
greater under sunflecks than uniform irradiance in a tropical rain forest tree seedling. Plant, Cell
608
Environ. 25, 1701-1714.
609
43. Papageorgiou, G.C. (2014) The non-photochemical quenching of the electronically excited state of
610
chlorophyll a in plants: definitions, timelines, viewpoints, open questions. In Non-photochemical
611
quenching and energy dissipation in plants, algae and cyanobacteria, pp. 1-44, Springer.
612
44. Takache, H. et al. (2015) Investigation of light/dark cycles effects on the photosynthetic growth of
613
Chlamydomonas reinhardtii in conditions representative of photobioreactor cultivation. Algal Res. 8,
614
192-204.
615
45. Xue, S. et al. (2011) Growth of Spirulina platensis enhanced under intermittent illumination. J.
616
Biotechnol. 151, 271-277.
617
46. Gris, B. et al. (2014) Cultivation of Scenedesmus obliquus in photobioreactors: effects of light
618
intensities and light–dark cycles on growth, productivity, and biochemical composition. Appl. Biochem.
619
Biotechnol. 172, 2377-2389.
620
47. Mouget, J.-L. et al. (1995) Long-term acclimatization of Scenedesmus bicellularis to high-frequency
621
intermittent lighting (100 Hz). II. Photosynthetic pigments, carboxylating enzymes and biochemical
622
composition. J. Plankton Res. 17, 875-890.
623
48. Sforza, E. et al. (2012) Adjusted light and dark cycles can optimize photosynthetic efficiency in algae
624
growing in photobioreactors. PloS one 7, e38975.
625
49. Sastre, R.M.R. ( 2010) Kopplung physiologischer und verfahrenstechnischer Parameter beim
626
Wachstum und bei der Produktbildung der Rotalge Porphyridium purpureum, KIT Scientific Publishing.
50. Combe, C. et al. (2015) Long‐term adaptive response to high‐frequency light signals in the
628
unicellular photosynthetic eukaryote Dunaliella salina. Biotechnol. Bioeng.
629
51. Abu-Ghosh, S. et al. (2015) Flashing light enhancement of photosynthesis and growth occurs when
630
photochemistry and photoprotection are balanced in Dunaliella salina. Eur. J. Phycol. 50, 469-480.
631
52. Yoshioka, M. et al. (2012) Effect of high frequency of intermittent light on the growth and fatty acid
632
profile of Isochrysis galbana. Aquaculture 338, 111-117.
633
53. Chen, C.-Y. et al. (2015) Enhancing the production of eicosapentaenoic acid (EPA) from
634
Nannochloropsis oceanica CY2 using innovative photobioreactors with optimal light source
635
arrangements. Bioresource Technol. 191, 407-413.
636
54. Kim, C.W. et al. (2014) Energy-efficient cultivation of Chlamydomonas reinhardtii for lipid
637
accumulation under flashing illumination conditions. Biotechnol. Bioproc. E. 19, 150-158.
638
55. Katsuda, T. et al. (2006) Effect of flashing light from blue light emitting diodes on cell growth and
639
astaxanthin production of Haematococcus pluvialis. J. Biosci. Bioeng. 102, 442-446.
640
56. Sastre, R.M.R. (2010) Kopplung physiologischer und verfahrenstechnischer Parameter beim
641
Wachstum und bei der Produktbildung der Rotalge Porphyridium purpureum, KIT Scientific Publishing.
642
57. Emerson, R. and Arnold, W. (1932) A separation of the reactions in photosynthesis by means of
643
intermittent light. J. Gen. Physiol. 15, 391-420.
644
58. Radmer, R. and Kok, B. (1977) Photosynthesis: limited yields, unlimited dreams. Bioscience 27,
599-645
605.
646
59. Stitt, M. and ZHU, X.G. (2014) The large pools of metabolites involved in intercellular metabolite
647
shuttles in C4 photosynthesis provide enormous flexibility and robustness in a fluctuating light
648
environment. Plant Cell Environ. 37, 1985-1988.
649
60. Raven, J.A. and Ralph, P.J. (2014) Enhanced biofuel production using optimality, pathway
650
modification and waste minimization. J. Appl. Phycol., 1-31.
651
61. Martín-Girela, I. et al. (2017) Flashing light effects on CO2 absorption by microalgae grown on a 652
biofilm photobioreactor. Algal Res. 25, 421-430.
653
62. Belgio, E. et al. (2014) Economic photoprotection in photosystem II that retains a complete
light-654
harvesting system with slow energy traps. Nat. Commun. 5, doi: 10.1038/ncomms5433.
655
63. Olvera-Gonzalez, E. et al. (2013) Intelligent lighting system for plant growth and development.
656
Comput. Electron. Agr. 92, 48-53.
657
64. Grobbelaar, J.U. et al. (1996) Influence of high frequency light/dark fluctuations on photosynthetic
658
characteristics of microalgae photoacclimated to different light intensities and implications for mass
659
algal cultivation. J. Appl. Phycol. 8, 335-343.
660
65. Liao, Q. et al. (2014) A novel photobioreactor generating the light/dark cycle to improve microalgae
661
cultivation. Bioresource Technol. 161, 186-191.
662
66. Ley, A.C. and Mauzerall, D.C. (1982) Absolute absorption cross-sections for photosystem II and the
663
minimum quantum requirement for photosynthesis in Chlorella vulgaris. BBA-Bioenergetics 680,
95-664
106.
665
67. Brindley, C. et al. (2011) Analysis of light regime in continuous light distributions in
666
photobioreactors. Bioresource Technol. 102, 3138-3148.
667
68. Lunka, A. and Bayless, D. (2013) Effects of flashing light-emitting diodes on algal biomass
668
productivity. J. Appl. Phycol. 25, 1679-1685.
669
69. Sun, Y. et al. (2016) Integrating planar waveguides doped with light scattering nanoparticles into a
670
flat-plate photobioreactor to improve light distribution and microalgae growth. Bioresource Technol.
671
220, 215-224.
672
70. Heining, M. et al. (2015) Internal illumination of photobioreactors via wireless light emitters: a
673
proof of concept. J. Appl. Phycol. 27, 59-66.
674
71. Sutor, A. et al. (2014) Method for optimizing the field coils of internally illuminated
675
photobioreactors. IEEE T. Magn. 50, 1-4.
676
72. Glemser, M. et al. (2016) Application of light-emitting diodes (LEDs) in cultivation of phototrophic
677
microalgae: current state and perspectives. Appl. Microbiol. Biotechnol. 100, 1077-1088.
678
73. Brindley, C. et al. (2016) Light regime optimization in photobioreactors using a dynamic
679
photosynthesis model. Algal Res. 16, 399-408.
74. Grobbelaar, J.U. (2006) Photosynthetic response and acclimation of microalgae to light
681
fluctuations. In Algal Cultures Analogues of Blooms and Applications (Subba Rao, D.V. ed), pp. 671-683,
682
Science Publishers.
683
75. Kane, R. et al. (2002) Revolution in lamps: A chronicle of 50 years of progress., Fairmount Press.
684
76. Grodzki, L. (2013) The Comparison of the Pulse and Constant-current LED Driving. Prz.
685
Elektrotechniczn. 89, 298-300.
686
77. Cape, J.L. et al. (2006) Understanding the cytochrome bc complexes by what they don't do. The
Q-687
cycle at 30. Trends Plant sci. 11, 46-55.
688
78. Römer, F. and Witzigmann, B. (2014) Effect of Auger recombination and leakage on the droop in
689
InGaN/GaN quantum well LEDs. Optics express 22, A1440-A1452.
690
79. Chow, C. et al. (2012) Digital signal processing for light emitting diode based visible light
691
communication. IEEE Photon. Soc. Newslett. 26, 9-13.
692
80. Park, J. (2010) Speedup of dynamic response of organic light-emitting diodes. J. Lightwave Technol.
693
28, 2873-2880.
694
81. Rose, J. et al. (2010) Driving LED in a nanosecond regime by a fast operational amplifier. arXiv
695
preprint arXiv:1011.1954.
696
82. Janjua, B. et al. (2015) Going beyond 4 Gbps data rate by employing RGB laser diodes for visible
697
light communication. Opt. express 23, 18746-18753.
698
83. Chen, S.-F. et al. (2014) High-frequency modulation of GaAs/AlGaAs LEDs using Ga-doped ZnO
699
current spreading layers. Electron Devic. Lett. 35, 36-38.
700
84. Wishkerman, A. and Wishkerman, E. (2017) Application note: A novel low-cost open-source LED
701
system for microalgae cultivation. Comput. Electron. Agr. 132, 56-62.
702
85. Peltier, G. et al. (2010) Auxiliary electron transport pathways in chloroplasts of microalgae.
703
Photosynth. Res. 106, 19-31.
704 705