BGD
9, 18083–18129, 2012
Phytoplankton competition during
the spring bloom
T. Hashioka et al.
Title Page
Abstract Introduction
Conclusions References
Tables Figures
◭ ◮
◭ ◮
Back Close
Full Screen / Esc
Printer-friendly Version Interactive Discussion
Discussion
P
a
per
|
Dis
cussion
P
a
per
|
Discussion
P
a
per
|
Discussio
n
P
a
per
|
Biogeosciences Discuss., 9, 18083–18129, 2012 www.biogeosciences-discuss.net/9/18083/2012/ doi:10.5194/bgd-9-18083-2012
© Author(s) 2012. CC Attribution 3.0 License.
Biogeosciences Discussions
This discussion paper is/has been under review for the journal Biogeosciences (BG). Please refer to the corresponding final paper in BG if available.
Phytoplankton competition during the
spring bloom in four Plankton Functional
Type Models
T. Hashioka1,2,3, M. Vogt4, Y. Yamanaka1,3,5, C. Le Qu ´er ´e2, E. T. Buitenhuis2, M. N. Aita5, S. Alvain6, L. Bopp7, T. Hirata1, I. Lima8, S. Sailley8, and S. C. Doney8
1
Graduate School of Environmental Earth Science, Hokkaido University, Sapporo, Japan
2
Tyndall Centre for Climate Change Research, School of Environmental Sciences, University of East Anglia, Norwich NR4 7TJ, UK
3
Core Research for Evolutional Science and Technology, Japan Science and Technology Agency, Tokyo, Japan
4
Institute for Biogeochemistry and Pollutant Dynamics, CHN 23.2, Universit ¨atsstrasse 16, 8092 Z ¨urich, Switzerland
5
Japan Agency for Marine-Earth Science and Technology, Yokohama, Japan
6
LOG, Univers it ´e Lille Nord de France, ULCO, CNRS, Wimereux, France
7
Laboratoire du Climat et de l’Environnement (LSCE), L’Orme des Merisiers B ˆat. 712, 91191 Gif sur Yvette, France
8
BGD
9, 18083–18129, 2012
Phytoplankton competition during
the spring bloom
T. Hashioka et al.
Title Page
Abstract Introduction
Conclusions References
Tables Figures
◭ ◮
◭ ◮
Back Close
Full Screen / Esc
Printer-friendly Version Interactive Discussion
Discussion
P
a
per
|
Dis
cussion
P
a
per
|
Discussion
P
a
per
|
Discussio
n
P
a
per
|
Received: 20 November 2012 – Accepted: 6 December 2012 – Published: 13 December 2012 Correspondence to: T. Hashioka (hashioka@ees.hokudai.ac.jp)
BGD
9, 18083–18129, 2012
Phytoplankton competition during
the spring bloom
T. Hashioka et al.
Title Page
Abstract Introduction
Conclusions References
Tables Figures
◭ ◮
◭ ◮
Back Close
Full Screen / Esc
Printer-friendly Version Interactive Discussion
Discussion
P
a
per
|
Dis
cussion
P
a
per
|
Discussion
P
a
per
|
Discussio
n
P
a
per
|
Abstract
We investigated the mechanisms of phytoplankton competition during the spring bloom, one of the most dramatic seasonal events in lower-trophic level ecosystems, in four state-of-the-art Plankton Functional Type (PFTs) models: PISCES, NEMURO, Plank-TOM5 and CCSM-BEC. In particular, we investigated the relative importance of
dif-5
ferent ecophysiological processes on the determination of the community structure, focusing both on the bottom-up and the top-down controls. The models reasonably reproduced the observed global distribution and seasonal variation of phytoplankton biomass. The fraction of diatoms with respect to the total phytoplankton biomass in-creases with the magnitude of the spring bloom in all models. However, the governing
10
mechanisms differ between models, despite the fact that current PFT models repre-sent ecophysiological processes using the same types of parameterizations. The in-creasing trend in the percentage of diatoms with inin-creasing bloom magnitude is mainly caused by a stronger nutrient dependence of photosynthesis for diatoms compared to nanophytoplankton (bottom-up control). The difference in the maximum photosynthesis
15
rate plays an important role in NEMURO and PlankTOM5 and determines the abso-lute values of the percentage of diatoms during the bloom. In CCSM-BEC, the light dependency of photosynthesis plays an important role in the North Atlantic and the Southern Ocean. The grazing pressure by zooplankton (top-down control), however, strongly contributes to the dominance of diatoms in PISCES and CCSM-BEC. The
re-20
gional differences in the percentage of diatoms in PlankTOM5 are mainly determined by top-down control. These differences in the mechanisms suggest that the response of marine ecosystems to climate change could significantly differ among models, even if the present-day ecosystem is reproduced to a similar degree of confidence. For fur-ther understanding of plankton competition and for the prediction of future change in
25
BGD
9, 18083–18129, 2012
Phytoplankton competition during
the spring bloom
T. Hashioka et al.
Title Page
Abstract Introduction
Conclusions References
Tables Figures
◭ ◮
◭ ◮
Back Close
Full Screen / Esc
Printer-friendly Version Interactive Discussion
Discussion
P
a
per
|
Dis
cussion
P
a
per
|
Discussion
P
a
per
|
Discussio
n
P
a
per
|
1 Introduction
In recent decades, marine ecosystem models have been established as an essential tool for the comprehensive understanding of marine ecosystem dynamics and biogeo-chemical cycles. In addition, demands for modeling are increasing not only for the quantification of the contribution of marine ecosystem to the oceanic carbon cycle, but
5
also for the understanding of marine ecosystems themselves, e.g. how different en-vironmental conditions may lead to changes in biodiversity or biome shifts (Denman et al., 2007). As one possible strategy for the representation of marine ecosystems in models, the Plankton Functional Type (PFT) approach has been suggested (Falkowski, 1999; Moore et al., 2004; Le Qu ´er ´e et al., 2005). PFT models categorize the enormous
10
diversity in plankton species and taxonomy according to their role as functional types in the biogeochemical cycling of important elements such as N, P, C or S, and their bi-ological role (e.g. size class, contribution to primary production, or food-web structure and trophic level).
Coupled with earth system or climate models, PFT models effectively project
sev-15
eral significant impacts on marine ecosystems associated with climate change. For example, models suggest that future impacts on marine ecosystems associated with global warming may include; (i) changes in the primary and export productions, (ii) changes in the community structure and (iii) changes in plankton seasonality (phe-nology). Steinacher et al. (2010) compared the results from four different types of PFT
20
models, including CCSM-BEC and PISCES, for the period of 2000–2100. In their study, they found regional patterns with decreased primary production in the subtropics, in-creased primary production in polar latitudes, and dein-creased global primary production under global warming. Manizza et al. (2010) suggested an increase in the export pro-duction between 2005 and 2061 in high latitude oceans using PFT models, PlankTOM5
25
BGD
9, 18083–18129, 2012
Phytoplankton competition during
the spring bloom
T. Hashioka et al.
Title Page
Abstract Introduction
Conclusions References
Tables Figures
◭ ◮
◭ ◮
Back Close
Full Screen / Esc
Printer-friendly Version Interactive Discussion
Discussion
P
a
per
|
Dis
cussion
P
a
per
|
Discussion
P
a
per
|
Discussio
n
P
a
per
|
using PISCES and a global warming scenario. Furthermore, Hashioka and Yamanaka (2007a) suggested an earlier onset of the spring bloom at the end of the 21st century using the PFT model NEMURO. Hashioka et al. (2009) also projected regionally spe-cific changes in the magnitude of blooms in the western North Paspe-cific using NEMURO with an eddy-permitting physical model.
5
While the simulations using PFT models provide valuable information to assess po-tential impacts of climate change on marine ecosystems, it is essential to understand the characteristics of each model and to identify key processes which control the pro-jected features. Current PFT models are constructed as interplay of many physiologi-cal or biogeochemiphysiologi-cal processes, which are both observed or (theoretiphysiologi-cally) expected.
10
Thus, there are many resemblances between the basic mechanisms simulated by cur-rent PFT models. For instance, several key processes such as phytoplanktonic photo-synthesis or grazing by zooplankton can be described using the same type of equa-tions. However, parameter values are significantly different between models because the observed parameter range is usually wide. The differences in the parameter values
15
correspond to the difference in the relative importance of the individual processes in the model.
The MARine Ecosystem Model Intercomparison Project (MAREMIP) was launched in an effort to evaluate the role of functional groups in the whole ecosystem and to identify the key processes. Four PFT models participated in phase 0 of MAREMIP,
20
PISCES (Aumont et al., 2006), NEMURO (Kishi et al., 2007), PlankTOM5 (Buitenhuis et al., 2010) and CCSM-BEC (Moore et al., 2004). These models have been compared with each other and validated with observational data.
Here, we investigate the mechanisms of phytoplankton competition that determine the community structure of marine ecosystem models. We focus on the competition
be-25
BGD
9, 18083–18129, 2012
Phytoplankton competition during
the spring bloom
T. Hashioka et al.
Title Page
Abstract Introduction
Conclusions References
Tables Figures
◭ ◮
◭ ◮
Back Close
Full Screen / Esc
Printer-friendly Version Interactive Discussion
Discussion
P
a
per
|
Dis
cussion
P
a
per
|
Discussion
P
a
per
|
Discussio
n
P
a
per
|
silicate shells (opal) act as mineral ballast that increases the sinking speed of silici-fied particles (Klaas and Archer, 2002, Ploug et al., 2008). On the other hand, nano-and picophytoplankton aggregate into smaller particles (Guidi et al., 2009), which sink more slowly, and export production is lower in ecosystems dominated by these small phytoplankton.
5
In order to understand the mechanisms of phytoplankton competition, we distinguish between bottom-up and top-down control on biomass. In areas where bottom-up con-trol dominates, the phytoplankton biomass is primarily concon-trolled by phytoplankton pro-duction through photosynthesis according to environmental conditions, such as nutri-ent concnutri-entrations, light and temperature. In areas where top-down control dominates,
10
phytoplankton biomass is controlled by the strength of the grazing pressure. Based on these concepts, we quantitatively investigated the role of each ecophysiological pro-cess (physiological rate such as photosynthesis and life history rates such as mortality) in determining the community structure in the models.
2 Methods
15
2.1 Characteristics of the MAREMIP phase 0 PFT models
This section briefly summarizes the characteristics of four global PFT models: PISCES, NEMURO, PlankTOM5 and CCSM-BEC. A detailed description of the photosynthesis and grazing equations is given in the Appendices A and B, including the relevant pa-rameter values. For the detailed general descriptions of each model, we refer to the
20
indicated original publications (PISCES; Aumont et al., 2006, NEMURO; Kishi et al., 2007, PlankTOM5; Buitenhuis et al., 2010 and CCSM-BEC; Moore et al., 2004) and to the other intercomparison papers of MAREMIP phase 0 (Sailley et al., 2012; Vogt et al., 2012).
PISCES represents two phytoplankton functional types (pPFTs: silicifying
di-25
BGD
9, 18083–18129, 2012
Phytoplankton competition during
the spring bloom
T. Hashioka et al.
Title Page
Abstract Introduction
Conclusions References
Tables Figures
◭ ◮
◭ ◮
Back Close
Full Screen / Esc
Printer-friendly Version Interactive Discussion
Discussion
P
a
per
|
Dis
cussion
P
a
per
|
Discussion
P
a
per
|
Discussio
n
P
a
per
|
background primary production in many ocean basins, and most tropical areas) and two zooplankton functional types (zPFTs: micro- and mesozooplankton). Phytoplank-ton growth is limited by the availability of nutrients (NO3, NH4, PO4, Si, Fe), light and
temperature. For the nutrient limitation of photosynthesis, a Michaelis-Menten relation-ship is used (Michaelis and Menten, 1913). For the light limitation, the steady-state
5
solution of the photoacclimation process of Geider et al. (1998) is represented in this model. For the temperature dependency, a relationship based on the Q10 of Eppley
et al. (1972) is used. The C : N : P ratios for all PFTs are assumed constant, while the internal ratio of Fe : C, Chl : C and Si : C of phytoplankton are predicted by the model. PISCES is coupled to an ocean general circulation model (OGCM), NEMO version 3.2
10
(Madec, 2008) with a horizontal resolution of 2◦
×0.5∼2◦and 31 vertical levels.
NEMURO (Kishi et al., 2007) represents two pPFTs (diatoms and nanophytoplank-ton) and three zPFTs (micro-, meso- and macrozooplanknanophytoplank-ton). Phytoplankton growth is limited by the availability of nutrients (NO3, NH4, Si), light and temperature. A simplified formulation for the iron limitation of growth is employed in the original NEMURO used
15
during MAREMIP phase 0. For the nutrient limitation and temperature dependency of photosynthesis, similar types of relationships as those of PISCES are used, but with different parameter values. For light limitation, the relationship of Steel et al. (1962) is used. One of the characteristics of NEMURO is that mesozooplankton mainly repre-sents a type of copepods, which has ontogenetic vertical migration (i.e. Mackas and
20
Tsuda, 1999). Therefore, in the temperate and high latitude oceans (>30◦N) of the Northern Hemisphere, copepods appear in the surface ocean in April, and migrate into the deep ocean in September. The timing of zooplankton migration is opposite in the Southern Hemisphere (>30◦S). The C : N : Si ratios and Chl : C ratio for all PFTs are assumed constant in the model. The variables for the simulation of the carbon cycle
25
are introduced into the original NEMURO in Yamanaka et al. (2004). NEMURO is cou-pled to an OGCM, COCO (CCSR Ocean Component Model: Hasumi, 2006) version 3.4, which has a horizontal resolution of 1◦
×1◦and 54 vertical levels (Aita et al., 2003,
BGD
9, 18083–18129, 2012
Phytoplankton competition during
the spring bloom
T. Hashioka et al.
Title Page
Abstract Introduction
Conclusions References
Tables Figures
◭ ◮
◭ ◮
Back Close
Full Screen / Esc
Printer-friendly Version Interactive Discussion
Discussion
P
a
per
|
Dis
cussion
P
a
per
|
Discussion
P
a
per
|
Discussio
n
P
a
per
|
PlankTOM5 represents three pPFTs (diatoms, nanophytoplankton and coccol-ithophores as calcifiers) and two zPFTs (micro- and mesozooplankton). Phytoplank-ton growth is limited by the availability of nutrients (PO4, Si, Fe), light and temperature
with relationships similar to those used in the other models, but using a different pa-rameter set (Buitenhuis et al., 2010). The C : P ratios of all PFTs are fixed, while the
5
internal ratios of Fe : C, Chl : C and Si : C of phytoplankton are predicted by the model. PlankTOM5 is coupled to the NEMO OGCM version 2.3, with a horizontal resolution of 2◦
×0.5∼2◦and 31 vertical levels.
CCSM-BEC represents three pPTFs (diatoms, nanophytoplankton and diazotrophs as nitrogen fixers) and one generic zPFT (Moore et al., 2004). As in PISCES,
phy-10
toplankton growth is limited by the availability of nutrients (NO3, NH4, PO4, Si, Fe), light and temperature. The relationships of all limitation factors for photosynthesis are similar to those of PISCES and PlankTOM5, although the parameter values are diff er-ent. CCSM-BEC is coupled to the CCSM physical model with a horizontal resolution of 3.6◦
×0.8∼1.8◦and 25 vertical levels.
15
A hindcast experiment for the period of 1996–2007 was conducted by all groups. While each PFT model is coupled to a different physical model, all models are driven by a common forcing, the NCEP/NCAR data. Surface monthly averaged model output was stored for plankton biomass, nutrients and chlorophyll a (Chl a) concentrations and important physical and environmental variables (i.e. temperature, salinity, mixed
20
layer depth). Data were regridded onto a 1◦
×1◦ horizontal grid. We calculated
photo-synthesis and grazing rates off-line using the set of model equations and the data of the biogeochemical and physical output fields.
2.2 Estimated PFTs distribution from satellite observations
For the model evaluation, we used phytoplankton composition data estimated from
25
BGD
9, 18083–18129, 2012
Phytoplankton competition during
the spring bloom
T. Hashioka et al.
Title Page
Abstract Introduction
Conclusions References
Tables Figures
◭ ◮
◭ ◮
Back Close
Full Screen / Esc
Printer-friendly Version Interactive Discussion
Discussion
P
a
per
|
Dis
cussion
P
a
per
|
Discussion
P
a
per
|
Discussio
n
P
a
per
|
dinoflagellates, green algae, haptophytes, pico-eukaryotes, prokaryotes and Prochloro-coccus) using phytoplankton pigment data derived from High Performance Liquid Chro-matography (HPLC) in the world ocean. For diatoms, they proposed one global rela-tionship as follows:
(% of Diatoms)=[(1.3272+exp (−3.9828×[Chl]+0.1953))]−1×100. (1)
5
The Root Mean Square Errors (RMSE) of this estimation for diatoms was 6.3 % over the entire Chlarange observed in situ (0.02<Chla <4.26 mg Chl m−3). Based on this relationship with SeaWiFS satellite Chla, they estimated the monthly surface distribu-tion of the diatom fracdistribu-tion. Alvain et al. (2008) estimated the frequency of dominance
10
as the relative time in a month that a certain PFT constitutes the majority of biomass for the following 5 PFTs: diatoms, nanoeucaryotes,Prochlorococcus,Synechococcusand Phaeocystis-like taxa, using the PHYSAT algorithms to detect the major dominant phy-toplankton groups from anomalies of the water-leaving radiation measured by ocean color satellites. The PHYSAT method was evaluated using in situ measurements
(Al-15
vain et al., 2012), and the evaluation showed 73 % correct identification of dominance for diatoms and 82 % correct identifications of dominance for nanoflagellates. We es-timated the monthly averaged percentage of diatoms from the frequency of diatom dominance and the total Chlaconcentration of SeaWiFS.
(% of Diatoms)=FD×(Total Chl)
(Total Chl) ×100=FD×100 (2)
20
where FD is monthly mean frequency of diatom dominance normalized by the total number of days in a month.
2.3 Definition of the relative photosynthesis ratio
In order to understand the effect of bottom-up control on phytoplankton competition
25
BGD
9, 18083–18129, 2012
Phytoplankton competition during
the spring bloom
T. Hashioka et al.
Title Page
Abstract Introduction
Conclusions References
Tables Figures
◭ ◮
◭ ◮
Back Close
Full Screen / Esc
Printer-friendly Version Interactive Discussion
Discussion
P
a
per
|
Dis
cussion
P
a
per
|
Discussion
P
a
per
|
Discussio
n
P
a
per
|
rate of the current PFT models in MAREMIP phase 0 can be described with the com-mon formula;
(Photosynthesis rate)Pi =VPi
max×f(Nlim)Pi ×f(Llim)Pi ×f Tdep
Pi×[Pi] , (3) where VPi
max is the maximum photosynthesis rate, a constant for each phytoplankton
5
type Pi. In this equation, the maximum photosynthesis rate is limited by the nutrient and light limitation terms (i.e.f(Nlim)P
i and f(Llim)Pi) and modified by the temperature dependency of growth (i.e.f Tdep
Pi). In addition, the photosynthesis rate depends on
the concentration of each phytoplankton functional type [Pi]. To understand how envi-ronmental conditions affect the differences in photosynthesis rate, we use the specific
10
photosynthesis rate in d−1, which is the photosynthesis rate normalized by the concen-tration of each pPFT.
(Specific photosynthesis rate)Pi =(Photosynthesis rate)Pi/[Pi]
=VPi
max×f(Nlim)Pi ×f(Llim)Pi ×f Tdep
Pi. (4)
15
To quantify the effect of bottom-up control on phytoplankton competition, we define a “relative photosynthesis ratio” as follows:
(Relative photosynthesis ratio)=log10
(Specific photosynthesis rate)
D
(Specific photosynthesis rate)N
=log10(Specific photosynthesis rate)D−log10(Specific photosynthesis rate)N. (5)
20
In this equation, D represents diatoms, and N nanophytoplankton. As we use the log-arithms of the relative photosynthesis ratio, the relative photosynthesis ratio becomes positive when the specific photosynthesis rate of diatoms exceeds that of nanophyto-plankton. Conversely, negative values indicate an advantage of nanophytoplankton in photosynthesis. We estimated the relative photosynthesis ratio using monthly averaged
BGD
9, 18083–18129, 2012
Phytoplankton competition during
the spring bloom
T. Hashioka et al.
Title Page
Abstract Introduction
Conclusions References
Tables Figures
◭ ◮
◭ ◮
Back Close
Full Screen / Esc
Printer-friendly Version Interactive Discussion
Discussion
P
a
per
|
Dis
cussion
P
a
per
|
Discussion
P
a
per
|
Discussio
n
P
a
per
|
data of nutrients, light intensity, temperature and phytoplankton concentration for each model.
In order to identify the contribution of each term to the relative photosynthesis ratio separately, we decompose the logarithm of the relative photosynthesis ratio as follows:
(Relative photosynthesis ratio)=log10 VmaxD VmaxN
!
5
+log10 f(N
lim)D
f(Nlim)N
+log10 f(L
lim)D
f(Llim)N
+log10
f Tdep
D
f Tdep
N
!
. (6)
In this equation, the change in the relative photosynthesis ratio is determined as the sum of the individual (competition) terms. To represent the differences in physiology between diatoms and nanophytoplankton, each model used different limitation (or
de-10
pendency) terms with taxon-specific parameters (Appendix A). In PISCES, diatoms have the same maximum photosynthesis rate as nanophytoplankton. The difference in photosynthesis rate can only be caused by the differences in the nutrient and light dependencies. In NEMURO, the maximum photosynthesis rate and nutrient depen-dency terms are different for diatoms and nanophytoplankton. In PlankTOM5, the
max-15
imum photosynthesis rate, nutrient and light dependencies are different for all PFTs. In CCSM-BEC, the differences in PFTs are caused by the nutrient and light limitation terms. A common temperature dependency based on Eppley et al. (1972) is employed in all models, with the same parameters for diatoms and nanophytoplankton. Thus, the temperature dependency of the photosynthesis rate does not affect the phytoplankton
20
competition in the current PFT models in MAREMIP Phase 0, and it can be neglected in the subsequent analysis.
In an optimal environment without any nutrient and light limitations, diatoms have larger specific growth rates in NEMURO and PlankTOM5, due to the differences in the maximum photosynthesis rate, i.e. the relative photosynthesis ratios become 0.3
25
BGD
9, 18083–18129, 2012
Phytoplankton competition during
the spring bloom
T. Hashioka et al.
Title Page
Abstract Introduction
Conclusions References
Tables Figures
◭ ◮
◭ ◮
Back Close
Full Screen / Esc
Printer-friendly Version Interactive Discussion
Discussion
P
a
per
|
Dis
cussion
P
a
per
|
Discussion
P
a
per
|
Discussio
n
P
a
per
|
dominate barring differences in loss terms (e.g. mortality, aggregation, sinking, graz-ing). In PISCES and CCSM-BEC, the logarithm of the ratios is 0.0 as there are no diff er-ences in the maximum photosynthesis rate between diatoms and nanophytoplankton.
2.4 Definition of the relative grazing ratio
In order to understand the effects of top-down control on phytoplankton competition,
5
we compared the differences in grazing rate for diatoms and nanophytoplankton. The grazing rate on phytoplankton in the current PFT models in MAREMIP Phase 0 can be described by the following generic formula;
(Grazing rate)Zi
Pi =G Zi
max×f Tdep
Zi×f(Grazing preferences)
Zi
Pi ×[Zi] . (7)
10
The maximum grazing rate GZi
max is modified by a temperature dependency
term f Tdep
Zi and a term containing the grazing preferences of zooplankton
f(Grazing preferences)Zi
Pi. Here the grazing preferences also includes the saturation re-lationships of a Holling type II in PISCES and PlankTOM5 (Eq. B5), a Holling type III in CCSM-BEC (Eqs. B14 and B15) or an Ivlev equation in NEMURO (Eqs. B11 and B12).
15
In addition, the grazing rate depends on the concentration of each zooplankton [Zi].
In analogy to the specific photosynthesis rate for the bottom-up control, we defined the specific grazing rate in d−1, which is the grazing rate normalized by phytoplankton concentration.
(Specific grazing rate)Zi
Pi =
(Grazing rate)Zi
Pi
[Pi]
. (8)
BGD
9, 18083–18129, 2012
Phytoplankton competition during
the spring bloom
T. Hashioka et al.
Title Page
Abstract Introduction
Conclusions References
Tables Figures
◭ ◮
◭ ◮
Back Close
Full Screen / Esc
Printer-friendly Version Interactive Discussion
Discussion
P
a
per
|
Dis
cussion
P
a
per
|
Discussion
P
a
per
|
Discussio
n
P
a
per
|
Based on this specific grazing rate, we defined a “relative grazing ratio” for each zoo-plankton type as an indicator of top-down control as follows;
(Relative grazing ratio)Zi =log
10
(Specific grazing rate)Zi
N
(Specific grazing rate)Zi
D
=log10(Specific grazing rate)Zi
N −log10(Specific grazing rate)
Zi
D . (9)
5
The relative grazing ratio is mainly determined by the differences in the maximum graz-ing rate, in grazgraz-ing preferences and in the relative abundance of diatoms and nanophy-toplankton. The full equations for the relative grazing ratio are given in the Appendix B. Like for the relative photosynthesis ratio, a positive relative grazing ratio leads to an increase in the percentage of diatoms.
10
3 Results
3.1 Bloom magnitude and peak timing
All models reasonably reproduced the observed spatial patterns of maximum Chl a concentration during blooms (Fig. 1a) with high concentrations in the coastal regions and low concentrations in the open oceans. However, in the observations,
15
Chla concentrations in the coastal regions are much higher than those of the open oceans (e.g. models simulate a maximum of around 3 to 4 mg Chl m−3 in the coastal regions, but observations are over 10 mg Chl m−3 locally), and the gradient between on-shore and open ocean Chla is large. Models do not capture the observed patchi-ness of blooms. In the North Pacific, the main blooming area is situated in the Western
20
BGD
9, 18083–18129, 2012
Phytoplankton competition during
the spring bloom
T. Hashioka et al.
Title Page
Abstract Introduction
Conclusions References
Tables Figures
◭ ◮
◭ ◮
Back Close
Full Screen / Esc
Printer-friendly Version Interactive Discussion
Discussion
P
a
per
|
Dis
cussion
P
a
per
|
Discussion
P
a
per
|
Discussio
n
P
a
per
|
For SeaWiFS Chla, blooms reach their maximum concentration in April in the low lat-itude oceans, and in July and August in the high latlat-itude oceans of the Northern Hemi-sphere (Fig. 1b). In the western side of the North Pacific open ocean, blooms reach their maximum in September and October. This region corresponds to a High Nutrient Low Chl (HNLC; Martin et al., 1994) region. In the Southern Ocean, the blooms reach
5
their maximum in November and December and in the coastal regions in February and March. The seasonal shifts of blooming areas from low latitude to high latitude oceans are reasonably reproduced in the model results. In the HNLC region in the North Pa-cific, CCSM-BEC and PlankTOM5 captured the timing of the bloom maximum in fall well. In PISCES and NEMURO, the maximum concentrations during the spring bloom
10
are larger than those of the fall blooms in the HNLC regions.
3.2 Percentage of diatoms at the bloom maximum
To understand the contribution of diatoms chlorophyll to blooms, we compared the sim-ulated relative percentage of diatoms to the total phytoplankton Chla concentration at the peak of the bloom with the satellite estimates of Hirata et al. (2011) and
Al-15
vain et al. (2008). Hirata et al. (2011) shows a high fraction of diatoms of over 70 % in the coastal regions in the high latitude oceans (Fig. 2e). In addition, the percentage of diatoms in the North Pacific is much higher than that in the North Atlantic. These regional differences of the percentage of diatoms mainly correspond to the changes in Chlaconcentration, since the formulation of Hirata et al. (2011) is a function of the
20
total Chla concentration (Eq. 1). The percentage of diatoms deduced from the dom-inance frequency data in Alvain et al. (2008), however, indicates a lower percentage of diatoms of less than 20 % in the North Pacific and the North Atlantic during the maximum of the bloom. In the Southern Ocean, the estimated diatom percentage from Alvain et al. (2008) reached up to 80 % during the month of maximum Chla(Fig. 2f).
25
BGD
9, 18083–18129, 2012
Phytoplankton competition during
the spring bloom
T. Hashioka et al.
Title Page
Abstract Introduction
Conclusions References
Tables Figures
◭ ◮
◭ ◮
Back Close
Full Screen / Esc
Printer-friendly Version Interactive Discussion
Discussion
P
a
per
|
Dis
cussion
P
a
per
|
Discussion
P
a
per
|
Discussio
n
P
a
per
|
significant differences between the North Pacific, the North Atlantic and the Southern Ocean. The percentage of diatoms in NEMURO (Fig. 2b), in contrast, shows higher values in the North Pacific than in the North Atlantic, and the percentage of diatoms in the Southern Ocean exceeds 90 %. In CCSM-BEC (Fig. 2d), the percentage of di-atoms is higher in the open oceans in the North Pacific and in the North Atlantic. In the
5
Southern Ocean, the fraction of diatoms exceeds 90 % along the coastal regions. In PlankTOM5, the percentage of diatoms is lower than that of the other models (Fig. 2c). In parts of the Southern Ocean and the northern part of the North Atlantic, diatoms dominate with a percentage of 60 to 80 %. In the North Pacific, diatoms dominated only in a small part of the blooming regions.
10
The absolute values of the percentage of diatoms in PISCES, NEMURO and CCSM-BEC are close to the results of Hirata et al. (2011). The regional contrast between the North Pacific and the North Atlantic in NEMURO is consistent with the estimation of Hirata et al. (2011). On the other hand, the simulated percentage of diatoms in PlankTOM5 is close to the estimation from Alvain et al. (2008). The wide differences
15
between the satellite estimates preclude a quantitative assessment of the skill of the model.
3.3 Relationship between percentage of diatoms and magnitude of blooms
We investigated the relationships between the magnitude of blooms and the relative percentage of diatoms (Fig. 3) in three selected blooming regions: the North Pacific
20
(115◦E–120◦W, 20◦N–70◦N), the North Atlantic (80◦W–20◦E, 20◦N–80◦N), and the Southern Ocean (40◦S–90◦S). In each domain, we defined blooming areas as re-gions with surface Chl a concentrations of over 0.5 mg Chl m−3 at the peak timing of the bloom.
In Hirata et al. (2011), the percentage of diatoms increases from 20 % at
25
BGD
9, 18083–18129, 2012
Phytoplankton competition during
the spring bloom
T. Hashioka et al.
Title Page
Abstract Introduction
Conclusions References
Tables Figures
◭ ◮
◭ ◮
Back Close
Full Screen / Esc
Printer-friendly Version Interactive Discussion
Discussion
P
a
per
|
Dis
cussion
P
a
per
|
Discussion
P
a
per
|
Discussio
n
P
a
per
|
PISCES, NEMURO and CCSM-BEC are close to the result in Hirata et al. (2011), with simulate diatom percentages around 60 to 80 %.
In the estimation from the dominance frequency data of Alvain et al. (2008), there is no clear increasing trend of the percentage of diatoms with increasing Chla concen-tration. The spatial standard deviations of the percentage of diatoms are large (around
5
20 %) in all blooming areas, in particular in the Southern Ocean. We did not detect a statistically significant trend in the average percentage of diatoms as a function of increasing chlorophyll. In the range of lower Chl a concentration, the percentage of diatoms is similar to levels estimated using the algorithm of Hirata et al. (2011).
A common feature in all models is that the percentage of diatoms increases over
10
the entire Chla range of the blooms. The increasing trend in PISCES and NEMURO is particularly clear with small spatial standard deviations. In PlankTOM5 and CCSM-BEC, there is also an increasing trend of the percentage of diatoms with increase in the magnitude of blooms, but the trend is less clear than that of PISCES and NEMURO, because of large spatial standard deviations. In PlankTOM5, the regional differences
15
are large compared to the results of the other models with much higher diatom frac-tions in the Southern Ocean versus the North Pacific. In CCSM-BEC for Chla concen-trations >0.9 mg Chl m−3, the percentage of diatoms saturates around 60 %, and the percentage of diatoms in the North Pacific is lower than in the other regions, like in PlankTOM5.
20
4 Discussion
4.1 Effect of bottom-up control on the phytoplankton competition
4.1.1 Comparison of the relative photosynthesis ratio
In order to understand the effect of bottom-up control on phytoplankton competition during blooms, we compare the relative photosynthesis ratio (Eq. 5) in each of the
BGD
9, 18083–18129, 2012
Phytoplankton competition during
the spring bloom
T. Hashioka et al.
Title Page
Abstract Introduction
Conclusions References
Tables Figures
◭ ◮
◭ ◮
Back Close
Full Screen / Esc
Printer-friendly Version Interactive Discussion
Discussion
P
a
per
|
Dis
cussion
P
a
per
|
Discussion
P
a
per
|
Discussio
n
P
a
per
|
blooming regions among models at the time of the bloom maximum (Fig. 4). In PISCES, the specific photosynthesis rate of nanophytoplankton exceeds the rate of diatoms in all blooming regions (i.e. the relative photosynthesis ratio is negative over the entire range of the magnitude of blooms in Fig. 4a). Therefore, the high percentage of diatoms in many bloom regions with values over 50 % (Fig. 3a), cannot be explained by the diff
er-5
ence in the specific photosynthesis rate via bottom-up control. This result suggests the importance of top-down control governing the dominance of diatoms in PISCES. The relative photosynthesis ratio has significant regional differences, while the relationship in the percentage of diatoms showed a positive correlation with chlorophyll in all bloom-ing regions. Thus, the effect of bottom-up control in PISCES has an effect of varying
10
strength on the relative abundance of diatoms in different blooming region.
In contrast to PISCES, the specific photosynthesis rate of diatoms in NEMURO is larger than that of nanophytoplankton in all blooming regions (i.e. the relative photo-synthesis ratio is positive; Fig. 4b). In addition, the relative photophoto-synthesis ratio clearly increases with the magnitude of the bloom. This relationship is the same for all
bloom-15
ing regions, with small spatial standard deviations in the relative photosynthesis ratio. Therefore, the increase in the percentage of diatoms with increasing Chla(Fig. 3b) is reasonably explained by the effect of bottom-up control in NEMURO.
In PlankTOM5, the specific photosynthesis rate of nanophytoplankton exceeds that of diatoms, except for blooms with a magnitude of over 1.0 mg Chl m−3in the North
Pa-20
cific and over 1.3 mg Chl m−3 in the Southern Ocean (Fig. 4c). This relationship in the relative photosynthesis ratio is generally consistent with the results of the percentage of diatoms, i.e. nanophytoplankton dominates in most parts of the blooming regions (Fig. 3c). However, the regional differences in the percentage of diatoms are much larger than the differences in the relative photosynthesis ratio. In particular, in the North
25
BGD
9, 18083–18129, 2012
Phytoplankton competition during
the spring bloom
T. Hashioka et al.
Title Page
Abstract Introduction
Conclusions References
Tables Figures
◭ ◮
◭ ◮
Back Close
Full Screen / Esc
Printer-friendly Version Interactive Discussion
Discussion
P
a
per
|
Dis
cussion
P
a
per
|
Discussion
P
a
per
|
Discussio
n
P
a
per
|
region in PlankTOM5. The spatial standard deviations of the relative photosynthesis ra-tio are small compared to that of the percentage of diatoms, in contrast to the result in PISCES. Hence, the relative importance of bottom-up and top-down controls for the phytoplankton competition can vary between regions even within the same model.
In CCSM-BEC, the specific photosynthesis rate of nanophytoplankton exceeds the
5
rate of diatoms in all blooming regions except for a part of the Southern Ocean which has a chlorophyll concentration of about 1.0 mg Chl m−3(Fig. 4d). However, the percent-age of diatoms is much higher than expected from the differences in the relative pho-tosynthesis ratio, i.e. diatoms dominate in most of the regions of the Southern Ocean and the North Atlantic, and in regions with more than 1.0 mg Chl m−3in the North Pacific
10
(Fig. 3d). These results suggest the importance of top-down control for phytoplankton competition. One of the important characteristics in CCSM-BEC is the large spatial standard deviation of the relative photosynthesis ratio in the Southern Ocean and the North Atlantic compared to other models. This means that the ambient environmental conditions for phytoplankton growth differ considerably even in areas with the same
15
magnitude of blooms.
4.1.2 Comparison of the limitation factors of photosynthesis
The current PFT models employ the same types of bioclimatic relationships to describe the ecophysiological process of photosynthesis, and the parameters are chosen within the range of the observational data. However, as shown in Sect. 4.1.1, the response of
20
photosynthesis to the surrounding environments can be significantly different between models. This is because the relative importance of each limitation or dependency terms in the specific photosynthesis rate (i.e. the maximum photosynthesis rate, nutrient and light limitations and temperature dependency) differs between models and for different PFTs. The contributions of bottom-up control to the dominance of diatoms are
summa-25
rized in the upper part of Table 1.
BGD
9, 18083–18129, 2012
Phytoplankton competition during
the spring bloom
T. Hashioka et al.
Title Page
Abstract Introduction
Conclusions References
Tables Figures
◭ ◮
◭ ◮
Back Close
Full Screen / Esc
Printer-friendly Version Interactive Discussion
Discussion
P
a
per
|
Dis
cussion
P
a
per
|
Discussion
P
a
per
|
Discussio
n
P
a
per
|
saturation constant for nutrient uptake, and thus a growth advantage over the entire range of magnitudes of the bloom compared to diatoms. The nutrient limitation in the North Atlantic is stronger than that in the North Pacific and the Southern Ocean, re-sulting in the regional differences in the relative photosynthesis ratio in Fig. 4. The increasing trend of the relative photosynthesis ratio with an increasing magnitude of
5
the bloom is determined by the trend in nutrient limitation, as light limitation does not play an important role for the phytoplankton competition at the time of the maximum of the bloom.
In NEMURO, the relative photosynthesis ratio is determined by the balance between the difference in the maximum photosynthesis rate and the difference in nutrient
limita-10
tion. The difference in the maximum photosynthesis rate contributes to the dominance of diatoms across the entire range of bloom magnitudes. On the other hand, nanophy-toplankton has an advantage in the nutrient limitation term due to their smaller half-saturation constant. In NEMURO, there are no significant regional differences in the strength of nutrient limitation between blooming regions. As the maximum
photosyn-15
thesis rate is constant over the entire range of bloom magnitudes, the increasing trend of the relative photosynthesis ratio is determined by the relative difference in nutrient limitation between pPFTs.
The relative photosynthesis ratio in PlankTOM5 is mainly determined by the balance between differences in the maximum photosynthesis rate and nutrient limitation. The
20
increasing trend in the relative photosynthesis ratio with the bloom magnitude is also due to the differences in nutrient limitation, since the difference in the maximum pho-tosynthesis rate is constant. The effect of the nutrient limitation terms on the relative photosynthesis ratio is similar in PlankTOM5 and NEMURO. However, since the diff er-ence in the maximum photosynthesis rate of diatoms and nanophytoplankton is smaller
25
BGD
9, 18083–18129, 2012
Phytoplankton competition during
the spring bloom
T. Hashioka et al.
Title Page
Abstract Introduction
Conclusions References
Tables Figures
◭ ◮
◭ ◮
Back Close
Full Screen / Esc
Printer-friendly Version Interactive Discussion
Discussion
P
a
per
|
Dis
cussion
P
a
per
|
Discussion
P
a
per
|
Discussio
n
P
a
per
|
In CCSM-BEC, the difference in nutrient limitation plays an important role for the dominance of nanophytoplankton. The difference in the light limitation plays a signifi-cant role for the dominance of diatoms in the wide range of bloom magnitudes in the North Atlantic and the Southern Ocean. The increasing trend of the relative photosyn-thesis ratio through the Chlarange of small blooms (less than 0.8 mg Chl m−3) in the
5
Southern Ocean and the North Atlantic is mainly caused by the light limitation trend, since there is no clear increasing trend in the nutrient limitation.
4.2 Effect of top-down control on phytoplankton competition
4.2.1 Relationship between zooplankton concentration and the magnitude of blooms
10
The effect of top-down control on phytoplankton competition is determined by the rel-ative abundance of the different zPFTs, and their characteristic grazing preference for each pPFT. First, we compared the relationship between total zooplankton con-centration and the bloom magnitude in different blooming regions as an indicator of the strength of the grazing pressure on phytoplankton (Fig. 6). In PISCES, NEMURO
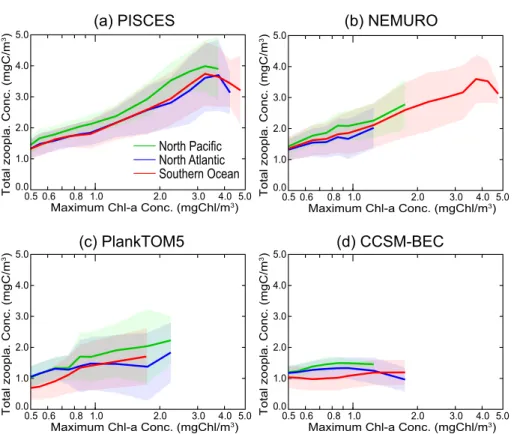
15
and PlankTOM5, the total zooplankton concentration increases with the magnitude of the bloom, but CCSM-BEC shows a constant zooplankton concentration for all bloom magnitudes. The regional differences in averaged zooplankton concentration are not large in all models (less than 1 mg C m−3). But the zPFT concentrations in PISCES and NEMURO are larger than those of PlankTOM5 and CCSM-BEC even for the same
20
bloom magnitude. The difference in zooplankton biomass between models, and its vari-ation with bloom magnitude may be due to the differences in ecosystem structure for the higher-trophic levels. For example, whereas PISCES and PlankTOM5 represent two size classes of zooplankton (micro- and mesozooplankton), NEMURO also in-cludes macrozooplankton, and CCSM-BEC represents one generic zooplankton.
Fur-25
BGD
9, 18083–18129, 2012
Phytoplankton competition during
the spring bloom
T. Hashioka et al.
Title Page
Abstract Introduction
Conclusions References
Tables Figures
◭ ◮
◭ ◮
Back Close
Full Screen / Esc
Printer-friendly Version Interactive Discussion
Discussion
P
a
per
|
Dis
cussion
P
a
per
|
Discussion
P
a
per
|
Discussio
n
P
a
per
|
These top predators, and hence their effect on the lower trophic ecosystem are cur-rently not included in our models. The characteristics of the grazing interactions in the current ecosystem models in MAREMIP Phase 0 are discussed in more detail in Sailley et al. (2012).
Each zooplankton type (i.e. micro-, meso-, macro- or generic zooplankton) has
dif-5
ferent grazing preferences for each phytoplankton types, and the food-web structures also differ between models. We compared the zooplankton composition in blooming regions for each model (Fig. 7).
In PISCES, the zooplankton composition does not (clearly) depend on the bloom magnitude. Regionally, the contribution of microzooplankton to the total zooplankton
10
concentration is 60 to 70 % in the Southern Ocean, 50 to 60 % in the North Atlantic and 40 to 50 % in the North Pacific. The spatial standard deviation in the percentage of microzooplankton tends to increase for larger blooms. In NEMURO, the percentage of microzooplankton increases with decreasing bloom magnitude (10 to 30 %). The percentage of meso- and macro-zooplankton increases from 30 to 40 % and from 40 to
15
50 % with increasing bloom magnitude, respectively. The difference in the percentage of microzooplankton between the bloom regions is small with small spatial standard deviation. In the North Pacific, the percentage of macrozooplankton is 20 % higher than in other regions. In PlankTOM5, the percentage of microzooplankton tends to increase with the bloom magnitude. Although the spatial standard deviations are much
20
larger than in the other models, there are significant regional differences in PlankTOM5. Microzooplankton constitutes 50 to 70 % in the Southern Ocean, 30 to 60 % in the North Atlantic and 20 to 30 % in the North Pacific.
4.2.2 Comparison of the relative grazing ratio
To understand the effects of the characteristic grazing preferences for each zPFT on
25
BGD
9, 18083–18129, 2012
Phytoplankton competition during
the spring bloom
T. Hashioka et al.
Title Page
Abstract Introduction
Conclusions References
Tables Figures
◭ ◮
◭ ◮
Back Close
Full Screen / Esc
Printer-friendly Version Interactive Discussion
Discussion
P
a
per
|
Dis
cussion
P
a
per
|
Discussion
P
a
per
|
Discussio
n
P
a
per
|
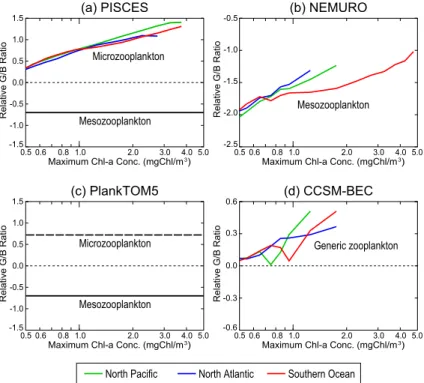
(Fig. 8). The contributions of top-down control to the dominance of diatoms are sum-marized in the lower part of Table 1.
In PISCES, the specific grazing rate of microzooplankton on nanophytoplankton is larger than that on diatoms (i.e. the relative grazing ratio is positive in Fig. 8a), and increases with the bloom magnitude. The grazing pressure on nanophytoplankton
in-5
creases with the bloom magnitude, but less so for the grazing pressure on diatoms, because the larger cells of diatoms escape grazing by microzooplankton. This is be-cause this model explicitly parameterizes a maximum concentration of diatoms for grazing (see Eq. B8 in Appendix B; Aumont et al., 2006). However, both phytoplank-ton concentrations increase with the bloom magnitude (Figs. 6a and 7a). In contrast
10
to microzooplankton, mesozooplankton prefers diatoms (i.e. the relative grazing ratio is negative in Fig. 8a), and the relative grazing ratio is constant. In PISCES, microzoo-plankton has a 5.7 times higher maximum grazing rate than mesozoomicrozoo-plankton, and the concentration of microzooplankton is similar to that of mesozooplankton during blooms (Fig. 7a). As a result, top-down control by microzooplankton significantly contributes
15
to the dominance of diatoms in PISCES. This is the reason why diatoms widely domi-nate in most of the bloom areas in PISCES (Fig. 3a), despite their disadvantage in the uptake of nutrient during photosynthesis (Fig. 4a)
In NEMURO, macrozooplankton and microzooplankton graze only on diatoms and nanophytoplankton, respectively. Mesozooplankton graze on both pPFTs. As can
20
be seen in the relative grazing ratio (Fig. 8b), mesozooplankton prefers diatoms to nanophytoplankton, and the preferential grazing pressure on diatoms decreases with the bloom magnitude. This is because the grazing rate of zooplankton saturates at high phytoplankton concentrations in the grazing equation of Ivlev (1955) in NEMURO (Sail-ley et al., 2012). As a result, the grazing by mesozooplankton on diatoms saturates in
25
BGD
9, 18083–18129, 2012
Phytoplankton competition during
the spring bloom
T. Hashioka et al.
Title Page
Abstract Introduction
Conclusions References
Tables Figures
◭ ◮
◭ ◮
Back Close
Full Screen / Esc
Printer-friendly Version Interactive Discussion
Discussion
P
a
per
|
Dis
cussion
P
a
per
|
Discussion
P
a
per
|
Discussio
n
P
a
per
|
relative abundance of zooplankton (Fig. 7b). Since meso- and macrozooplankton pre-fer diatoms for grazing, which dominate in all bloom region (70 to 90 % of the total zooplankton concentration), top-down control tends to decrease the percentage of di-atoms. However, even in small blooms where the relative photosynthesis ratio is close to 0.0 (i.e. there are no differences in the specific photosynthesis rate between diatoms
5
and nanophytoplankton) and the relative grazing ratio is at it’s most negative value (i.e. the effect of the grazing selection is maximum), the percentage of diatoms is close to 50 %. Therefore, the dominance of diatoms during blooms in NEMURO is mainly deter-mined by bottom-up control. This result is consistent with the analysis of Hashioka and Yamanaka (2007b), i.e. the growth phase of blooms is mainly determined by bottom-up
10
control, while top-down control has an important role in the termination of blooms. PlankTOM5 has the same type of grazing equations as PISCES, although parameter values are different (see Appendix B). In addition, this model does not limit microzoo-plankton grazing to prey concentrations below a predefined maximum concentration of diatoms (Eqs. B7 and B8 in Appendix B). Microzooplankton and mesozooplankton
15
prefer nanophytoplankton and diatoms, respectively. But the relative grazing ratio for both zooplankton types does not depend on the bloom magnitude (Eqs. B7 and B9 in Appendix B), and hence, there are no regional differences in this ratio. The effect of top-down control on the competition between different phytoplankton is determined by the selective grazing of each zooplankton type, and by the relative abundance between
20
micro- and mesozooplankton. As shown in Fig. 7c, the relative abundance of microzoo-plankton and mesozoomicrozoo-plankton is significantly different between different bloom regions (i.e. mesozooplankton is dominant by 80 % in the North Pacific, while microzooplank-ton is dominant by 60 to 70 % in the Southern Ocean). As a result, preferential grazing on nanophytoplankton by microzooplankton leads to the increase in the percentage of
25
BGD
9, 18083–18129, 2012
Phytoplankton competition during
the spring bloom
T. Hashioka et al.
Title Page
Abstract Introduction
Conclusions References
Tables Figures
◭ ◮
◭ ◮
Back Close
Full Screen / Esc
Printer-friendly Version Interactive Discussion
Discussion
P
a
per
|
Dis
cussion
P
a
per
|
Discussion
P
a
per
|
Discussio
n
P
a
per
|
are no significant differences in the specific photosynthesis rate between bloom re-gions (Fig. 4c). Therefore, top-down control in PlankTOM5 plays an important role for the regional differences in the phytoplankton competition.
CCSM-BEC represents the differences in the grazing rate on each pPFT using graz-ing switchgraz-ing by one generic zooplankton, while the other three models represent
5
the grazing selections by different zooplankton types (i.e. microzooplankton prefers nanophytoplankton, and meso- or macro- zooplankton prefer diatoms). As CCSM-BEC has only one zooplankton type, the difference in the relative grazing ratio directly rep-resents the effect of top-down control (Fig. 8d). The specific grazing rate of generic zooplankton on nanophytoplankton is larger than that on diatoms (i.e. the relative
graz-10
ing ratio is positive in Fig. 8d). As a result, top-down control leads to an increase in the percentage of diatoms in all bloom regions. As in PISCES, the relative photosyn-thesis ratio of nanophytoplankton exceeds the one of diatoms in most of the blooming region in CCSM-BEC (Fig. 4d), and the dominance of diatoms is mainly determined by top-down control.
15
5 Conclusions
We investigated the mechanisms governing the competition between diatoms and nanophytoplankton during blooms, using four different PFT models. The model com-parison shows that top-down control had an important role for the dominance of di-atoms during blooms in PISCES and CCSM-BEC. On the other hand, bottom-up
con-20
trol was important for the dominance of diatoms in NEMURO and for the dominance of nanophytoplankton in PlankTOM5. These differences in the mechanisms suggest that the response of marine ecosystems to climate change could significantly differ among models.
For further understanding, one of the key points to clarify whether the
phytoplank-25
BGD
9, 18083–18129, 2012
Phytoplankton competition during
the spring bloom
T. Hashioka et al.
Title Page
Abstract Introduction
Conclusions References
Tables Figures
◭ ◮
◭ ◮
Back Close
Full Screen / Esc
Printer-friendly Version Interactive Discussion
Discussion
P
a
per
|
Dis
cussion
P
a
per
|
Discussion
P
a
per
|
Discussio
n
P
a
per
|
nanophytoplankton. In NEMURO and PlankTOM5, diatoms have larger values for the maximum photosynthesis rate than nanophytoplankton. On the other hand, there are no differences in the respective parameters in PISCES and CCSM-BEC. During the blooming season, when nutrient and light limitation are less important, the difference in the maximum photosynthesis rate is potentially the main determinant of PFT
dom-5
inance. Therefore, efforts to evaluate the difference in the maximum growth rate in both observational and the modeling studies are required (e.g. Le Qu ´er ´e et al., 2012, reported a higher maximum rate for diatoms).
In top-down control, as common features among models, microzooplankton prefers to graze nanophytoplankton, and mesozooplankton prefers diatoms, and
microzoo-10
plankton has a larger maximum grazing rate than mesozooplankton. These proper-ties are consistent with observational studies for microzooplankton (Buitenhuis et al., 2010); mesozooplankton (Buitenhuis et al., 2006) and macrozooplankton (Moriarty, 2009). Currently, there are large uncertainties in our understanding of the importance of top-down control as a function of the relative concentration of each zPFT type. In
15
PISCES and PlankTOM5, micro- and mesozooplankton concentrations have the same order of magnitude, consistent with observations (Buitenhuis et al., 2006, Buitenhuis et al., 2010). In NEMURO, the proportion of microzooplankton is smaller than that of meso- and macrozooplankton. The MARine Ecosystem DATabase (MAREDAT, which aims at the construction of a World Atlas of biomass of PFTs; ESSD special issue,
20
2012) will further our understanding of the ocean ecosystem, including the role of top-down control for the competition between phytoplankton. In the case where only one generic zooplankton is modeled, such as in CCSM-BEC, the evaluation of the diff er-ences in the maximum grazing rate for each phytoplankton type is important to deter-mine the strength of the top-down control, as the grazing preferences strongly depend
25
on the phytoplankton composition as prey.
BGD
9, 18083–18129, 2012
Phytoplankton competition during
the spring bloom
T. Hashioka et al.
Title Page
Abstract Introduction
Conclusions References
Tables Figures
◭ ◮
◭ ◮
Back Close
Full Screen / Esc
Printer-friendly Version Interactive Discussion
Discussion
P
a
per
|
Dis
cussion
P
a
per
|
Discussion
P
a
per
|
Discussio
n
P
a
per
|
output over the period of 1985–2100) aims to further our understanding of plankton competition, and to project potential impacts on marine ecosystem associated with future climate changes.
Appendix A
Photosynthesis equations and parameters
5
The photosynthesis rate for each phytoplankton (Pi) in the current PFT models can be described with the following common formula;
(Photosynthesis rate)Pi =V Pi
max×f(Nlim)Pi ×f(Llim)Pi ×f Tdep
Pi×[Pi] . (A1)
The maximum photosynthesis rate,VPi
max, is limited by nutrient and light limitation terms,
10
f(Nlim)Pi and f(Llim)Pi, and modified by the temperature dependency term, f Tdep
Pi.
In addition, the photosynthesis rate is dependent on the phytoplankton concentration of each pPFT, [Pi].
The nutrient limitation term is represented in a similar form for all models, although the limiting nutrients may differ (see Table A1; we only show the parameters which have
15
differences between diatoms and nanophytoplankton,i.e., the maximum photosynthe-sis rate and half saturation constants for nutrient uptake).
f(Nlim)Pi =min
VNO3
Pi +V
NH4
Pi ,V
Fe
Pi ,V
PO4
Pi ,V
Si
D
. (A2)
VPNutrient
i corresponds to the strength of limitation by each nutrient. The limitation by
20
nitrate and ammonium is represented as follows in PISCES and CCSM-BEC;
VNO3
Pi +V
NH4
Pi =
KPi
NH4
NO3 +KPi
NO3[NH4]
KPi
NO3K
Pi
NH4+K
Pi
NH4
NO3 +KPi
NO3[NH4]
BGD
9, 18083–18129, 2012
Phytoplankton competition during
the spring bloom
T. Hashioka et al.
Title Page
Abstract Introduction
Conclusions References
Tables Figures
◭ ◮
◭ ◮
Back Close
Full Screen / Esc
Printer-friendly Version Interactive Discussion
Discussion
P
a
per
|
Dis
cussion
P
a
per
|
Discussion
P
a
per
|
Discussio
n
P
a
per
|
whereKPi
Nutrient is a half saturation constant for nutrient uptake. In NEMURO, the
limita-tion term for nitrogen is represented by a Michaelis-Menten formula with an ammonium inhibition term for nitrate uptake (Wroblewski, 1977) as follows;
VNO3
Pi +V
NH4
Pi =
[NO3]
KPi
NO3+[NO3]
exp−ΨPi[NH4]
+ [NH4]
KPi
NH4+[NH4]
. (A4)
5
For other nutrients, the limitations are represented using the Michaelis-Menten formula.
VFe,PO4 orSi
Pi =
[Fe,PO4 orSi]
KPi
Fe,PO4 orSi+[Fe,PO4 orSi]
. (A5)
In PISCES, the half saturation constants for iron and silicate depend on phytoplankton concentration and the annual maximum of silicate concentration, respectively.
10
KPi
Fe= KPimin
Fe min ([Pi], [Pimax])+K
Pimax
Fe max (0, [Pi]−[Pimax])
min ([Pi], [Pimax])+max (0, [Pi]−[Pimax])
, (A6)
KSiD=KSimin+KSimax [Simax] 2
KSi2+[Simax]2
. (A7)
For the parameterization of light limitation, PISCES and CCSM-BEC employed the relationship of Geider et al. (1998), and it depends on the photosynthesis rate, a Chl/C
15
ratio in phytoplankton and the light intensity given as PAR.
f(Llim)P i =
1−exp
−α ChlC Pi[PAR]
VPi
max×f(Tdep)×f(Nlim)Pi
BGD
9, 18083–18129, 2012
Phytoplankton competition during
the spring bloom
T. Hashioka et al.
Title Page
Abstract Introduction
Conclusions References
Tables Figures
◭ ◮
◭ ◮
Back Close
Full Screen / Esc
Printer-friendly Version Interactive Discussion
Discussion
P
a
per
|
Dis
cussion
P
a
per
|
Discussion
P
a
per
|
Discussio
n
P
a
per
|
αis an initial slope of the P-I curve. PlankTOM5 employs the same types of relationship, but it uses a balanced growth solution for the light limitation:
f(Llim)Pi = 1−exp
−α(PAR)Pi[PAR]
VPi
max
!!
, (A9)
In NEMURO, light limitation is parameterized using the relationship of Steel (1962) as
5
follows;
f(Llim)Pi = [PAR]
Iopt
exp 1−[PAR]
Iopt !
. (A10)
Iopt is an optimal light intensity for photosynthesis, and the parameter values are the
same for diatoms and nanophytoplankton. For the temperature dependency term, the
10
Q10 relationship of Eppley (1972) is employed in all the models, and there are no