(Cerrado Sensu stricto) in southeast Brasil.
1 1 1 1 1
Humberto R. da Rocha , Helber C.Freitas , Rafael Rosolem ,Robinson I.N. Juárez , Rafael N. Tannus , Marcos
2 2 1
A.Ligo , Osvaldo M. R.Cabral , Maria A.F. Silva Dias
1 Departamento de Ciências Atmosféricas, IAG/Universidade de São Paulo 2 EMBRAPA Meio Ambiente
Palavras-chave:Palavras chave: Cerrado, savana, fotossíntese, respiração, sequestro de carbono, correlação dos
vórtices turbulentos.
Key Words:Cerrado, savanna, photosynthesis, soil respiration, carbon sequestration, eddy correlation.
Abstract
The technique of eddy correlation was used to measure the net ecosystem exchange over a woodland savanna (Cerrado Sensu stricto) site (Gleba Pé de Gigante) in southeast Brazil. The data set included measurements of climatological variables and soil respiration using static soil chambers. Data were collected during the period from 10
-2 -1
October 2000 to 30 March 2002. Measured soil respiration showed average values of 4.8 molCO m s year round. Its 2 -2 -1
seasonal differences varied from 2 to 8 molCO m s (Q = 4.9) during the dry (April to August) and wet season, 2 10
respectively, and was concurrent with soil temperature and moisture variability. The net ecosystem CO flux (NEE) 2
variability is controlled by solar radiation, temperature and air humidity on diel course. Seasonally, soil moisture plays a strong role by inducing litterfall, reducing canopy photosynthetic activity and soil respiration. The net sign of NEE is
-1 -1
-negative (sink) in the wet season and early dry season, with rates around -25 kgC ha day , and values as low as 40 kgC ha
1 -1
day . NEE was positive (source) during most of the dry season, and changed into negative at the onset of rainy season. At critical times of soil moisture stress during the late dry season, the ecosystem experienced photosynthesis during daytime, although the net sign is positive (emission). Concurrent with dry season, the values appeared progressively positive from 5
-1 -1
to as much as 50 kgC ha day . The annual NEE sum appeared to be nearly in balance, or more exactly a small sink, equal to
-1 -1
0.1 0.3 tC ha yr , which we regard possibly as a realistic one, giving the constraining conditions imposed to the turbulent flux calculation, and favourable hypothesis of succession stages, climatic variability and CO fertilization.2
Resumo
A técnica de correlação dos vórtices turbulentos (eddy correlation) foi utilizada para se estimar a produtividade líquida do ecossistema (PLE) em uma área de Cerrado Sensu stricto, no sítio experimental da Gleba Pé de Gigante, no sudeste do Brasil. O conjunto de dados coletados incluiu também medidas de variáveis climatológicas e de respiração do solo com câmaras estáticas, no período de 10 de Outubro de 1999 a 30 de Março de 2002. A respiração do solo média anual
-2 -1 -2 -1
foi de 4.8 molCO m s , com diferenças sazonais que variaram entre 2 a 8 molCO m s durante a estação seca (Abril a 2 2
Agosto) e na estação chuvosa, respectivamente, por um padrão de sensível correlação com a temperatura (Q =4.9) e 10
umidade do solo. Com base nos fluxos atmosféricos de CO , a PLE mostrou uma variabilidade no ciclo diurno grandemente 2
controlada pela radiação solar, umidade e temperatura do ar. Na escala sazonal, a umidade do solo foi uma variável de alta correlação com a PLE, que aparentemente induziu a queda de folhedo, redução da atividade fotossintética e da respiração
-do solo. O sinal da PLE foi negativo (sumi-douro) na estação chuvosa e no início da estação seca, com taxas de -25 kgCha
1 -1 -1 -1
dia , e máximos de até 40 kgCha dia . Na estação seca o sinal foi positivo (emissão), o que foi revertido logo no início das chuvas. No fim da estação seca, em dias de grande estresse hídrico, ainda observou-se a resposta da fotossíntese na escala do ecossistema, mesmo tendo sido positiva a PLE. Paralelamente ao decorrer da estação seca, a PLE progressivamente
-1 -1
aumentou de 5 até 50 kgCha dia . A soma annual da PLE mostrou-se aproximadamente balanceada, tendo sido no entanto,
-1 -1
sob um viés de maior precisão, um pequeno mas significativo sumidouro de 0.1 0.3 tCha ano . Consideramos a hipótese de um pequeno sumidouro como possivelmente realista, dadas às restringentes correções impostas no cálculo dos fluxos turbulentos, e algumas hipóteses favoráveis de sucessão de estágios do Cerrado, fertilização de CO atmosférico e 2
variabilidade climática.
Date Received 03-01-2002 Revised 06-20-2002 Accepted 06-30 2002
1. Introduction
The Cerrado is the largest savanna region in South
6 2
America. Originally covering about 2x10 km in Brasil, including the central region and parts of southeast, it has been reduced to only 20% at present (Mittermeier et al. 2000).
Several experimental studies have adressed the carbon exchange using automatic monitoring in the Amazon rain forests as part of the LBA Project (LBA 1996; Grace et al. 1996, Malhi et al. 1998, Goulden et al. 2002, Miller et al. 2002, Rocha et al. 2002). Pioneer studies in Brazillian savanna were reported by Miranda et al. (1997) in a Cerrado Sensu stricto in the central region, and by Vourlitis et al. (2001) in a Cerradão vegetation at the ecotone between tropical savanna and rain forest in Central Brasil. Related investigations in South America about water cycle and carbon stocks in tropical savanna were developed in Venezuela (San Jose et al. 2001; Szarzynsky and Anhuf et al. 1999).
In central Brazil the savanna is considered as the most threatened biome on the continent given the rapid expansion of agricultural frontiers (Silva and Bates 2002). The southeast region, originally covered with tropical evergreen forest along the coast (Mata Atlântica), tropical decidous forests and savanna (Ratter 1992; Eiten 1972), is today dominated mostly by pasture, sugar cane and other crops (Rocha et al. 2000). Only a few and small fragments of Cerrado vegetation are conserved in the southeast.
I n O c t o b e r 2 0 0 0 w e e s t a b l i s h e d a micrometeorological field station to make continuous observations of the local climate and the fluxes of heat, water and CO between the atmosphere and a Cerrado 2
Sensu stricto, located at the largest fragment remaining in the southeast (Santa Rita do Passa Quatro city, SP). In this paper we focus on the diel and seasonal patterns of CO2
exchange (soil respiration and net ecossystem exchange), microclimate and soil moisture observed between 2000 and 2001.
2. Site and methods
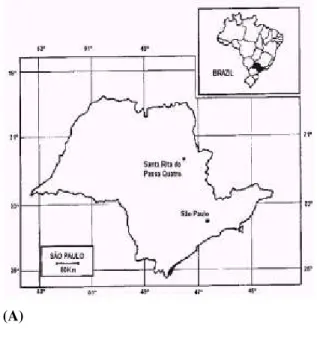
The study was developed in the Vassununga state park, owned by the Instituto Florestal / São Paulo state, and located at Santa Rita do Passa Quatro city, SP, Brasil (Fig. 1a). The experimental site was placed at a reserve's part Gleba Pé de Gigante, a contiguous 1060 ha area of savanna
o o o o
vegetation (47 34' - 47 41' W, 21 36' - 21 44' S). Batalha (1997) reports coexistence of a few savanna phisiognomies within the Gleba Pé de Gigante: (i) Cerradão (11%) 10 m tall trees, nearly closed canopies, dense litter; (ii) Cerrado Sensu stricto (79%) closed scrub and small ( 5m tall) trees, sparse taller trees ( 7-10 m tall), dense herbaceous story; (iii) Campo cerrado (8%) - open scrubland, sparse 7-10 m tall trees, dense herbaceous story; (iv) others Campo sujo and seasonal forest (2%). The prevailing soil type is quartz sand. The altitude within the reserve varies between 660 and 730 m.
(B)
Figure 1. (a) Geographical position of the experimental site in southeast Brasil; (b) photograph of micrometeorological tower at the Gleba Pé de Gigante.
An instrumental platform including automatic measurements of soil and climate variables, and turbulent atmospheric fluxes based at a scaffolding tower (21 m height, Hi-Way Access Intl) was stablished at the
o o
northwest sector (21 37'9'' S, 47 37'58'' W) in October 2000 (Fig. 1b). A data logger (Campbell CR10X) sampled the weather station and soil data every 15 s and recorded the averages on a 10 min basis. A full list of variables monitored at the site is presented in Table 1. The data discussed in this paper includes part of Table 1 and was collected from 10 October 2000 to 10 February 2002.
Variable (description) Units Sensor / Device
Air temperature o
C Psychrometer CSI HMP45C
Air humidity gkg-1 Psychrometer CSI HMP45C
Precipitation mm Texas 500
Wind direction degrees RM Young
Wind speed ms-1
RM Young
Global solar radiation W m-2
LiCor 200X
PAR radiation W m-2
Licor Quantum
Net radiation W m-2 REBS
Soil moisture m3
m-3
FDR CS615
Soil temperature o
C CSI T108
Soil CO2 efflux kgCO2m-2 s-1 IRGA EGM-2 PPsystems
Latent heat flux W m-2
Eddy correlation
Sensible heat flux W m-2
Eddy correlation
Ground heat flux W m-2 REBS HFT3
Air total CO2 flux kgCO2m-2 s-1 Eddy correlation
Litterfall kgCm-2
Littertraps
Litter decomposition kgCm-2
Litterbags
Soil carbon % Soil samples
Streamflow m-3
s-1
Water level gauge
Table 1: Collected variables at the observational site
An eddy correlation device measured the atmospheric turbulent fluxes of sensible heat, evapotranspiration, momentum flux and total CO flux. It 2
included a three-dimensional sonic anemometer (A1012R Gill Solent), an infra-red gas analyser for CO /H O (Li-2 2
COR 6262), an eletromechanical system to control the pumped air from the sampler tube and record the 5 Hz frequency raw data. The eddy correlation method calculates the vertical flux of atmospheric carbon dioxide,
Fc, taking the correlation between the deviations of the 30-minute average of the vertical wind speed (w´) and the air CO concentration ,2
, (1)
a term usually referred to as the net ecosssystem exchange (NEE), which theoretically accounts for the sum of gross primary productivity, plant respiration and soil respiration. The fluxes reported here were calculated using the 30-minute covariance following the detrending algorithms, coordinate rotation and frequency corrections described in Moncrieff et al. (1997). Soil respiration and soil temperature at 1 cm were measured using a portable static chamber (SRC-1, PP Systems, UK) sealed to the soil surface in closed circuit to a infra-red gas analyser (Parkinson, 1981), with an encapsulated thermistor placed near the chamber. Measurements with the chamber were carried out on a weekly basis over a set of seventeen collars fixed near the tower by April 2000.
(r c´ )
'
'
c
w
c
F
=
r
2.1 Models
We have used numerical parameterizations of CO2
flux for purposes of its calibration and validation at the field site. The algorithm employed is the SiB2 model (Sellers et al. 1996), which is a physical-mathematical concept of the soil-vegetation system for the exchanges of canopy radiative transfer, rainfall interception, soil hydraulic difusion, and a stomatal conductance-photosynthesis function. The physiology is approached as of Collatz et al. (1991, 1992). Gross leaf assimilation rate is constrained by three factors: the assimilation rates defined by the photosynthetic enzyme system; the amount of PAR absorbed by leaf chlorophyll; and the capacity of the leaf to export or utilize the products of photosynthesis.
The SiB2 model was run in its off-line mode, i.e., forced by in situ observations of meteorological 30-minute average variables, namely: global solar radiation, air temperature and humidity, wind speed and precipitation. Model validation requires optimisation methods and have been employed using eddy correlation data in tropical rain forests and pastureland (Rocha et al. 1996a,b). We used similar techniques to validate the model for the field site in order to fill gaps in the flux data.
3. Results and discussion 3.1 Climate
The climate is typically warm and wet in the summer, and mild and dry in the winter. In the period of observations a dry season was defined from May to September (Fig. 2a), an observation which approaches the regional climatology. The accumulated precipitation from 13 January 2001 to 12 January 2002 was 1322 mm (a period when the rainfall data had no gaps), which was a little below than the annual average (1478 mm) collected at the nearest station 20 km apart (DAEE, Santa Rita do Passa Quatro city). The wet season, during October to April, was marked by continuous days of precipitation, and showed a
-1
few cases of observations larger than 40 mm day . We note
-1
two days with precipitation around 30 mm day in June, during the early dry season. It is not anomalous to observe sparse rainfall during the dry season, given the climatological precipitation in May, June, July and August are 43, 33, 20 and 21 mm, respectively.
Incoming solar radiation varied seasonally as the consequence of a maximum top of atmosphere irradiance in 22 December and a minimum in 22 June. The data appeared to be enveloped within the range between 30
-2 -1
(summer) to 18 (winter) MJm day . Values as low as 4
-2 -1
MJm day were noticed in overcast days (Fig. 2b).
The amplitude of canopy top air temperature varied with
o
dropping the daily minimum during the winter as much as
o
10 C (Fig. 2c). During the wet season, however, the effect of cold fronts, as well as generally the existence of rainy wet days, appears to drop the daily maximum temperature
o
(which was observed to be roughly about 3 to 6 C on the day-to-day variability). The presence of a semi-permanent large scale high pressure system over the region is typical during the autumn and wintertime, which is also suggested in Fig. 2d. Such a pattern is broken by the beggining wet season, as noticed by the onset of precipitation (Fig. 2a) and the seasonal surface air pressure changes ocurred by middle September (Fig. 2d). The year round amplitude of air pressure variation was about 15 hPa. The turning point in the dynamics of large scale air masses at the dry to wet season transition has also an effect in the measured top canopy wind speed. The daily average wind was around 3
-1
ms during most of the wet season and early dry season (Fig. 3a). During July to October, as precluded in the season
-1
transition, it increased by as much as 5 ms during several days. The prevailing surface winds are from the east, which result from the northern branch of the semi-permanent high pressure in the south Atlantic Ocean (Fig. 4). A small component is noted from the north-west direction at daytime, which is more typical at the proximity of precipitation systems, as convective clouds or cold fronts. At night it is noted the easterlies shift to south-east winds (Fig. 4b).
The reduced air temperature in the winter was
-1 Figure 2. (a) Daily precipitation measured at 21 m, in mm day ; (b) Daily
-2 -1
mean solar radiation at 21 m, in MJm day ; (c) Maximum (upper thick
o
line) and minimum (lower thin line) daily air temperatures at 21 m, in C; (d) Daily mean atmospheric pressure at 21 m height (in hPa). Data are shown for the period 15 Nov 2000 to 15 Jan 2002.
-1
Figure 3. (a) Daily mean wind speed measured at 21 m, in ms ; (b) Daily maximum (upper thin line) and minimum (lower thick line) relative air
-humidity at 21 m, in %; (c) Daytime total net radiation at 21 m, in MJm
2 -1 -2 -1
day ; (d) Nighttime total net radiation at 21 m, in MJm day . Data are shown for the period 15 Nov 2000 to 15 Jan 2002.
Figure 4. Prevailing wind direction (in degrees) during (a) daytime and (b) nighttime period, based on 30-minute average values measured at 21 m.
concurrent with reduced air humidity. Maximum daily relative humidity measured at top canopy varied from 100% (usually at night) in the wet season to about 60% in the dry season (Fig. 3b). As well, the minimum relative humidity varied with maxima daily temperature, from 50% to 15% year round.
Net radiation is the energy available to drive the air, soil and biomass heating, the water evaporation and the biophysical processes of transpiration and photosynthesis. Its seasonal course was well correlated with the solar radiation, as expected. The total daytime net radiation
-varied from 10 (in the winter) to 22 (in the summer) MJm
2 -1
day , as suggests the envelope of Fig. 3c. Clear nights have usually a larger loss of thermal infra-red energy thus reducing the net radiation and dropping the minimum air temperature. The nighttime net radiation is typically negative and during winter was markedly much lower ( -3
-2 -1 -2 -1
MJm day ) than in the wet season ( 1 MJm day ), as shown in Fig. 3d.
3.2 Seasonal and diel courses
The variation of soil moisture in time is the balance between the inputs of precipitation and the losses of evapotranspiration and drainage. In the transition 2000/2001 wet season, the near surface (30 cm) soil moisture recharge was observed by early December. At the deeper levels (2.5 m) however, it lagged behind by roughly a month later. In the 2001/2002 wet season, differently, the recharge appeared earlier in time, as the onset of the wet season was markedly earlier.
On the seasonal basis, a marked control of soil moisture in the temporal evolution of the average 30-minute CO fluxes is suggested in Fig. 5. Peak daytime 2
-2 -1
uptake varied mostly between 15 and 30 molCO m s in 2
the wet season, whereas nighttime emission ranged
-2 -1
tipically between 0 and 15 molCO m s (Fig. 5c). A broad 2
reduction in the daily amplitude concurred with the developing dry season. By September the fluxes showed a positive sign, that is, suggesting a net emission of CO . 2
Likewise, such smooth and continuous trend of decreasing uptake after May and towards the dry season, was similarly shown by the evapotranspiration. Maximum daytime latent
-2
heat flux varied from 200 to 600 Wm in the wet season, while in the late dry season the peaks were as low as 100
-2
Wm (Fig. 5b). We note from visual observations during site visits that during the dry season the vegetation experienced the fall of leaves. Most, if not all of the trees, are deciduous and a dramatic reduction in leaf area index was observed. The herbaceous layer also experienced the drying of leaves.
The CO flux diel course in the high wet season 2 -2 -1
showed daytime uptake of about 22 molCO m s on the 2
days 10 and 11 April 2001 (Fig. 6). Whilst these days had absence of rainfall, the 10th was mostly clear and the 11th was partially cloudy during daytime, as noticed by the oscillations in the solar radiation march. The CO flux was 2
closely related to the intensity of solar radiation and evapotranspiration (Fig. 6b). While the air specific humidity substantially decreased during daytime from 17
-1
to 14 g kg , the soil moisture depletion was also observed, noticeably in the shallow layers (30 cm), and with less evidence at the 2.5 m depth (Fig. 6a). The reduction in soil moisture is the response of water withdrawal by the root system. The decreasing air humidity is suggested to play a significant control in stomatal control and consequently in leaf carbon assimilation during these events. At night the fluxes were positive, with values of approximatelly 5
-2 -1
molCO m s . 2
At the end of dry season the diel course indicated
3 3
Figure 5. (A) Daily average volumetric soil moisture, in m m , for a level at 30 cm depth (coarse line) and at 200 and 250 cm (thin lines); (b)
30--2
minute average values of latent heat flux, in W m ; (c) 30-minute average
-2 -1
values of eddy CO flux, in mol CO m s . Data are shown for the period 2 2
15 Nov 2000 to 10 Dec 2001.
Figure 6. Diel course (Local Time) of 30-minute (a) (left axis) volumetric
3 3
soil moisture, in m m , for a level at 30 cm depth (black dots) and at 250 cm
1
(open dots), and (right axis) air specific humidity, in gkg (square dots);
-2 -1
(b) (left axis) eddy CO flux, in mol CO m s (black dots); (right axis) 2 2 -2
positive (emission) fluxes. During the days 08 and 09 October 2001 the CO fluxes ranged between -2 and 4 2
-2 -1
molCO m s (Fig. 7b). These days showed the least 2
ecosystem functionality in terms of CO assimilation. 2
These days showed the least ecosystem functionality in terms of CO assimilation. It is noteworthy to mention that 2
despite the prevailing positive fluxes, the CO flux was 2
noticeably more negative after sunrise, which is very presumably the response of photosynthesis. In other words, Fig. 7b suggests there are trees assimilating carbon despite the general aspect of dryness in the vegetation. The positive fluxes are simply the fact that soil and plant respiration rates overcome photosynthesis during those days.
Radiation, temperature and air humidity were the main controllers of day-to-day variation in the top canopy measured CO fluxes. Soil moisture exerts a strong control 2
on the seasonal basis. During the dry season, the concurrent litterfall helps to increase (positively) the fluxes by reducing photosynthetic canopy activity and increasing decomposition.
At the night, between day 08 to 09, the fluxes
-2 -1
increased smoothly up to values as high as 4 molCO m s 2
(Fig 7). In the previous night, however, it peaked following the pattern of the friction velocity (Fig. 7a). This correlation between the nighttime flux and the turbulent variable poses a weakeness in this data to represent realistically the ecosystem CO nighttime flux. The 2
increasing friction velocity means more windy turbulence is generated at the canopy top. Consequently a well mixed layer between the ground and through the canopy air column is established. Given our measurements did not Figure 7. Diel course (Local Time) of 30-minute (a) (left axis) friction
1
velocity measured at 21 m, in ms (black dots); (b) (left axis) eddy CO 2 -2 -1
flux, in mol CO m s (black dots); (right axis) solar radiation (thin line) 2 -2
and latent heat flux (square dots), in W m . Data are shown for the days 8 and 9 October 2001.
include a CO vertical profile in the instrumental platform, 2
which could in theory account the storage in the canopy layer during these calm nights, the nighttime fluxes as shown are possibly underestimated.
3.3. Soil respiration
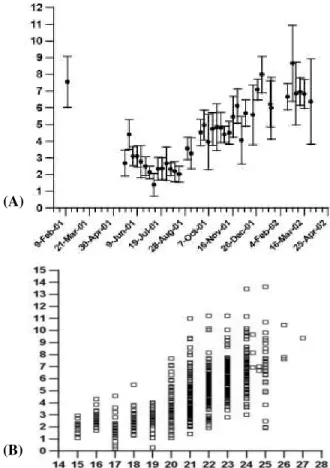
Independent from the eddy correlation measurements, the daily average soil respiration collected on a weekly basis varied between the minimum of 2 (in
-2 -1
July 2001) to a maximum of 8 molCO m s (in the high 2
wet season), as shown in Fig. 8a. Soil respiration is the continuous loss of CO by the respiration of roots, 2
microbes, soil fauna and carbon oxidation. It depends largerly on the ecosystem photosynthetic activity as well as leaf and litter decomposition. Therefore variables such as soil temperature and soil moisture ought to be major environmental controls. The average value was equal to 4.8
-2 -1
molCO2 m s year round. Compared to measurements using similar methods (static portable chambers) in other tropical biomes, such average ranked roughly in an intermediate position between primary forests and active pasturelands (Table 2). The estimate of Meir et al. (1996) for similar vegetation was taken only in one month (April
-2 -1
Figure 8. Soil respiration rates, in mol CO m s , (a) as daily averages 2
and as a function of time with the respective daily standard deviation; (b) as instant values and as a function of instant soil temperature at 1 cm
o
depth, in C.
(A)
1993), which is less representative of the yearly average. The increasing standard deviation as observed along the developing wet season (Fig. 8b) regards the increasing spatial variability prone to occur in those circumstances.
The comparison of soil respiration measurements with the correspondent soil temperature at 1 cm expressed a great deal of correlation (Fig. 8b). The data were used to fit an exponential relationship using the daily average values, which resulted in R = exp( 0.1589 T - 1.8859), (Q = 4.9; s 10
2
n = 40; R = 0.755), where R is the soil respiration in
-2 -1 o 2
molCO m s ; T the soil temperature at 1 cm, in C; R is 2 s
the correlation coeficient calculated over n points; and Q10
is the coefficient of the relative increase in soil respiration
o
for a temperature increase of 10 C. The Q value calculated 10
here is surprisingly large for a tropical ecosystem, which usually is between 2 to 4. The site is however near the tropics where the amplitude of soil temperatures are much larger than those observed near lower latitudes, for example in the Amazon. We do not know of other published values for comparison.
Forest Secon dary forest
Cerrado Sensu stricto
Active pasture
Degra ded pasture
Site Source
5.5-6.7
-- 3.2-5.3 2.5-3.2 Paragominas Trumbore et al. (1995)
5.5 - - - - Ji-Paraná Meir et al
(1996)
- - 3.0 - - Brasília Meir et al
(1996) 5.2 4.7 - 3.9 2.6 Paragominas Davidson et
al (2000)
- - 4.8 ± 2.2 - - Santa Rita
Passa Quatro
(this study)
Table 2: Average soil respiration estimated in this work and in other
-2 -1
similar works for Amazonian ecosystems (in molCO m s ).2
3.4. Daily and annual sums
Calculating the annual sum of the half hour CO2
average fluxes provides a particular estimate of how much carbon is possibly being emitted to the atmosphere (ecosystem is a source) or assimilated by the surface (ecosystem is a sink). Interannual variability can change the estimated amount, and even its sign (positive or negative), giving the plausible natural changes of ecosystem's recruitment and mortality rates, as well as variations in climate.
The raw data set as presented in Fig. 5 may not be sufficient to achieve a realistic annual sum estimate, for several reasons. A first one refers to missing flux intervals in the yearly record. A second one would be the lack of the CO storage term measurements in the canopy profile. This 2
term is supposed to account, at least partially, on the effect of processes not detected by the instruments located at the top canopy when the surface layer is stable, which is prone to happen typically on calm nights. A third reason regards some evidence raised for the ecossystem CO loss, also on 2
calm nights, as shown by the reduced flux mainly in tall forest canopies. In other words, it apparently suggests the
use of the eddy flux corrected by the storage term may not estimate all ways of exchange between the biological processes and the atmosphere. An alternative to adress such problem has been suggested by using the so called u *
(friction velocity) filter, which removes the biased data that causes flux underestimation on the accumulated time series (Goulden et al. 1996, Miller et al. 2002). The question might very likely be site specific, depending on local relief and canopy architecture, between others.
Besides the aforementioned uncertainties in the annual sum, there are others related to the calculation of the individual average fluxes. These are namely the instrumental design and operation, and the approach to calculate the mathematical covariances. It has been noticed that low frequency contributions to the flux may be missed when insufficient averaging times are used (Sakai et al. 2001; Finnigan et al. 2002). In this case, the use of periods longer than 30-minute may be a way to better estimate the fluxes. Also, the method of detrending to ensure stationarity is in the realm of discussions. Despite that, Miller et al. (2002) compared linear detrending and block average removal for a data set in the tropical forest, and did not find significant differences on the annual sum.
Filling the gaps of a time series for the purposes of annual sum is not a simple task. Using daily accumulations calculated on periods near the gaps can provide a first alternative, although it does not solve the problem of day-to-day variability. In the present study, a broad variation ocurred on the CO diel course as well as on the seasonal 2
patterns, and substantial differences can occur on time scales within a week. Such approach may introduce biases even more significant than the several uncertainties already involved in the experimental methodology. We used a biophysical surface-atmosphere model to provide the estimated fluxes during the gaps (see 2.2), in parallel with the soil respiration model fitted with our observations at the site. Net ecosystem assimilation (gross photosynthesis minus plant and soil respiration) is calculated during daytime, and soil and plant respiration during nighttime. The model was calibrated to account for the entire range of seasonal variability and was thus validated for the specific site and year. Forcing the model with canopy top 30 min average climate variables provided an estimate of the fluxes on the same time scale used in gap-free days.
The treatment of calm nights was approached by checking the u threshold sensitivity on the nighttime eddy *
fluxes and its comparison to model calculations. In this comparison the model is concerned as the best estimate of the 'true' flux, as it was based on independent field measurements and validated for the site. The plot of the nocturnal eddy fluxes and the model fluxes, constrained by
-1
u between 0 and 0.1 ms , cleared indicated the eddy fluxes *
underestimated the model (Fig. 9a). Sequentially, similar comparisons taking the u values constrained between 0.1 *
-1 -1
and 0.2 ms (Fig. 9b), 0.2 and 0.3 ms (Fig. 9c) and 0.3 and
-1
-1
range of u between 0.4 and 0.5 ms (Fig. 9e). *
The amount of data involved at each comparison in Fig. 9 obviously reduces as the threshold increases. For instance, taking the threshold equal to 0.1, 0.2, 0.3, 0.4, 0.5
-1
and 0.6 ms , the removal percentage of the nocturnal eddy fluxes w as 48, 64, 80, 90, 95 and 98%, respectively.
We calculated the annual sums replacing the nocturnal eddy flux during weakly mixed periods with values provided by the calibrated model. The replacement was made sequentially, taking different u threshold filters. *
For illustration, the simple accumulation of the raw data (no gap filling and no filter) resulted in an annual sum of 3.2
-1 -1
tC ha yr (Fig. 10). The filters produced outstanding changes in the annual sums, as well as changed the curve
Figure 9. (y axis) Nighttime CO flux modelled (SiB2 plant respiration 2
and soil respiration based on exponential curve fitted from observations) against (abscissa) measured eddy CO flux, compared for events 2
-1
constrained by a limited range of friction velocity u (in ms ) between (a) *
0 to 0.1; (b) 0.1 to 0.2; (c) 0.2 to 0.3; (d) 0.3 to 0.4; (e) 0.4 to 0.5 and (f) 0.5 to 0.6. The 1:1 proportion is the dashed line.
-1 Figure 10. Annual sum of 30-minute net ecosystem exchange, in tC ha , for the eddy raw data (thin line), and with gap-filled data constrained by u *
1
star filter with minimum threshold of 0.1 to 0.6 ms (as shown at the right of thick lines).
-1
shape of accumulations. At the 0.1 ms threshold, the sum
-1 -1
resulted in a negative flux of -2.2 tC ha yr , which
-1 -1
increased to about 1.2, -0.5, -0.1 and +0.2 tC ha yr for
-1
thresholds increasing from 0.2 to 0.5 ms , respectively. The variations between the annual sums that resulted with the use of increasing u filter tend to change in an inverse *
proportion, a result that Miller et al. (2002) also observed. This is partially explained by the fact that less and less nocturnal data are removed, consequently reducing the variations in the accumulations. It seems reasonable to think there should be a balance between disregarding bad data when the well mixed layer hypothesis does not work well, and keeping good data as much as possible. Neglecting good data can possibly increase the uncertainties in the annual sum. A point we search for is whether any filter can tell us where the optimal balance is.
-1
The u threshold betwen 0.4 and 0.5 ms was *
where the nocturnal eddy fluxes compared best the 'true' flux (Fig. 9e). At this stage, the annual sum showed roughly
-1
a limit where there was a small sink (at 0.4 ms ), or on the
-1
other hand, a small source (at 0.5 ms ), as shown in Fig. 10. While increasing the u threshold results in neglecting the *
eddy night-time flux, those should be kept as long as they do not mean actual underestimation. It has been said this filter can compensate the lack of nocturnal storage
measurement, which is supposed to correct the night-time emission under weak mixing. Nonetheless, an important issue is that the amount of stored CO in the canopy is not 2
changing with time, regardless the air column is well mixed or not. As well, the nocturnal storage can simply become negative for a point in u variation, what means the night-*
time turbulence is venting some of the stored CO . In the 2
latter case, the storage correction might reduce the emission indeed. Based on this, we think a defensible estimate for the annual would be to select the variation where the u threshold minimizes the night-time flux *
-1
-1
lower limit (0.4 ms ) as the most likely value that would less neglect good data. This would lead to an annual sum
-1 -1
equal to 0.1 0.3 tC ha yr . The uncertainty was proposed by the variation betwen the annual sums calculated with the
-1
0.5 and 0.4 ms thresholds.
-1
Using the threshold of 0.4 ms we calculated a continuous time series of the net ecosystem exchange. In the wet season, the estimated uptake averaged varied
-1 -1
-around -25 kgC ha day with values as low as 40 kgC ha
1 -1
day (Fig. 11). The changes ocurring with the developing dry season are remarkable. In early May, negative fluxes of
-1 -1
about 5 kgC ha day .are observed. They tend to increase progressively until middle August to values as large as 50
-1 -1
kgC ha day . The turning point between source and sink happens by early October. It appeared noteworthy that the transition sink to source took a little longer than the opposite. It is possibly explained by the rapid greening of the leaves during the onset of wet season, whereas the leaves fall at slower rates.
4. Conclusions
We have estimated the net ecosystem exchange
o
over a Cerrado Sensu stricto in southeast Brazil (21 S) and emphasized the outstanding relationship of NEE functionality with the precipitation pattern: it appears to be a sink (source) well correlated with the wet (dry) season. Sink functionality may extend a little further in the early dry season. A similar pattern has been observed by Miranda
o
et al. (1997) at a same biome in central Brazil (16 S), while
o
Vourlitis et al. (2001), over a Cerradão site (11 S), have
Figure 11. Daytime integrated values of net ecosystem exchange, in in
-1 -1
kgC ha day . Using gap-filled data constrained by the u threshold of 0.4 * 1
ms . Data are shown for the period 10 Oct 2000 to 10 Dec 2001.
particularly pointed out the dry and early wet season as the time of the year where net emission to the atmosphere prevail over assimilation. These three reports agree about the strong seasonality of NEE, mainly as compared to other measurements in Amazonian tropical forests (see introduction).
Our calculated annual sum over the Cerrado Sensu stricto suggests average NEE is nearly in balance, or
-1
more exactly a very small sink of 0.1 tC ha . Similarly, Vourlitis et al. (2002) suggest a Cerradão site was also in balance after measurements between August 1999 and July 2001. It seems worthwhile to mention those authors report a very small difference between gross ecosystem exchange
-1
and ecosystem respiration, that is, 0.05 tC ha , which ultimately means a weak although significant sink exists. In summary, these two independent studies over tropical savanna biomes show them to be apparently in balance, although small sinks were mathematically calculated.
That poses the question a small but significant carbon sink is realistic over the Cerrado, including all corrections involved in the eddy correlation approach to estimate annual NEE. We show arguments such hypothesis is viable, particularly for the Cerrado Sensu stricto site discussed in this paper. The Cerrado Sensu stricto, in general, can be viewed as an ecotone between the Campo Limpo and the Cerradão (Coutinho, 1978). Mostly, the classification of Cerrado biomes takes the canopy height as the indication to differ the several succession stages, as grass-scrub and scrub-tree stories might be common between several classes (Pivelo and Coutinho, 1996). The succession to stages with taller trees, and generally more biomass, should not be guaranteed. Limitations would be imposed by the soil type, that influence the nutrient cycle and available soil moisture - the latter is ultimately a consequence of precipitation regime and water available capacity. Fires would disturb the natural succession development on the short and medium term, although on the long term (decades to centuries) the Cerrado species are supposed to be adapted (Coutinho, 1978; Delitti et al. 2001). The mechanism of succession stages in the Cerrado biome has neither a complete agreement nor a comprehensive description in the literature, what makes the issue a challenging one.
The site Gleba Pé de Gigante might have been under some level of disturbance about at least 50 years ago, mostly used as natural pastures for cattle grazing, while fires and logging were not noticed on the very long term (Eng. Everton Ribeiro, personal communication). The soil type (mostly quartz sand very low water capacity) is not a favourable one for plants during dry spells, which consequentely is a limitation for achieving higher levels of sucession. However, the calculated sink is roughly 0.5 % of total biomass (based on estimates in the range of 17 to 25 tC
-1
Buckeridge and Aidar this issue). We are not aware neither of significant climatic anomalies (local temperature and rainfall) during the period of measurements, nor the response of natural species to CO in environment 2
conditions, mainly due the lack of information. It makes the issue of climate forcings and variability a key one to investigate in future analysis.
.
5. Acknowledgements
We acknowledge the Fundação de Amparo à Pesquisa e Desenvolvimento do Estado de São Paulo (FAPESP) (Projeto 99/11215-9) and the Conselho Nacional de Pesquisa e Desenvolvimento (CNPq) ( Projetos 469492/2000 and 000522082/97) for funding the activities of this work. We thank the collaboration with the Instituto Florestal/SMA/SP to carry on the logistics and use of facilities at the Vassununga State Park, and particularly Eng. Everton Ribeiro (Vassununga State Park chief) for conducting the local support. We would like also to thank Humberto Mesquita and Marisa Bittencourt (IB/USP) for helping on the site selection and site information.
6. References
A n h u f , D . , T . M o t z e r , R . Rollenbeck,B.Schroder,J.Szarzinsky 1999. Water budget of the Surumoni crane site (Venezuela).
Selbyana, 20:1, 179-185.
Batalha, M.A. 1997. Análise da vegetação da ARIE Cerrado Pé-de-Gigante. Dissertação de Mestrado. Instituto de Biociências / USP.
Castro E. A. and Kauffman J. B., 1998. Ecosystem struture in the Brazilian Cerrado: a vegetation gradient of aboveground biomass, root mass, and consumption by fire. Journal of Tropical Ecology, 14, 263-283 Collatz, G.J., J. T. Ball, C. Grivet, J.A.Berry, 1991.
Physiological and environmental regulation of stomatal conductance, photosynthesis and transpiration: a model that includes a laminar boundary layer. Agricultural and Forest
Meteorology, 54: 107-136.
Collatz, G.J., M.Ribas-Carbo, J.A.Berry, 1992. Coupled photosynthesis-stomatal conductance model for leaves of C4 plants. Aust. J. Plant Physiol., 19: 519-538.
Coutinho, L.M. , 1978. O Conceito de Cerrado. Revista
Brasileira de Botânica, 1, 17-23.
Delitti W. B. C. , Pausas J. G. , Burger D. M., 2001. Belowground biomass seasonal variation in two Neotropical savannahs ( Brazilian Cerrados) with different fire histories. Ann. For. Sci., 58, 713-721. Davidson, E. A, L. V. Verchot, J. H. Cattanio, I. L.
Ackerman, J. E. M. Carvalho. Effects of soil water content on soil respiration in forests and cattle pastures of eastern Amazonia. Biogeochemistry, 48: 53-69, 2000
Eiten, G. 1972. The cerrado vegetation of Brazil. The
Botanical Review, 38, 201-341.
Finnigan, J.J., R. Clements, Y. Malhi, R. Leuning, and H.A. Clough, 2002. A re-evaluation of long-term flux measurement, Submitted to Boundary Layer Meteorology.
Goulden, M.L., J.W. Munger, S.-M. Fan, B.C. Daube, and S. C. Wofsy. 1996. Measurements of carbon sequestration by long-term eddy covariance: Methods and a critical evaluation of accuracy. Global
Change Biology 2:169-182.
Goulden, M. L., S.D. Miller, M.C. Menton, H.R. da Rocha, H.C. Freitas. 2002 Physiological Controls on Tropical Forest CO2 Exchange. Submitted to Ecological Applications.
Grace, J., Y. Malhi, J. Lloyd, J. McIntyre, A.C. Miranda, P. Meir, and H.S. Miranda. 1996. The use of eddy covariance to infer the net carbon dioxide uptake of Brazilian rain forest. Global Change Biology 2:208-217
LBA, 1996. The Large Scale Biosphere-Atmosphere Experiment in Amazonia (LBA), Concise Experimental Plan. Compiled by the LBA Science Planning Group. Doccument available at CPTEC/INPE, Cachoeira Paulista, SP, Brazil.
M a l h i , Y . , A . D . N o b r e , J.Grace,B.Kruijt,M.G.P.Pereira,A.Culf,S.Scott. Carbon dioxide transfer over a central amazonian rain forest. Journal of Geophysical Research, 103, D24:31593-31612, 1998
Meir, P., J. Grace, A. Miranda and J. Lloyd. Soil respiration in a rainforest in Amazonia and in Cerrado in Central Brazil. In Amazonian Deforestation and Climate, eds J.Gash, C. Nobre, J. Roberts and R. Victoria, p. 319-329, 1996.
Miller, S.D., M.L. Goulden, M.C. Menton, H.R. da Rocha, and H.C. Freitas. 2002. Annual CO2 Exchange by a tropical Forest. (Journal of Ecological Applications, in press)
Miranda, A.C., H.S. Miranda, J. Lloyd, J. Grace, J.A., Francey,J.R., McIntyre, P. Meir, P. Riggan, R. Lockwood, J. Brass, 1997. Fluxes of carbon, water and energy over Brazilian cerrado: an analysis using eddy covariance and stable isotopes. Plant, Cell and
Environment, 20: 315-328.
Mittermeyer,R.A.,N.Myers,C.G.Mittermeyer, 2000. Hotspots: earth's biologically richest and most endangered terrestrial ecoregions. Mexico City, CEMEX.
Moncrieff, J.B., J.M. Massheder, H. de Bruin, J.Elbers, T. Friborg, B. Heusinkveld, P. Kabat, S. Scott, H. Soegaard and A. Verhof 1997. A system to measure surface fluxes of momentum, sensible heat, water vapour and carbon dioxide. Journal of Hydrology, 189, 589-611.
Parkinson, K.J., 1981. An improved method for measuring soil respiration in the field. Journal of Applied
Pivelo, V. R. and L.M. Coutinho, 1996. A qualitative successional model to assist in the management of B r a z i l i a n c e r r a d o s . F o re s t E c o l o g y a n d
Management, 87, 127-138
Ratter, J.A. 1992. Transitions between cerrado and forest vegetation in Brazil. In Nature and dynamics of
forest-savanna boundaries, (eds P.A. Furley, J.
Proctor and J.A. Ratter), p. 417-429. Chapman & Hall, London.
Rocha, H.R., M.L. Goulden, S.D. Miller, M.C. Menton, L.D.V.O Pinto, H.C Freitas, A.M.S. Figueira. 2002. Seasonality of water and heat fluxes over a tropical forest in eastern Amazonia. Submitted to Ecological Applications.
Rocha, H. R., O.M.R. Cabral, M.A.F. Silva Dias, M.A.Ligo, J.A. Elbers, H.C. Freitas, C. von Randow, O. Brunini, 2000. Atmospheric CO fluxes and soil 2
respiration over sugar cane in southeast Brazil. in
Global Climate Change and Tropical Ecossystems, p.
405-414. eds. R. Lal, J. Kimble, B. Stewart, CRC Press, Boca Raton, FL.
Rocha, H. R. da, P.J. Sellers, C. J. Collatz, I.R. Wright, J. Grace, 1996a. Calibration and use of the SiB2 model to estimate water vapour and carbon exchanges in the Abracos' forest sites. in Amazon Deforestation and
Climate, eds. J.C.H. Gash, C.A. Nobre, J.M. Roberts
and R. Victória. John Wiley & Sons, Chichester, UK, p. 459-472.
Rocha, H.R. da, C.A. Nobre, J.P. Bonatti, I.R. Wright, I.R., P.J. Sellers. 1996b. A vegetation-atmosphere interaction study for Amazonian deforestation using field data and a single column model. Quarterly
Journal of the Royal Meteorological Society: 122,
567-598, 1996.
Sakai, R.K., D.R. Fitzjarrald, and K.E. Moore. 2001. Importance of Low-frequency contributions to eddy fluxes observed over rough surfaces. Journal of
Applied Meteorology, 40:2178-2191.
San Jose, J.J., M.L.Meirelles, R.Bracho and N Nikonova, 2001. A comparative analysis of the flooding and fire effects on the energy exchange in a wetland community (Morichal) of Orinoco Llanos. Journal of
Hydrology, 242, 228-254.
Sellers, P. J., D.A. Randall, C.J. Collatz, J.A. Berry, C.B. Field, D.A. Dazlich, C. Zhang, G.D. Collelo, 1996. A revised land surface parameterization (SiB2) for atmospheric GCMs, Part I: Model formulation. J.
Climate, 9, 676-705.
Silva, J.M.C. and J.Bates, 2002. Biogeographic patterns and conservation in south america cerrado: a tropical savanna hotspot. BioScience, 52(3):, 225-233. Szarzinsky, J. and D.Anhuf 2001. Micrometeorological
conditions and canopy energy exchange of a neotropical rain forest (Surumoni crane project -Venezuela). Plant ecology, 153, 231-239.
Trumbore, S. E., E. A Davidson, P. B. Camargo, D. C. Nepstad, L. A Martinelli. Below ground cycling of carbon in forests and pastures of eastern Amazonia.
Global Biogeochemical Cycles, 9: 515-528, 1995
Vourlitis, G., N.Priante Filho, M.M.S.Hayashi, J.S.Nogueira,F.T.Caseiro and J.H.Campelo Jr, 2001. Seasonal variations in the net ecosystem CO2 exchange of a mature amazonian transitional tropical forest (Cerradão). Functional ecology, 15 338-395. Vourlitis, G., N.Priante Filho, M.M.S.Hayashi,
J.S.Nogueira,F.T.Caseiro and J.H.Campelo Jr, 2002. The role of seasonal variations in meteorology on the net CO2 exchange of a brazilian transitional tropical forest. In II Scientific Conference LBA (Large scale biosphere-atmosphere experiment in Amazonia), Manaus, 9-11 July, 2002.
Title:
Authors:
Measurements of CO exchange over a woodland 2
savanna
Humberto R. da Rocha(et al)
Date Received 03-01-2002 Revised 06-20-2002 Accepted 06-30 2002
(Cerrado Sensu stricto) in southeast Brasil.
Http://www.biotaneotropica.org.br/v2n1/pt/abstract?artic le+BN01702012002
Biota Neotropica, Vol. 2, number 1 , 2002