DISSERTAC¸ ˜AO
Mestrado em Engenharia Inform´
atica - Computa¸c˜
ao M´
ovel
Multi-sensor Framework for Heart Rate and Blood
Oxygen Saturation Monitoring of Human Body
M´
arcio Fernandes Calil
MASTER DISSERTATION
Computer Engineering - Mobile Computing
Multi-sensor Framework for Heart Rate and Blood
Oxygen Saturation Monitoring of Human Body
M´
arcio Fernandes Calil
Master dissertation performed under the supervision of Professors Lu´ıs Marcelino, Lu´ıs Conde Bento and S´ergio Faria all from Escola Superior de Tecnologia e Gest˜ao of Instituto Polit´ecnico de Leiria.
Acknowledgments
I would like to express my gratitude and appreciation to everyone who contributed to the success of this project, either directly or indirectly.
Firstly, I would like to thank my mentor teachers, Prof. Lu´ıs Marcelino, Prof. Lu´ıs Conde Bento and Prof. S´ergio Manuel Maciel de Faria who helped me immensely and who were always there to help sort out my ideas and guide my work along the way.
I would like to thank the opportunity of working as a researcher in the project ”Body distributed heart sensors” (IT/2017), and the financial support provided by the Instituto de Telecomunica¸c˜oes, through Funda¸c˜ao para a Ciˆencia e Tecnologia. I would also like to express my thanks to Ihor Koval for the code peer review of the PPG sensor system and for helping to improve the performance of the code.
I am grateful to my office colleagues for making the work environment more enjoyable, as well as the feedback on the project as needed.
I also want to thank the Polytechnic Institute of Leiria and all the professionals and colleagues who not only welcomed me very well as became my friends, who also helped me graduate and become a more qualified professional, besides making the life-experience in another country more friendly.
I especially want to thank my friend Dr. Rafael Ferrari, who allowed the tests to be carried out at Santa Casa de Miseric´ordia de Barretos, and the hospital’s healthcare providers, who collaborated with me to make the research successful and who even changed their own routines in order to help me along the way.
I would also like to thank Ana Ribeiro, who helped me out by proofreading my text. And finally, I want to thank my family and friends, especially my parents, Maria Aparecida Fernandes Calil and M´arcio Calil and my sister, Lilian Fernandes Calil, who encouraged me throughout my dissertation paper and who were always by my side despite the distance during these years, giving me the greatest unconditional support at all times, especially during the hardest ones.
Resumo
As doen¸cas cardiovasculares s˜ao a causa de morte de milh˜oes de pessoas. Mortes que, muitas vezes, poderiam ser evitadas se houvesse um aumento significativo do diagn´ostico para dete¸c˜ao precoce de tais doen¸cas. Este diagn´ostico, por sua vez, poderia ser realizado com uma maior disponibilidade de dispositivos m´edicos confi´aveis e de baixo custo.
Sensores tecnol´ogicos integrados dispon´ıveis em dispositivos m´oveis (wearable devices) tem sido comumente utilizados para realizar a leitura de dados fisiol´ogicos em utilizadores (pacientes). Particularmente o sensor de oximetria de pulso, oferece um m´etodo ´unico, n˜ao invasivo, que pode ser utilizado para auxiliar a dete¸c˜ao de tais doen¸cas.
Esta avalia¸c˜ao da condi¸c˜ao f´ısica do paciente em certas doen¸cas s˜ao poss´ıveis devido `a medi¸c˜ao n˜ao invasiva atrav´es da fotopletismografia, que permite a extra¸c˜ao da frequˆencia card´ıaca e da satura¸c˜ao de oxig´enio no sangue. Sendo que alguns diagn´osticos de doen¸cas requerem monitoramento simultˆaneo dos valores de satura¸c˜ao de oxig´enio no sangue em v´arios locais do corpo, desenvolveu-se ent˜ao um projeto para realizar tais leituras dos dados fisiol´ogicos.
Esta tese (disserta¸c˜ao) apresenta o desenvolvimento de uma plataforma de sistemas que tem como base a utiliza¸c˜ao de m´ultiplos sensores de oximetria de pulso, conectados a uma aplica¸c˜ao desenvolvida para um dispositivo m´ovel atrav´es de liga¸c˜ao sem fios.
A finalidade desta plataforma ´e disponibilizar uma experiˆencia de f´acil leitura de dados de sa´ude que podem ser analisados para diagnosticar sintomas de doen¸cas cardiovascula-res, nomeadamente problemas circulat´orios, permitindo efetuar um diagnostico precoce.
A estrutura completa, bem como aspetos da an´alise e implementa¸c˜ao dos sistemas relacionados a arquitetura proposta s˜ao descritos nesta disserta¸c˜ao.
Palavras chave: satura¸c˜ao de oxig´enio, wearable sensors, m-Health, doencas cardio-vasculares
Abstract
Cardiovascular diseases have been the cause of death for millions of people. Some of these deaths could be avoided if there was a significant increase of diagnosis for the detection of such diseases. This diagnosis, in turn, could be realized with the increased availability of robust and low-cost medical diagnostic devices.
Integrated technology sensors available on wearable devices have been commonly used to read physiological data in users (patients). Particularly the pulse oximetry sensors, offers a unique, non-invasive method that can be used to detect the severity of such diseases.
This evaluation of the physical condition of the patient for certain diseases is possible due to non-invasive measurement through photoplethysmography, which allows the ex-traction of heart rate and oxygen saturation in the blood. Since some diseases diagnoses require simultaneous monitoring of blood oxygen saturation values at various sites in the body, a project has been developed to perform such reading of physiological data.
This thesis presents the development of a systems platform based on the use of multiple pulse oximetry sensors connected to an application developed for a mobile device though a wireless connection. The purpose of this platform is to provide an easy-to-read experience of health data that can be analyzed to diagnose cardiovascular disease symptoms, aiding in an early diagnosis.
The complete structure as well as the aspects of the analysis and implementation of the systems related to the proposed architecture are described in this dissertation.
Keywords: Oxygen saturation, wearable sensors, m-Health, cardiovascular diseases
Contents
Acknowledgments iii
Resumo v
Abstract vii
Contents xii
List of Figures xiii
List of Tables xvii
Acronyms xix
1 Introduction 1
1.1 Scope and motivation . . . 2
1.2 Objectives . . . 2
1.3 Expected outcomes and benefits . . . 3
1.4 Methodologies . . . 3
1.5 Dissertation structure . . . 5
2 Monitoring Heart Rate and Oxygen Saturation with Photoplethysmography (PPG) sensors 7 2.1 PPG-based Sensors . . . 7
2.1.1 Concerns with Pressure, Motion and Ambient Artifacts . . . 9
2.1.2 Addressing Issues with Black Velcro and Digital Filter . . . 10
2.2 Multi-sensor Monitoring . . . 11
3 Background of Supporting Technologies 15
tive Network Technology (ANT+)) . . . 16
3.1.2 Bluetooth . . . 16
3.1.3 Wi-Fi . . . 18
3.1.4 Zigbee . . . 18
3.1.5 Comparison Between Wireless Communication Protocols . . . 19
3.2 Sensor Modules . . . 19
3.2.1 MAXREFDES117 . . . 20
3.2.2 MIKROE . . . 20
3.2.3 Shimmer3 Galvanic Skin Response (GSR+) . . . 22
3.2.4 Analysis and Sensors’ Comparison . . . 23
3.3 Existing PPG Products . . . 23
3.3.1 Apple Watch . . . 25
3.3.2 Fitbit Charge 3 . . . 26
3.3.3 Polar OH1 Optical Heart Rate Sensor . . . 27
3.3.4 Garmin Vivosmart 4 . . . 28
3.3.5 Analysis and Comparison of PPG Products . . . 28
4 Heart Rate Monitoring 31 4.1 The Use of Multiple PPG-Sensors to Measure Blood Oxygen Saturation (SPO2) . . . 31
4.2 Diseases that can be analyzed by PPG . . . 32
4.3 Applications for Heart Rate Monitoring . . . 33
4.3.1 Apple Health and Google Fit . . . 34
4.3.2 Fitbit . . . 36
4.3.3 Polar Flow . . . 37
4.3.4 Withings Health Mate . . . 38
4.3.5 Cardiogram . . . 39
4.3.6 Medical Research Applications . . . 39
4.3.7 Out of boundaries . . . 40
4.3.8 Analysis and Comparison of Applications . . . 40
5 Proposed Solution’s Architecture and Development 43
5.1 Solution Architecture . . . 44
5.1.1 Use Cases . . . 44
5.1.2 Main System Requirements . . . 44
5.1.3 Proposed Solution Architecture . . . 47
6 Implementation 51 6.1 Main Technology Solutions Chosen . . . 51
6.1.1 Wearable Device System . . . 52
6.1.2 Mobile Application . . . 54
6.1.3 Wireless Communication . . . 55
6.2 Wearable Device . . . 56
6.2.1 Wearable Device Prototypes . . . 56
6.2.2 Wearable Device System . . . 60
6.3 Mobile Application . . . 63
6.3.1 Development for iPhone Operating System (IOS) . . . 63
6.3.2 User Interface Application . . . 67
6.3.3 Database . . . 68
6.3.4 IOS Bluetooth Low Energy (BLE) Communication . . . 69
6.3.5 BLE System Connection . . . 70
6.4 Systems Operation . . . 73 6.4.1 System Usage . . . 73 6.4.2 Measurement Site . . . 74 7 Experimental Results 77 7.1 System setup . . . 77 7.2 Method . . . 79 7.2.1 Testing setup . . . 80 7.2.2 Patients characteristics . . . 80
7.3 Comparison of the proposed system with other pulse oximetry readers . . . 81
7.4 Analysis of issues in relation to the tests performed . . . 85
8 Discussion and Future Work 87 8.1 Conclusions . . . 87
8.2 Future work . . . 89 xi
Appendices 99
A Published paper 101
B Informed consent form for research 107
List of Figures
2.1 PPG techniques to detect blood variations in vessels. a. Transmission
mode; b. Reflectance mode. . . 8
2.2 Test using force pressure [1]. . . 9
2.3 Annual worldwide wearable forecast . . . 11
3.1 MAXREFDES117 PPG sensor board. . . 20
3.2 MAXREFDES117 reference design block diagram. . . 21
3.3 Heart rate 6 Click is an optical biosensor designed for heart rate monitoring. 21 3.4 Heart rate Click attached to a main board. . . 22
3.5 A user’s hand with Shimmer3 GSR collecting vital signs as PPG [2]. . . 23
3.6 Global Heart Rate Monitors Market, Company Share Analysis, 2016 (%) [3]. 24 3.7 Apple Watch Heart Rate Application. . . 25
3.8 Apple Watch Series 4 back wireframe components displaying Electrocardiogram (ECG) and PPG sensors used to measure heart rate, where the Digital Crown electrode works with the back crys-tal electrode and photodiode sensors work with green Light-Emitting Diode (LED)s and infrared LEDs. [4]. . . 26
3.9 Fitbit Charge 3 face displaying the time and the user’s heartbeat. . . 26
3.10 Polar OH1 armband – a 6-LED optical HR sensor. . . 27
3.11 Garmin Vivosmart 4 displaying heart rate in bpm. . . 28
4.1 Main causes of death in Portugal 2016 [5]. . . 32
4.2 Google Fit activity tracker. . . 35
4.3 Apple Health displaying the user’s measurements plus medical records. . . 35
4.4 Fitbit application (screenshots from Android and iOS). . . 36
4.5 Polar Flow application. . . 37
4.6 Withings Health Mate application. . . 38 xiii
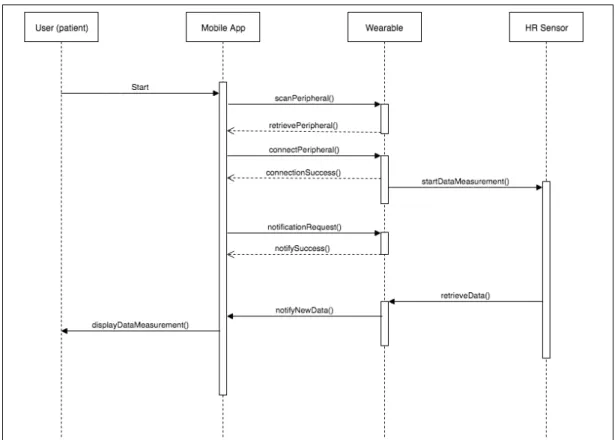
5.1 Diagram showing the sequence of the system main functionality. . . 45
5.2 Block diagram of the entire system. . . 45
5.3 System architecture for remote patient monitoring system. . . 48
6.1 MAXREFDES117 PPG sensor chosen to be used in the project. . . 52
6.2 ESP32 by Sparkfun - the microcontroller used in the project. . . 53
6.3 3.7-V 2000-mAh polymer Lithium Polymer (LIPO). . . 53
6.4 Screenshot of Sloeber, the Eclipse IDE for Arduino showing the heart mon-itoring project. . . 54
6.5 Screenshot of Xcode showing the Heart Rate Project. . . 55
6.6 First Prototype: Arduino Uno, BLE board and Maxim heart sensor - wired connection. . . 57
6.7 Second prototype: Arduino, BLE board, I2C multiplexer and 2 Maxim heart sensors - wired connection. . . 58
6.8 Final Prototype - ESP32 as microcontroller (built-in BLE), 2 Maxim PPG sensors plus a battery. . . 59
6.9 Flowchart of the algorithm to calculate the heart rate and SpO2. . . 62
6.10 Project storyboard and its connections. . . 64
6.11 Project structure in folders in Xcode. . . 64
6.12 My Health Pulses app - BLE Unavailable screen. . . 65
6.13 My Health Pulses app - Heart rate monitor - List of devices. . . 65
6.14 My Health Pulses app - HR sensors details - the main screen of the app. . 66
6.15 My Health Pulses app - (a) HR Sensors Details; (b) History’s Share. . . 67
6.16 Prototype of screens shown to users so they could choose the one they prefer. 67 6.17 Prototype of screens shown to users. . . 68
6.18 BLE structure created for the project. . . 72
6.19 Framework Platform Systems Operation. . . 74
7.1 Xcode XCTest - Unit testing. . . 78
7.2 Setup: (a) 3D-printed black box front; (b) 3D-printed black box back. . . . 80
7.3 Comparison of Heart Rate (HR) (a) and SPO2 (b) between framework sensors and commercial devices. . . 81
7.4 DX2515 Pulse Oximeter used at Santa Casa de Miseric´ordia de Barretos. . 82 xiv
7.5 Comparison between oxygen saturation levels from all participants. . . 84
List of Tables
3.1 Main differences between Bluetooth LE and Bluetooth Classic. . . 17
3.2 Comparison of Wireless Communication Protocols. . . 19
3.3 Comparison between heart rate on-board sensors on MikroElektronika
boards. . . 22
4.1 Comparison between similar applications.. . . 41
6.1 Comparison of boards specifications used in the project - final (ESP32),
second (Arduino Mega) and first (Arduino Uno) prototypes, respectively. 59
7.1 Age range of the subjects.. . . 80
7.2 Measurement Error results . . . 83
7.3 Percentage of different SPO2 results from diabetic population . . . 84
Acronyms
ANT+ Advanced and Adaptive Network Technology APP Mobile Application
AW Apple Watch
BLE Bluetooth Low Energy BPM Beats per Minute BR Basic Rate
CES Health Ethics Committee
CFSA Cycle-by-Cycle Fourier Series Analysis COPD Chronic Obstructive Pulmonary Disease CVD Cardiovascular Diseases
ECG Electrocardiogram EDA Electrodermal Activity EDR Enhanced Data Rate EEG Electroencephalography
FDA Food and Drug Administration FMD Flow-Mediated Dilation
GATT Generic Attribute Profile GHz Gigahertz
GPS Global Positioning System GSR+ Galvanic Skin Response
I2C Inter-Integrated Circuit
IDC International Data Corporation IDE Integrated Development Environment
IHME Institute for Health Metrics and Evaluation IOS iPhone Operating System
IR Infrared Radiation LAN Local Area Network LED Light-Emitting Diode LIPO Lithium Polymer OS Operating Systems P2P Peer-to-Peer
PPG Photoplethysmography PTT Pulse Transit Time
PWTT Pulse Wave Transit Time RMSE Root Mean Square Error SCL Serial Clock Line
SDA Serial Data Line SG7 Samsung Galaxy 7 SIG Special Interest Group SPO2 Blood Oxygen Saturation SVD Singular Value Decomposition TBP Toe Blood Pressure
UV Ultraviolet UX User Experience
VLF Very-Low Frequency
WBAN Wireless Body Area Network WBSN Wireless Body Sensor Network WHO World Health Organization
Chapter 1
Introduction
Reports from World Health Organization (WHO) and the Institute for Health Metrics and Evaluation (IHME) show that the majority of deaths in the world are related to cardiovascular and infectious diseases [6], being in Portugal almost 35 thousand deaths per year due to Cardiovascular Diseases (CVD) [5]. Some of the CVD-related symptoms, namely those related to circulatory diseases, can be detected by using pulse oximetry devices, based on PPG sensors.
Nowadays, with easy access to technology, and with people more concerned with health and well-being, there is a greater adoption of health-related technology. Furthermore, many companies have developed sophisticated and easy-to-use electronic devices that can collect data in a less intrusive way, which can be seen in wearable devices. These are electronic devices that can be used by people in their body as a peripheral accessory or as part of fabrics used in clothing.
Besides, the fact that wearable devices are becoming popular and an important ac-cessory, wearable electronic devices are able to collect data and transmit it through a smartphone. There are a wide range of products, of different types (e.g. smart clothing, implanted devices), that can be used in various ways such as payment methods, Global Positioning System (GPS) location, control of a smart home, health, among others, but the focus of this work is on health wearable device.
As International Data Corporation (IDC) Worldwide Quarterly Wearables Device Tracker shows [7], 94,8% of market share correspond to watches and wristbands, more accurately there is 56,9% of watches and 37,9% of wristbands.
As mentioned, one of the most common health equipment sold in the market and used by people is the wristband wearable, an electronic bracelet that has a wireless connection to a smartphone and usually has sensors like accelerometer and PPG sensor and may have a display, that shows the data collected from the sensors. Thus, this type of sensor is not only used in medical devices, but also in electronics devices used daily by people [8].
The high number of CVD-related deaths and the easy use of PPG sensors to diagnose symptoms of these diseases shows how important it is to develop new solutions to help in the diagnosis at an early stage, such as measuring multiple human body sites, which can be performed with solutions having multiple PPG sensors.
1.1
Scope and motivation
As previously mentioned, according to recent studies, a huge number of people in the world die as consequence of derivatives from cardiovascular diseases. Due to the fact that many causes of death can be diagnosed with the help of a PPG sensor, and the accessibility of having a wearable device product to help measuring it, it is evident the rising number of people, worried about living better, that are looking for a device like these.
It is important to note that the cost of clinical exams for major diseases in hospitals or specialized clinics is often more expensive than a wearable device that performs non-invasive continuous measurements and can be used at all times to collect and process reliable data, that can be analyzed further by a medical specialist.
Taking into account these considerations, some research works have been done in order to study if the differences in physiological measurements, like HR and SPO2, and their correlations with circulatory problems and cardiovascular disease. For this purpose, a framework that can measure vital signs from multiple points from the humans’ body was designed, developed and tested.
1.2
Objectives
The main objective of this thesis is to propose a multi-sensor system for heart rate and blood oxygen saturation monitoring of human body. It is based on a Wireless Body Sensor Network (WBSN), designed as a wearable system architecture. It also includes the programming of the system code, as well as the development of the Mobile Application (APP) to display the results.
The solution needs to acquire and process vital signs using multiple PPG sensors to simultaneously, measures real-time heart rate and oxygen saturation at numerous sites in the human body and broadcast the data over a wireless connection to an easy-to-use system module, responsible to display and save the data acquired.
The system can be connected to two or more PPG sensors that measure the heart rate and oxygen saturation levels from multiple locations of the human body. The main goal is to investigate the possibility to diagnose early cardiovascular diseases by analyzing
1.3. Expected outcomes and benefits 3
data from different locations of the human body. It may be used daily by people with cardiovascular diseases, to help monitoring the progression of the disease, e.g. diabetes and blood circulation problems.
1.3
Expected outcomes and benefits
The project developed during the thesis includes a hardware prototype with two PPG sensors and the code developed for the smartphone, to receive and display the acquired data. The system runs in real time, the product is wearable, easy to use and while not in use is easy to transport.
It is possible to divide the expected results into three different parts: a commercial product, a scientific contribution and the social impact. For the business content, the project developed on the thesis is a low-cost hardware/product developed to be affordable by end users, as well as by doctors, laboratories (specialized clinics) and hospitals, so that diseases related to the cardiovascular system can be constantly monitored in a less invasive way than hospital equipment’s, to reduce expenses incurred with clinical examinations.
In terms of scientific contribution, the expected results of the thesis work intent to study if the measurement of heart rate and blood oxygen level from multiple points in the human body may be helpful in an early diagnosis of circulatory diseases.
The thesis aims to increase the help and prevention over the diseases related to the cardiovascular systems. The idea of providing help to the diagnosis for the patients avoiding them to reach the hospital in an advanced stage of the disease, brings gains for the person/patient, as well as it does to the economy, once the expenses related to patients are high.
The social impact can be significant if the system shows qualitative results and if the users’ adopt it, once the heart-related diseases and problems with veins are among the leading causes of death in the world.
1.4
Methodologies
Firstly, a study was carried out on the sensors field to identify the best way to used them to collect the heart rate and the saturation of oxygen in the blood.
The study was made in order to identifying the necessary boards and, to understand how the system architecture should be designed.
The research was extended to scientific publications that used the methodology of reading vital signs with Photoplethysmography sensors to analyze the health of subjects.
After identifying the adequate sensors, searches were made in academic articles, com-mercialized products and similar systems to understand how they could contribute to the research in term of reference, perspective and expectations. To carry out for scientific research, b-on was used to perform searches for publications within the academic and scientific community, bibliographic databases and internet engines.
The second objective was to develop the system to read the sensors and process the data, prior to be sent to a smartphone trough a wireless connection, and the smartphone application that will receive the data, save it and display it on the screen.
Due to the necessity to use a specific hardware, a board with a wireless communication to connect to a smartphone and two or more PPG sensors was developed in order to perform the experiments. Nevertheless, the objective of this thesis was not to develop the hardware.
In order to find the best solution for the systems to be developed, different proto-types were be built, being constantly evolving during the architecture’s design process, to achieve the intended results.
A study was carried out on mobile applications and their characteristics, so that the development was executed following common guidelines. A questionnaire about the application interface was conducted with end-users in order for the application to be designed in the best way possible to facilitate its use, such that users could understand the data shown in a simple and precise way.
Finally, some tests were performed to show the effectiveness of the system. To ensure that the data collected and presented was reliable, a doctor was asked to perform tests with its patients.
So, in order for the mentioned objectives to be effectively achieved, it was decided to create a prototype and develop a mobile application to explore, analyze and test it with patients. In this way, it was possible to discover and comprehend the data col-lected through tests, to ascertain the viability and reliability of the studied methods and technology.
In order to validated work and to ensure that it was on track, weekly meetings were held with the supervisors. Having defined the functionality and objectives of the project, the meetings got spaced for the development to be carried out, as two systems were developed. After the prototype was finalized and the APP was created, the meetings were held weekly again so that necessary adjustments were made to the systems to achieve success.
1.5. Dissertation structure 5
1.5
Dissertation structure
The document is structured in eight chapters and the steps designated for this study, as the basic assumptions and decisions for its development, are presented in the following. Chapter 2 presents the information collected during the research, with a focus on the area of the study, where similar and equivalent projects or the ones with some valuable features are analyzed.
In Chapter 3, the method for collecting biomedical information from the user, as well as the technologies that can be used in the development of the project, are described. Available technologies and products are detailed, in order to find the best technologies for the project.
The Chapter 4 describes the usability of sensors in heart rate monitoring, as well as advantages and disadvantages of the various mobile applications, in order to understand the solutions that are already available at the APP stores to ascertain (or verify) what this project might add.
In Chapter 5, the main functionalities of the systems are presented, through the choice of the hardware, the requirements for the system, as well as the communication between hardware and APP.
Chapter 6 details the construction of the wearable device using PPG sensors, as well as the development of the systems based on the selected features in the design phase. Regarding the software developed, there are two separate systems that work together. Its implementation was developed in two strands, one of which is the module for acquiring, processing and sending data and one module to display this data.
In Chapter 7, functional tests, acceptance and performance of the implemented system were performed to detect unknown technical or functional problems. The results of the systems are analyzed in relation to testing the validity of the system to detect cardio-vascular diseases. Additionally, the results are compared with products available on the market.
Finally, in Chapter 8, the acquired data was analyzed and the results are discussed. This chapter also describes the problems faced during the project and future work.
Chapter 2
Monitoring Heart Rate and Oxygen
Saturation with PPG sensors
This Chapter aims to present a brief introduction to photoplethysmography (PPG) and highlights studies carried out for the acquisition and monitoring of heart rate and blood oxygen saturation levels using multiple sensors to try to predict diseases related to the cardiovascular system.
2.1
PPG-based Sensors
Photoplethysmography (PPG) is a non-invasive method that is used to monitor and measure heart rate, blood oxygen saturation, blood pressure, among others health mea-surements [9] [10] [11].
To perform the HR and SPO2 measurements, the PPG method uses LED lights, a red and an Infrared Radiation (IR) lights and a photodetector in order to check any the changes that happens in the size of blood vessels immediately after the heart contracts. Subsequently, an algorithm converts these measurements and turns them into heart rate readings [9] [10] [11].
Those differences in the blood vessels that occur all along the heartbeat correspond to the systole and diastole phases [12], which can be measured with two different procedures [1] [13] [14]:
A. Transmission mode (see Fig.2.1 (a)) – where LED lights (red and IR lights) and the photodetector are parallel to each other so that the LED can transmit the lights through the veins for the PD to capture the changes, achieving a good signal. However, sites where this device can be used are restricted, as the thickness of the skin should be thin, like on a fingertip or earlobe.
B. Reflectance mode (see Fig.2.1 (b)) – the LED and the PD are on the same side, so the PD detects the changes in the blood veins reflected by LED lights. This type of PPG can be located in different parts of the body, although any movements need to be considered because the sensor may move during some activity, thus producing noise that would interfere in the measurements results. Not to mention the pressure that must always be constant or pretty much the same, so it does not affect the veins and consequently the measured results [15].
LED
PD
a.
LED PD
b.
Figure 2.1: PPG techniques to detect blood variations in vessels. a. Transmission mode; b. Reflectance mode.
To ensure that the measurement results are useful and well-performed it is almost mandatory to position PPG sensors in the body where arteries are close to the skin, such as on a fingertip, earlobe, the forehead, etc. The location where the sensors are being placed is an important condition to carry out the analysis, both because of skin contact and better blood reading, and because it reduces the impact of external factors.
The PPG technique is being clinically applied to detect peripheral vascular disease by detecting low blood oxygen levels.
The PPG results may also be a sign for the physicians to perform medical exams to di-agnose diseases such as anemia, congenital heart defects, interstitial lung disease, Chronic Obstructive Pulmonary Disease (COPD), pulmonary edema, pulmonary embolism, pul-monary fibrosis and also sleep apnea [16] [17] [18].
In the following sections, the concerns with photoplethysmography are described and detailed, as the results may vary and might not be so accurate when some external factors interfere.
In order to ensure that the PPG sensor works as expected, it is crucial to consider some aspects and make the necessary efforts to minimize circumstances that might contribute to measurement failures, like movement, ambient lights and other known causes. According to study [10], even the simple act of breathing might cause some noise to the PPG reading, depending on how the breath is.
2.1. PPG-based Sensors 9
motion artifacts, pressure on the sensor and ambient light, it is important to understand which techniques that might help to reduce any problems that may occur.
2.1.1
Concerns with Pressure, Motion and Ambient Artifacts
The pressure exerted on the sensor by the user during the measurement is an external factor that can affect the measurements results in two different ways. If the pressure exerted on the sensor is not constant and the location is not maintained at all times, the photodetector may not be able to check the wavelengths as expected due to the invasion of the lights [15].
On the other hand, an excessive pressure applied on the sensor may constrict the veins and thereby restrict the blood circulation, which would cause the values to be incorrect.
When comparing studies A [15] and B [1], which measure the range of the contact pressure, these show that the pressure varies depending on where the sensor is located.
While study A states that the pressure on the finger (see Fig.2.2) should be light, study B reveals distinguishable changes only when the pressure is too strong.
Figure 2.2: Test using force pressure [1].
Consequently, in both cases, the absence of sufficient contact or excess pressure lead to incorrect results, so it is important to maintain a constant pressure to the PPG sensor. After determining that PPG may yield incorrect results due to pressure issues, it must also be noted that the presence of motion artifacts may also contaminates the signal during physical movements, either voluntarily or involuntarily.
Considerable research was conducted to develop algorithms [19] to reduce motion artifacts from the PPG signal [20] [21] [22].
It is crucial to know that a simple movement can create a distance between the sensor and the skin where it is located, causing a larger motion artifact.
Studies carried out on PPG have shown that ambient light have interferes with mea-surement results, which is why precautions should being taken, such as turning off the lights [23], or even using a ring created for external light to be minimized [15].
Since there are different types of lights, and usually pulse oximetry is measured in clinical laboratories that normally have the same type of light, a further controlled study [24] was performed where people from the same race had their SPO2 data collected during a test with the lights off and another test with the lights on.
Even though the American Association for Respiratory Care believes and has cata-logued the ambient light as an element that affects pulse oximetry readings [25], and al-though other researchers have found and reported interference from ambient light, Fluck’s results have shown that ambient light does not affect in pulse oximetry measurements [24].
2.1.2
Addressing Issues with Black Velcro and Digital Filter
Since the body parts may vary in size, and considering that the pressure exerted on the sensor and the ambient light can produce noise in the measurements results, a black Velcro tape is a technique that is commonly used physically.
By reviewing the tests carried out by different researchers in their studies, a black Velcro tape was used to keep the pressure and contact of the PPG sensor contact with the skin steady [26] [27].
Considering those facts, in order to reduce the chances of interference that may occur from ambient light and the different pressure applied to the PPG sensor, the author proposes the use of a black Velcro tape, attaching it to the area where the sensor performs the measurements.
In addition to the physical technique to minimize the interference that occurs with motion artifacts and low or high pressure applied to the sensor, plus ambient lights, there are several types of filters that can be used to prevent such interference.
When it comes to digital filters, there is a large amount of algorithms and methods that have already been developed to detect different types of noises on the frequency that measures the signals that can be found on these studies [19] [20] [21] [22].
A comparison analysis [19] was performed with six different filtering methods used to reduce motion artifacts, and two methods – Singular Value Decomposition (SVD) and Cycle-by-Cycle Fourier Series Analysis (CFSA) - stood out because their results were better when compared to the other analyzed methods.
SVD is a well-known method, and it is also one of the most used matrices in linear algebra to reduce a complex matrix [28] and to simplify the future calculations.
frequen-2.2. Multi-sensor Monitoring 11
cy/proximity after being decomposed [29].
Low-pass filter and high-pass filter can also be used to remove noise by cutting off the frequency that passes through it. While low-pass filter attenuates signals with frequen-cies higher than the cutoff frequency, allowing the frequency below to pass through it, high-pass filter operates with frequencies above cutoff and attenuate signals with lower frequencies [19] [30] [31].
2.2
Multi-sensor Monitoring
Considering that cardiovascular diseases are one of the biggest causes of death in the world [3], it is clear how important it is to develop new techniques for diagnosis, as well as how crucial it is for people to carry out continuous monitoring of heart diseases. Based on this information, it is increasingly easier to find studies to try to predict disease diagnosis through new systems using PPG sensors, as can be seen in the following brief descriptions. There are many studies in the healthcare field, and because wearable devices play a role in our lives, the researches about them have increased, along with usage.
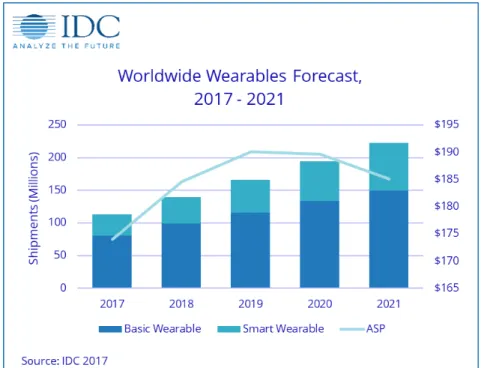
According to the results obtained from a research conducted by IDC and Gartner, the total shipment volumes of wearable devices expected for 2017 was approximately between one hundred, nineteen million units and one hundred, third-seven million units (IDC results from 21st June 2017 and Gartner results from 24th August 2017, respectively).
Figure 2.3: Annual worldwide wearable forecast
other fitness monitors, the projection for 2021 goes up to two hundred, thirteen millions to be sold worldwide [32] [7].
As briefly stated, nowadays electronic devices have been widely used in the healthcare field. Specifically, we can mention that, in recent years, heart rate and blood oxygen levels have been measured by users / patients with the use of a single device that has PPG sensors installed [33].
These are non-invasive devices that target not only at the comfort of patients, but also at their well-being, since they are a non-intrusive monitoring method that can be used in day-to-day, during any activities.
Studies have shown that wearable devices that have PPG sensors have been tested in various body sites of the human-body to ascertain the accuracy of heart rate and blood oxygen (SPO2) measurements.
Prior research, such as [34], has enabled the creation of a synchronized multi-body sensor platform that is capable of monitoring four different human vital signs in real time, using four different types of sensors, such as electroencephalography, electrocardiography, respiration and PPG. This is used to acquire health-related data of the human body, which are then assessed.
Study [35] reveals that, in all five anatomical locations tested - finger, forearm, wrist, shoulder and forehead - the heart rate was accurately measured. Unlike our study, a SPO2 measurement was not performed.
Buchs et al. [30] use multiple PPG sensors and data collected from the right and left index fingers and right and left second toes to compare the very low frequency results from non-diabetic and diabetic patients in order to check for a sympathetic dysfunction. Study [36] has enabled the creation of a low-cost audio-based smartphone oximeter to diagnose diseases such as pneumonia. The device developed uses the audio port to establish a connection with the smartphone through a line-powered high-impedance pre-amplifier that is integrated into the sensor connector. The device created for this project made it possible to acquire the blood oxygen level using a pulse oximeter and transfer the results directly to an application developed for smartphones.
When it comes to the prevention of cardiovascular diseases, physical activity is highly recommended, as it helps to avoid obesity, reduce blood pressure and improve cholesterol levels [37] [38] [39] [40]. In this sense, studies attempted to develop algorithms that are capable of eliminating noise and increase the quality of the sensors used in order to ensure a more significant accuracy of the data acquired.
Study [41] has developed an algorithm and a system to work with the BIOPAC MP150 data acquisition system to collect PPG signals in a noisy environment, while the study [14] has developed an opto-electronic system and an algorithm to eliminate noise signals caused
2.2. Multi-sensor Monitoring 13
by motion artifacts, as well as another algorithm to increase the quality of the PPG sensor signals to ensure accurate data during physical exercises.
Turning away from the context of using PPG sensors to measure healthcare data, another technique is also worth noting: a PPG image reading technique, known as imaging PPG (IPPG) [42], which consists of the illuminating of the site to be analyzed by PPG, plus a camera, that carries out the PPG image analysis with the system developed for this purpose.
Studies performed using PPG sensors have shown their value and purpose, as people can increasingly use such devices to analyze levels of healthcare data and monitor health remotely without the need to perform tests to check vital signs, as they that can be measured using these sensors.
Chapter 3
Background of Supporting
Technolo-gies
This chapter reviews the supporting technologies commonly used in the heart rate monitoring systems, namely the wireless communication protocols, sensor modules and popular PPG products, providing sufficient background information about the method used to acquire the patient’s vital signs.
3.1
Low-range Communication Technologies
The communications between the monitoring system that acquires the user’s vital signs, e.g. HR and SPO2, and the display system – a smartphone application - was chosen according to certain criteria defined in the initial project specifications:
A. Wireless – the communication protocol must be wireless, because the system used to display the data is a mobile app;
B. Low power consumption – because the wearable device works with a battery, the communication protocol needs to be optimized to maximize the device’s working lifetime;
C. Short-range communication – the wearable device and the smartphone will be located near each other, so a short-range communication seems to fit perfectly.
Because there are many wireless communication technologies and protocols, those considered more suitable for this application will be briefly described and compared.
3.1.1
Advanced and Adaptive Network Technology (ANT+)
The Advanced and Adaptive Network Technology (ANT+) is a wireless technology designed based on ANT+ by Garmin in 2004. It was firstly used to monitor health and fitness data [43].
The ANT+ protocol is a low power consumption protocol that is based on a 2.4 Gigahertz (GHz) frequency band and it works as a broadcast, allowing for the connection of multiple devices at the same time, without being exclusively connected to a paired device. For example, ANT+ can be connected to a person’s heart rate monitoring device and a bicycle’s speed device, collecting in that way the user’s heart’s rate Beats per Minute (BPM) and the user’s bike speed data.
The network connection between devices can be public, managed or private. However, the devices need to be on the same network in order to connect through an ANT+ protocol. ANT+ works as a managed network – a network type that has certain rules and behaviors, including the definition of specific profiles with standard data such as key, data type, formatting and parameters.
The critical point in ANT+ is that it requires a module to be integrated with the hardware’s device, plus a software needs to be installed or even a third-party hardware needs to be connected to a smartphone to fulfill the communication between the data of user’s different devices.
Currently, ANT+ is supported by a few Android devices, but it is not supported on iPhone. In order to use this protocol, each device/sensor needs to have an ANT+ connection.
3.1.2
Bluetooth
Bluetooth is a universal wireless standard that is used to establish connections between devices, allowing the paired/connected devices to exchange data over a short-range using radio frequency. It is frequently used to exchange voice files, photos and data, to stream audio, but it can also be found in keyboards and printers.
The frequency band is 2.4 GHz and the most common range covered by devices is about 10 meters around the device, according to the power class used by the devices [44] [45].
For Bluetooth 5.0, the maximum range can go up to 240m. According to Bluetooth Special Interest Group (SIG) [44], there are two different types of Bluetooth: the Blue-tooth Basic Rate (BR) / Enhanced Data Rate (EDR) and BLE.
A. Bluetooth Basic Rate / Enhanced Data Rate
3.1. Low-range Communication Technologies 17
continuous connection between two points (point-to-point), including piconet topol-ogy. Therefore, it uses a Peer-to-Peer (P2P) network topology to set up communi-cations between devices, on a one-to-one (1:1) basis [44].
Bluetooth BR/EDR audio streaming is ideal for wireless speakers, headsets and hands-free, in-car systems.
B. Bluetooth Low Energy
In 2010, Bluetooth Low Energy was announced for the first time by the Bluetooth SIG as a Bluetooth standard, and it became to be part of the Bluetooth 4.0 speci-fication.
Bluetooth Low Energy is also known as Bluetooth LE, BLE and Bluetooth Smart. The main reason for this designation is because it was designed to provide a signifi-cant energy/power consumption reduction, as well as cost reduction. However, the communication range needs to be, or should be, sustained exactly like the Bluetooth Classic, including the frequency band, i.e., 2.4 GHz.
BLE enables short-burst wireless connections and uses multiple network typologies, including point-to-point, broadcast and mesh.
C. Differences Between Types of Bluetooth
There are few differences that can be listed: while Bluetooth Classic has a P2P topology, Bluetooth LE has multiple network topologies like P2P (one-to-one [1:1]), broadcast (one-to-many [1:m]), and even mesh (many-to-many [m:m]) communica-tions [46]. In contrast to Bluetooth, until it gets a connection started, BLE stays in sleep mode, which means a small battery can run applications for years [47]. There are other major differences that make BLE even more interesting to use in this project, as presented in (Tab.3.1) [44] [48].
Table 3.1: Main differences between Bluetooth LE and Bluetooth Classic.
BLE BR-EDR
Speed to Connect (Setup Time) < 6 ms 100 ms
Max Connections / Devices Unlimited 7
Power Consumption ∼ 0.01x to 0.5x of reference (depending on use case)
1 (reference value)
Service Definition GATT Profiles Traditional Profiles
Since the BLE technology is marketed for smartphones, and considering all the differ-ences that exist between Bluetooth protocols, BLE protocol has been chosen to be used in this project.
3.1.3
Wi-Fi
Wi-Fi is the most common Local Area Network (LAN) and it is used by millions of users and companies in the world to access the internet. It is used to connect devices without using any wire, which is known as wireless connection.
Technically speaking, it is a wireless radio communication protocol that uses the 2.4-GHz and 5-2.4-GHz frequencies to transmit data between computers connected to this net-work [49] at high communication rates.
In order to use Wi-Fi, devices must have a hardware installed to perform data trans-mission and reception. It is worth remembering that all smartphones and notebooks have such module installed, i.e., they are defaulted to connect via Wi-Fi.
Although Wi-Fi is a communication protocol that is commonly used, it is worth noting that it is not widely used in Wireless Body Area Network (WBAN) devices, as Wi-Fi power consumption is extremely high compared to other communication protocols and because WBAN devices require low-power technology [49].
3.1.4
Zigbee
Zigbee, like BLE and Wi-Fi, is a wireless communication protocol that uses a 2.4-GHz frequency band to transmit data through devices [50].
Because it is a small module with low-power consumption and low data rate (to reduce the energy consumption), Zigbee is commonly used for residential automation and medical products.
One characteristic of this communication protocol is that it allows data to be trans-ferred between 10 and 100 meters. But the main characteristic is that it uses a mesh topology, allowing every device using this communication protocol to communicate with each other and to be controlled by a unique device - the controller.
Usually, Zigbee devices communicate with a controller that may have an applica-tion, and this controller/router communicates via Wi-Fi or Bluetooth with other devices, transmitting data from the device.
3.2. Sensor Modules 19
3.1.5
Comparison Between Wireless Communication Protocols
The different communication protocols mentioned above were selected because they are connected to the context of wireless communication and because of the various character-istics they present in the context of health-related data transmission.
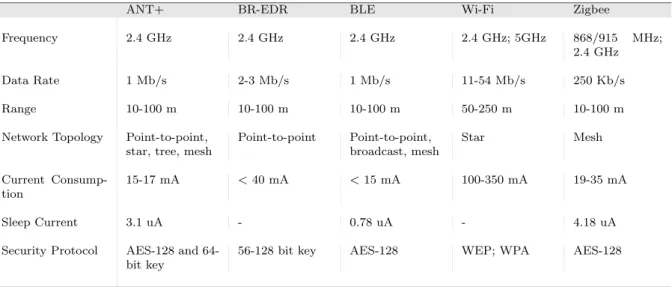
By observing the features of each communication protocol, it is possible to see that they have certain features in common and others that differentiate them, as shown in Tab.3.2.
Table 3.2: Comparison of Wireless Communication Protocols.
ANT+ BR-EDR BLE Wi-Fi Zigbee
Frequency 2.4 GHz 2.4 GHz 2.4 GHz 2.4 GHz; 5GHz 868/915 MHz;
2.4 GHz
Data Rate 1 Mb/s 2-3 Mb/s 1 Mb/s 11-54 Mb/s 250 Kb/s
Range 10-100 m 10-100 m 10-100 m 50-250 m 10-100 m
Network Topology Point-to-point, star, tree, mesh
Point-to-point Point-to-point, broadcast, mesh Star Mesh Current Consump-tion 15-17 mA < 40 mA < 15 mA 100-350 mA 19-35 mA Sleep Current 3.1 uA - 0.78 uA - 4.18 uA
Security Protocol AES-128 and 64-bit key
56-128 bit key AES-128 WEP; WPA AES-128
As can be seen from Tab.3.2, all communication protocols use the same communication frequency and work within the same range distance. Regarding the security protocol, all of them use the same type of security, except Wi-Fi.
The most singular features of the mentioned communication protocols are precisely the most important when thinking about the context of wearable devices, which are current consumption, sleep current and data rate.
When it comes to use these protocols, considering the hardware, the differences are more visible. This is because additional hardware (an extra extension) will be required to connect ANT+ and Zigbee, because the protocols mentioned are not supported by all smartphone, except for new Samsung smartphones, while Bluetooth and Wi-Fi already include these modules.
3.2
Sensor Modules
For decades, there exist sensors to measure vital signs in human bodies. However, monitoring human health is no longer only performed in hospitals and health clinics.
There is a wide range of sensor types for different purposes, from sensors to check if the user sleeps/rests well to sensors that measure temperature, body weight, blood sugar levels, and the most common ones that are used to measure heart rate and blood oxygen levels. Nevertheless, only sensors that are actually used in this project will be described. Since our study is related to heart rate and blood oxygen levels, this section intends to introduce few photoplethysmography sensors that have been used in similar studies or that are included in consolidated products, such as the Apple Watch, Fitbit etc. The purpose of this study is to make a comparison between the available module sensors which may be used in this project.
3.2.1
MAXREFDES117
A tiny (see Fig.3.1), 12.7-mm x 12.7-mm, low power, optical heart rate monitor and pulse oximeter solution, provided by Maxim Integrated, that interfaces with any micro-controller, for instance Arduino or mbed platforms.
Figure 3.1: MAXREFDES117 PPG sensor board.
The MAXREFDES117 architecture (see Fig.3.2) is designed with three different sen-sors integrated to be used to form a wearable application that allows the user to obtain heart rate and pulse oximetry measurements.
Maxim has chosen the MAX30102 sensor to perform heart rate/SPO2 measurements and it integrates red and IR LED to carry out the blood oxygen saturation level measure-ment.
Since it is needed to convert the input voltage from 5.5V to 2V, a step-down converter is used as, well as a level translator that provides communication to MAX30102 from the main controller board, considering the fact that the boards may have different logic levels. Using integrated red and IR LEDs to carry out the detection process, this module can be used on a person’s fingertip, earlobe, or other fleshy extremity [51].
3.2.2
MIKROE
MikroElektronika is a company that specializes in the development of their own embed-ded hardware and software systems, attaching sensors and circuits from other companies.
3.2. Sensor Modules 21
Figure 3.2: MAXREFDES117 reference design block diagram.
Healthcare products developed by MikroE use optical sensors to measure heart rate from PPG in reflectance mode, which means, photodiode and LED lights are on the same side.
Depending on which photodiode is being used, MikroE attached LED lights to the board (see Fig.3.3), as some photodiodes do not have integrated LEDs, except the sensor from Maxim Integrated.
Figure 3.3: Heart rate 6 Click is an optical biosensor designed for heart rate monitoring. MikroElektronika has been producing several similar sensor boards using different PPG sensors that are ready to use on development boards, as they need to be integrated into another board (see Fig.3.4) in order to carry out the measurements and send the data.
Figure 3.4: Heart rate Click attached to a main board.
mm); only the sensors and LEDs differ from each board (Tab.3.3)
Table 3.3: Comparison between heart rate on-board sensors on MikroElektronika boards.
MikroE products On-board sensors to measure PPG Heart rate Click MAX30100
Heart rate 3 Click SFH7050; AFE4404 Heart rate 6 Click BH1790GLC Oximeter Click ADPD105
As it can be seen, in each new board launched by MikroE, a different PPG sensor is added to the board. This may be considered important if the different sensor chips have characteristics suitable for different applications.
3.2.3
Shimmer3 GSR+
Shimmer3 GSR+ [2] is a skin monitoring sensor that can be used for different situa-tions, as it works with two different data acquisition modes: one being the use of GSR+ sensors, which use electrodes to measure the Electrodermal Activity (EDA), which can be summarized as the changes that appear due to the sympathetic nervous system, induced by the change in the body’s sweat; and the other one being an optical pulse sensor, which can analyze PPG data taken from the finger or earlobe, since the Shimmer3 GSR+ (see Fig.3.5) has these two types of sensors.
Shimmer comes with an integrated microSD card to storage data collected in real time and a Bluetooth Radio to perform a wireless connection with a notebook to transmit the data to the Shimmer platform, named ConsensysBasic/ConsensysPro, which carries out management from the sensor. The sensor also includes a Li-ion battery, which allows the product to collect data without being connected to a computer.
3.3. Existing PPG Products 23
Figure 3.5: A user’s hand with Shimmer3 GSR collecting vital signs as PPG [2].
comparison between all types of wearable sensors, from health monitoring systems (e.g., cardiovascular, SPO2, body temperature, etc.) to textile-based wearable sensors. On the other hand, the second study [21] uses the Shimmer3 GSR+ to obtain PPG data from human body, in order to analyze and compare the results collected using the Shimmer 3-axis accelerometer mode to the results collected with Shimmer in 3-3-axis gyroscope mode, so as to determine the best method to reduce motion artifacts.
Despite the comparison between GSR+ monitoring systems provided in the table, the results do not conclude which is the best sensor, as the purpose of each study that uses the sensors was different.
3.2.4
Analysis and Sensors’ Comparison
Among the boards surveyed, in relation to the sensors, all the boards have PPG reading technology, while Shimmer also has electrodes to measure EDA.
Shimmer is the only one that presents a ready solution, that is, it is not possible to add or remove components. On the other hand, Maxrefdes117 and MikroE boards need to be integrated with a controller board in order to process the acquired data.
In relation to the dimensions of the boards, the smallest and the one that best fits to any part of the human body to carry out the measurements is the Maxim Maxrefdes117.
3.3
Existing PPG Products
This section presents an overview of the current state of the art in similar products to our project, showing the features implemented in solutions available in the market.
gaining projection in terms of how one can obtain and analyze data in order to check a pattern for predicting a disease and/or simply for users to check their health. Regarding this fact, there are many heart rate monitors that can be found on the market, and most of them are built to record a number of biomedical data and track progress against established exercise goals.
With respect to products that have been investigated and which use photoplethys-mography to measure heart rate and blood oxygen saturation levels, four HR products of greater relevance were selected. Curiously, when it comes to the best and most used heart rate monitors, all the selected products are among the top heart rate monitor list according to market share, as per [3] research.
Although the featured products are only a small sample of this fast-growing technolog-ical field, it is important to note that the four companies with the most used HR products have a large portion of the wearables market share (see Fig.3.6).
Figure 3.6: Global Heart Rate Monitors Market, Company Share Analysis, 2016 (%) [3].
The selected products where chosen according to their type, application / segment and size, in relation to the number of users plus the number of scientific researches. Not to mention the fact that the products have a wireless connection to transmit data to another device.
3.3. Existing PPG Products 25
3.3.1
Apple Watch
After transform and revolutionizing the world of smartphones, Apple customers were expecting something different from the company. In this context, after a year and a half of Samsung’s first smartwatch release, Apple released the first Apple Watch, in 2015, and it currently (2018) figures in the first position in terms of market share [8], according to IDC report.
In the first generation, Apple Watch came with several sensors inside the product, in-cluding a heart rate monitor composed of an infrared, visible-light LEDs plus photodiodes in order to measure the user’s heart rate.
The latter version, known as fourth generation (see Fig.3.7), which was revealed in 2018, Apple decided to invest in sensors and health applications, so it was created a fall detection system that automatically calls the emergency number if the user does not respond to the smartwatch and indicates that everything is ok.
Figure 3.7: Apple Watch Heart Rate Application.
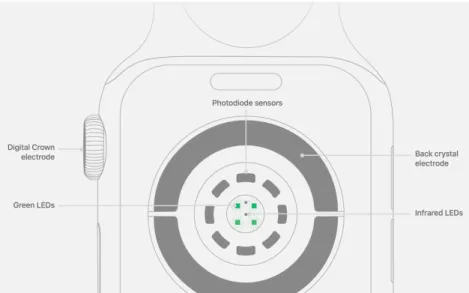
In addition, it was the first ECG system product that was released to the general public and approved by the United States Food and Drug Administration (FDA), and it was also supported by the non-profit organization American Heart Association. Despite having an ECG on the product itself, Apple kept the photoplethysmography sensor that is used to measure heart rate per minute and analyze the blood oxygen saturation in the wrist (see Fig.3.8), showing the effectiveness of PPG sensors.
Apple allows and encourages developers to integrate their applications with HealthKit, giving the permission for the app to read and write health data into the Health app developed by the company.
Figure 3.8: Apple Watch Series 4 back wireframe components displaying ECG and PPG sensors used to measure heart rate, where the Digital Crown electrode works with the back crystal electrode and photodiode sensors work with green LEDs and infrared LEDs. [4].
3.3.2
Fitbit Charge 3
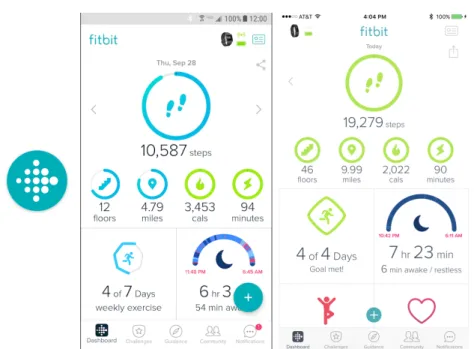
Fitbit has been developing fitness trackers to monitor health since 2009, but it was only in 2015 that is started monitoring heart rate with photoplethysmography sensors. The first product to be placed on the market with the purpose of measuring heartbeat was Fitbit Charge HR, and the last product was revealed in October 2018 - the Fitbit Charge 3 (see Fig.3.9). It was the first device from Fitbit to measure blood oxygen saturation with a sensor.
Figure 3.9: Fitbit Charge 3 face displaying the time and the user’s heartbeat. This last updated version shows improvements in the hardware, which should display
3.3. Existing PPG Products 27
results more accurately. Also, because they have added an SPO2 sensor, Fitbit can now analyze the user’s breathing patterns to check for breathing-related health problems, including sleep stages and possible sleeping issues.
Until the fourth quarter of 2017, Fitbit was the world’s leading wearables manufac-turer, but they lost this position to Apple, as a result of growing Apple Watch sales. However, even after losing market leadership, Fitbit is still ranked as the second largest smartwatch brand worldwide, with sales exceeding one million smartwatches sold to this date [8].
Fitbit only works with the company’s application, and this is a disadvantage because developers cannot use this wearable device in their own applications.
3.3.3
Polar OH1 Optical Heart Rate Sensor
As the first company to develop sports-related wearable devices and the pioneer of wireless heart rate monitor (1982) [53], Polar could not be left out. Not only because it has opened new paths decades ago, but also because of the new devices they are developing, Polar is still among the top 5 companies developing health products worldwide.
Polar OH1 is a 6-LED optical heart rate sensor (see Fig.3.10), running on a battery that can measure for about 12 hours, that was developed to work as a standalone sensor – it has an internal memory that can store 200 hours of heart rate training, or it can work connected through BLE to other Polar products or a smartphone (i.e., it can be connected to any fitness apps). Polar OH1 can be even connected to an Apple Watch Series 3.
Figure 3.10: Polar OH1 armband – a 6-LED optical HR sensor.
Different from other products available on the market, Polar OH1 is designed to be worn on the lower or upper arm. This allows the product to be comfortable and more accurate when compared to other wrist-worn devices during some fitness exercises [54].
The disadvantages that can be pointed out with regard to this heart rate monitor are that it only reads HR – it does not read SPO2 and does not support ANT+.
3.3.4
Garmin Vivosmart 4
Having been designing wearable heart rate monitoring devices since 2006, when Fore-runner 205 and 305 were created, Garmin has been using ANT+ technology to pair devices.
Occupying the fourth position in terms of market share, Garmin released the wristband Vivosmart 4 (see Fig.3.11) in September 2018. This is a small fitness activity tracker that can measure heart rate, pulse oximetry and Body BatteryTM – a functionality that, by combining different measurements such as activity data, heart rate variability, stress and sleep, can tell the user when they need to rest.
Figure 3.11: Garmin Vivosmart 4 displaying heart rate in bpm.
Different from other devices that the company have developed (which only use ANT+), Garmin Vivosmart 4 uses ANT+ and Bluetooth Smart (BLE) to connect to other devices. Some negative points that have been said per reviewers [55–57] are about the touch screen and the fact that it does not have GPS or GPS sync for smartphones.
3.3.5
Analysis and Comparison of PPG Products
Apple Watch is currently the most complete product on the market, as it has several sensors that are used differently, like PPG reading, ECG and fall detection. The major problem is that it can only be connected to Apple smartphones.
The best-selling product - Fitbit - can be connected to any smartphone, and it was the first one to add blood oxygen saturation readings. The major problem is that it does not connect to third-party applications.
Unlike the others, which are designed for users to use on the wrist or chest, Polar OH1 is designed for users to wear it on the lower and upper arm. The smartphone’s connection
3.3. Existing PPG Products 29
is now similar to Garmin products, as it can connect via Bluetooth or ANT+. However, it does not support SPO2 readings.
Garmin Vivosmart 4 uses either Bluetooth or ANT+ connection, performs HR and SPO2 readings, but it has a problem with the touch screen and does not have GPS coupled or synchronized with the GPS of the smartphone.
All devices available on the market have a single point of data collection, not being possible to collect data simultaneously from multiple sites in the human body, making it impossible to determine whether there is a difference between results from different locations at the same time.
Chapter 4
Heart Rate Monitoring
As previously mentioned, currently there are devices used to acquire biomedical in-formation from the human body, which may also serve to diagnose future diseases or health-related problems. As this work is particularly focused in the detection of diseases that can be analyzed by using PPG sensors, namely those that allow heart rate services and a pulse oximeter, this chapter aims to make a comparison of the most used appli-cations available to assist the user with the collection of this type of data by wearable health devices.
4.1
The Use of Multiple PPG-Sensors to Measure
SPO2
The purpose of having multiple sensors measuring the same psysical quantity, e.g., heart rate, pulse oximetry, Pulse Transit Time (PTT) or Pulse Wave Transit Time (PWTT), is to enable the the study the differential behaviour of the human body regarding the localization of the sensors. In some cases, large differences in the acquired values may indicate the existence of certain diseases, namely in the cardiovascular system.
In the majority of studies present in the literature [58] [59] [60] [26], the results have been obtained using Matlab (MathWorks Inc.) to process data from multiple PPG sensors (which need to be connected to a computer) to carry out different types of studies. For instance, a study to analyze the divergence of PPG results from the same individual, by measuring them repetitively in different periods of time [61], analysing the information from six sensors showed that age is a powerful factor for PTT [26].
The research proposed in our work differs from the previously mentioned ones as it performs the sensor readings and processes in real-time, not in a computer using Matlab, besides it allows to show the data in a mobile device (smartphone), using BLE, and
transmit the data, if required, using a standard smartphone.
In [61], they used two different sensors, and each of them has a different measurement technique to capture data, while our project uses the same PPG sensor on multiple sites in the body.
In relation to research [26], our project does not seek to compare results between different ages, unlike the aforementioned study that was carried out to check whether there were any differences in PTT depending on the age.
The research presented in [34] it is the most similar to our project, as it was developed to measure different parts of the human body in real time in order to send the data collected to a smartphone via BLE. But they did not use only PPG sensors, but also Electroencephalography (EEG), ECG and respiration sensors to measure four different types of body signals on a WBSN. However, all of these sensors make the patient to be tied to may paraphernalia, do not allowing its mobility as desirable.
The use of multiple PPG sensors is important to evaluate the results obtained from the sensors positioned at different areas of the human body. The results of blood oxygen saturation levels collected from them may help to diagnosis a possible disease related to cardiovascular problems.
4.2
Diseases that can be analyzed by PPG
According to the World Health Organization (WHO), the annual number of deaths caused by cardiovascular diseases may reach 22.2 million people in 2030, a 27% increase when compared to figures from 2012 [62]. After analyzing the main causes of death in Portugal [5] (see Fig.4.1), it is clear that cardiovascular diseases are the main cause and, in most cases, they may be associated with diabetes [60].
4.3. Applications for Heart Rate Monitoring 33
Due to the increasing number of deaths related to diabetes and cardiovascular diseases, which may or may not be influenced by diabetes, several researches [59] [63] [64] [65] have been done in this field, using different types of sensors to analyze any changes in the human body that may be helpful to detect diabetes at an early stages.
As our project uses photoplethysmography, and a study was done to find projects and publications aiming to detect or monitor diabetes using PPG.
In [59] a study has been conducted using a bilateral finger PPG, where the patient’s right arm had a pressure cuff attached to simulate an ischemia. As a result, it was possible to analyze the difference between the blood flow from both arms and to identify any differences in terms of Flow-Mediated Dilation (FMD) among a diabetic and non-diabetic (healthy) populations.
A comparison in [30] among the right-left correlation for diabetic and healthy people was made using PPG sensors measuring four sites in the human body, which were the two index fingers and the two second toes, in order to provide a practical and suitable evaluation of the sympathetic nervous system function.
Mediated by the sympathetic nervous system, Very-Low Frequency (VLF) sponta-neous fluctuations may present some difference between right-left correlations from di-abetic to non-didi-abetic populations. Therefore, a research [30] was conducted with the purpose of investigating whether reduced right-left correlations are related to diabetes complications.
In order to validate if a portable device using PPG created to measure Toe Blood Pressure (TBP) was performing as well as the conventional method used for that purpose - laser Doppler - a research [65] has developed a fully automatic TBP with a system to make the pulp blood, and also with methods to inflate and deflate by an occlusion cuff.
4.3
Applications for Heart Rate Monitoring
Advancements in technology, as well as the evolution of smartphones over the last few decades, have changed people’s behaviour in using smartphones only to make calls and send messages, and they use them to install applications that not only keep them entertained, but also help them to stay healthy.
According to a research conducted by GSMA Intelligence Data, and extracted from a report [66] from ”We Are Social and Hootsuite”, the total number of mobile users is around 5.135 billion individuals, which is equivalent to 68% mobile penetration among the total population worldwide.
Along with the technology advancements, the application market has grown signifi-cantly in recent years. As a result, 78,000 new apps were added to online stores, while the
![Figure 2.2: Test using force pressure [1].](https://thumb-eu.123doks.com/thumbv2/123dok_br/18590975.908691/35.892.225.703.594.882/figure-test-using-force-pressure.webp)


![Figure 3.5: A user’s hand with Shimmer3 GSR collecting vital signs as PPG [2].](https://thumb-eu.123doks.com/thumbv2/123dok_br/18590975.908691/49.892.228.700.138.419/figure-user-hand-shimmer-gsr-collecting-vital-signs.webp)