Department of Informatics Engineering
Internship report
Master in Informatics Engineering - Mobile Computing
Earth Observation
Department of Informatics Engineering
Internship report
Master in Informatics Engineering - Mobile Computing
Earth Observation
Srinivas Kencahppa Singadi
Master's internship conducted under the guidance of Dr. Antonio Mnauel de Jesus Pereira, Professor of the School of Technology and Management of the Polytechnic Institute of Leiria.
Dedication
In memory of my father ...Acknowledgement
Foremost, I would like to express my sincere gratitude to my supervisor Doctor Antonio Mnauel de Jesus Pereira for the continuous support of my Internship, for his patience, motivation, enthusiasm, and immense knowledge. His guidance helped me in all the time of Internship and writing of this report. I could not have imagined having a better advisor and mentor for my Internship.
Besides my supervisor, I would also like to thank Pedro Borges, from XSealence for proposing a very interesting project and for the support and for their encouragement, insightful comments, and hard questions during the internship. I also want to thank the people at XSeaelence and Tecmic for having welcomed me with open arms and for creating a friendly environment.
My sincere thanks also goes to my course coordinator Dr. Carlos Fernando Almeida Grilo, for helping me to get an Internship in such a good company.
A thank-you to my colleagues in the daily work, thank you, Joel, João, Ze Pedro, Jóni and André for giving such a wonderful environment to work.
Last but not the least, I would like to thank my family: my parents Kenchappa Singadi and Shanta Singadi, for giving birth and supporting me spiritually throughout my life.
Abstract
This is a system project report explaining Earth observation project undertaken during my internship with XSealence S.A. The project was proposed by the company but since it was a large project it was divided into small several units and assigned to various groups. The report has been divided into various chapters which discuss the software development life cycle of Earth observation system. the project used agile development model which allowed the project to be divided into various phases. The first phase is discussed in the first chapter which helped state the motivations behind the project. Buoyed by rising demand for marine weather forecast XSealence S.A company developed a marine weather monitoring web application to monitor and predict weather data based on data downloaded from Copernicus marine monitoring service. So as to have an installable system that can be installed on sea vessels XSealence S.A developed a desktop version of the same. This report discusses the development of earth observation system which is the part of the main desktop application. The aim of developing earth observation was to help predict the marine weather. The project initialization involved setting project aims and goals which were to guide through the development process. The main project goal was to deliver a desktop application that will help forecast marine weather. The application was linked to Copernicus marine monitoring service where it downloaded data in a .nc format and converted to .txt format.
The system requirement phase involved the collection of functional requirements of the system. With the help of my supervisor, it was established my part of the main system only needed to predict marine weather including water and ice speed, water velocity, sea surface height, temperature among other marine weather options. These capabilities of the system helped in system design and development to ensure the final product meets the set targets.
The system was tested for the achievement of system goals and objectives as stated in system functional requirements. Functional requirements achievement was tested using test use case. The test case tested every functionality of the system to establish the non-achieved goals and objectives. These defects found were communicated to the developer for correction in the subsequent releases. The system has been handed to the XSealence S.A for integration with another main desktop application. The entire system maintenance and deployment will be done by the company. To close the project, documentation was done to cover all activities of the project.
Resumo
O presente relatório foi dividido em vários capítulos que discutem o ciclo de vida do desenvolvimento de software de um sistema de observação da Terra. O projeto usou um modelo de desenvolvimento ágil que possibilitou a divisão em várias fases. A primeira fase é discutida no primeiro capítulo que ajudou a indicar as motivações por trás do projeto. Impulsionada pela crescente necessidade de uma previsão meteorológica marítima a empresa XSealence S.A desenvolveu uma aplicação web para monitorização e previsão, do estado tempo marítimo, baseada no serviço de monitorização marítimo Copernicus. De modo a ter um sistema que possa ser instalado em embarcações marítimas, a XSealence S.A desenvolveu uma versão desktop do mesmo. Este relatório discute o desenvolvimento de um sistema de observação da Terra, que faz parte da aplicação de desktop principal.
O objetivo do desenvolvimento da aplicação “Observação da Terra” foi ajudar a prever o clima marítimo. A parte inicial do projeto consistiu na definição dos objetivos e metas do projeto que guiarão o processo de desenvolvimento. O principal objetivo do projeto era o de entregar uma aplicação de desktop que ajudaria a prever o clima marítimo. Esta aplicação está conectada ao serviço de monitorização marítima Copernicus, do qual são descarregados os dados em formato “.nc” e convertidos em formato ".txt".
A fase de requisitos do sistema envolveu a recolha dos requisitos funcionais do sistema. Com a ajuda do meu supervisor, foi estabelecido que a minha parte do sistema principal só era necessária para prever o clima marítimo, incluindo velocidade da água e do gelo, velocidade da água, altura da superfície do mar, temperatura, entre outras opções, de tempo marítimo. Estas capacidades do sistema ajudaram na conceção e desenvolvimento do mesmo de modo a garantir que o produto final atinja os objetivos estabelecidos. Os diagramas UML, incluindo o caso de uso, diagramas de fluxo de dados ajudaram a ilustrar o fluxo de informações no sistema. Esses projetos, juntamente com os diagramas de classe, foram convertidos numa solução de trabalho durante a fase de desenvolvimento do sistema conforme planeado na fase de planeamento do projeto da metodologia ágil.
O sistema foi testado de modo a avaliar se as metas e objetivos do sistema foram atingidos conforme o estabelecido nos requisitos funcionais do sistema. A aferição dos objetivos definidos nos requisitos funcionais foi efetuada usando um caso de uso para teste. Para tal foram testadas todas as funcionalidades do sistema para de modo a identificar metas e objetivos não alcançados. Estas “imperfeições” forma comunicadas ao “desenvolvedor” do projeto para correção nas versões subsequentes. O sistema desenvolvido foi entregue à empresa XSealence S.A para integração com outra aplicação de desktop principal. Toda a manutenção e implantação do sistema será feita pela empresa. Para concluir o projeto foi elaborada documentação de modo a descrever e ilustrar todas as atividades do projeto.
Index of Figures
Figure 1: XSealence business and technology partners ... 3
Figure 2: MSDN Weather Report in bar graph ... 8
Figure 3: MSDN line series graph ... 8
Figure 4: WMS Architecture ... 10
Figure 5: Example of WMS Request ... 12
Figure 6: Layers of Copernicus product ... 13
Figure 7: WMS Layers ... 13
Figure 8: Numeric data of weather ... 14
Figure 9: Marine traffic layers ... 15
Figure 10: Marine Traffic Numeric Representation ... 15
Figure 11: Wind layer of Predict Wind application ... 16
Figure 12: Fish Weather (FW) layers ... 16
Figure 13: GIS layers ... 20
Figure 14: Vector GIS ... 21
Figure 15: Raster GIS ... 21
Figure 16: OSM in Tatuk editor ... 23
Figure 17: OSM tiles with layers ... 24
Figure 22: Incremental Model of the software development model (SDLC) showing various
increments up to nth increment ... 30
Figure 23: Agile Model of the software development model (SDLC) ... 31
Figure 24: work breakdown structure activities was used to develop Gantt chart ... 36
Figure 25: The project Gantt chart ... 37
Figure 26: Earth observation desktop application workflow diagram ... 41
Figure 27: The system use case diagram ... 43
Figure 28: Earth Observation level 1 Data Flow Diagram ... 45
Figure 29: The desktop application class diagram ... 46
Figure 30: Weather data in.NC file ... 50
Figure 31: A bar graph showing how common is SQL injection is performed by attackers ... 53
Figure 32: Oracle database firewall showing its alert, allow and blocking boundary ... 54
Figure 33: Architecture of Oracle DB ... 54
Figure 34: Downloading data Architecture ... 55
Figure 35: Columns in Database Table ... 56
Figure 36: Task Scheduler in the windows server ... 58
Figure 37: Multiple Triggers ... 58
Figure 38: WMS Architecture of fetching layers ... 60
Figure 39: Copernicus Services ... 61
Figure 40: State of Sea window ... 62
Figure 41: Base map (all checkbox unchecked). ... 62
Figure 42: Base with Layer temperature ... 63
Figure 43: Architecture of requesting the data ... 64
Figure 44: layers numeric data representation ... 65
Figure 45: Annotation representation ... 66
Figure 46: WPF window of numeric data ... 67
List of Acronyms
Throughout this document several acronyms are presented, the meaning of which is described in the table below.
Sigla Significado
VMS Vessel Monitoring System ICC Integrated Control Center MSDN Microsoft Developer Network OGC Open Geospatial Consortium WCS Web Coverage Service WFS Web Feature Service FW Fish Weather
WPF Windows Presentation Foundation GIS Geographical Information System
FAO Food and Agriculture Organization of the United Nations DEM Digital Elevation Model
SDK Software Development Kit
GMES Global Monitoring for Environment and Security ESA’s
HTTP Hypertext Transfer Protocol DFD Data Flow Diagram
RDBMS Relational Database Management System IDE Integrated Development Environment XE Express Edition
I/O Input and Output C# C Sharp
MONICAP MONItorização e Controlo das Ativdades de Pesca MVC Model View Controller
UI User Interface OSM OpenStreetMap
Index
EARTH OBSERVATION ... I EARTH OBSERVATION ... II ACKNOWLEDGEMENT ... III ABSTRACT ... V RESUMO ... VIII INDEX OF FIGURES ... XI LIST OF ACRONYMS ... XIII INDEX ... XVICHAPTER 1: INTRODUCTION ... 1
1.1BACKGROUND INFORMATION ... 1
1.2SIGNIFICANCE OF THE PROJECT ... 1
1.3RECEPTION ENTITY ... 2
1.4SIGNIFICANCE OF RESEARCH ... 3
1.5THE PROPOSED SOLUTION ... 4
1.6AIMS AND OBJECTIVES ... 5
1.7STRUCTURE OF THE DOCUMENT ... 6
CHAPTER 2: STATE OF THE ART ... 7
2.1OVERVIEW ... 7
2.2WEATHER ... 7
2.3WMSLAYERS ... 9
2.4WMSARCHITECTURE... 10
2.5EXISTING APPLICATION USING WMS ... 12
2.6CONCLUSION FOR STATE OFART... 18
CHAPTER 3: GIS MAP ENGINES ... 19
3.1OVERVIEW ... 19
3.2GISMAP ENGINES ... 19
3.3TATUKGISENGINE ... 22
3.4APPLYING LAYERS USING TATUK EDITOR ... 23
3.5WINDOWS FORM ... 24
3.6WPF(WINDOWS PRESENTATION FOUNDATION) ... 25
3.7SHARP MAP ... 26
3.8CONCLUSION FOR SELECTING GIS ... 27
CHAPTER 4: METHODOLOGY AND MANAGEMENT ... 28
4.1OVERVIEW ... 28
4.2PROJECT METHODOLOGY ... 28
4.3PROJECT MANAGEMENT ... 34
4.4CONCLUSION FOR PROJECT METHODOLOGY AND MANAGEMENT ... 37
5.1OVERVIEW ... 38
5.2COPERNICUS MARINE ENVIRONMENT ... 38
5.2.1 The Copernicus Space Component ... 38
5.2.2 The Copernicus InSitu component: ... 39
5.2.3 The Copernicus Service component ... 39
5.3TECHNOLOGIES USED ... 40
5.4WORKFLOW ARCHITECTURE OF BOTH FRONTEND AND BACKEND ... 41
5.5USER CASE DIAGRAM ... 41
5.6DATA FLOW DIAGRAM ... 44
5.7CLASS DIAGRAM ... 45
5.8CONCLUSION FOR SYSTEM DESIGN AND COPERNICUS ... 47
CHAPTER 6: BACKEND DEVELOPMENT ... 48
6.1OVERVIEW ... 48
6.2DOWNLOADING DATA FROM COPERNICUS ... 48
6.3MOTU CLIENT ... 49
6.4IMPLEMENTATION ... 49
6.5ORACLE DATABASE ... 51
6.6ARCHITECTURE OF ORACLE DB ... 54
6.7ARCHITECTURE FOR DOWNLOADING THE DATA ... 55
6.8IMPLEMENTATION ... 55
6.9SCHEDULED SCRIPT ON THE SERVER ... 57
6.10CONCLUSION FOR BACK-END DEVELOPEMENT ... 59
CHAPTER 7: FRONTEND DEVELOPMENT ... 60
7.1OVERVIEW ... 60
7.2THE ARCHITECTURE OF WMSLAYERS... 60
7.3APPLYING LAYERS ... 61
7.4ABOUT THE LAYERS ... 61
7.5REPRESENTATION OF WEATHER FORECAST DATA: ... 64
7.6ARCHITECTURE OF REQUESTING THE DATA FROM THE DATABASE... 64
7.7IMPLEMENTATION WITH WINDOWS FORM ... 64
7.8IMPLEMENTATION WITH ANNOTATION ... 66
7.9IMPLEMENTATION WITH WPF WINDOW ... 67
7.10SYSTEM TESTING ... 68
7.10.1 Unit Testing ... 69
7.10.2 White Box Testing ... 69
7.10.3 Quality Assurance Testing ... 69
7.10.4 Test Cases ... 70
7.11CONCLUSION FOR FRONT-END DEVELOPMENT SYSTEM TESTING ... 75
CHAPTER 8: CONCLUSION AND FUTURE WORK ... 76
Chapter 1: Introduction
1.1 Background information
The weather forecast is fundamental for conducting our daily activities. Agriculturists agree that weather forecast information helps them to prepare for the planting and for harvest. Airport control centers need to comprehend local environmental condition to schedule flights. Fishing activities might want to know the prevailing weather information before going into the sea for fishing. Weather forecasting help makes informed decisions on everyday life as it offers various information including expected rains, wind strength and direction, expected temperatures, humidity, atmospheric pressure and many other aspects of weather.
Weather forecasting includes collection available weather information describing the current state of the atmosphere (particularly the temperature, humidity, and also the wind) and using the understanding of atmospheric processes (through meteorology) to determine or predict how the atmosphere evolves within the future.
Present day climate estimating infrastructure includes a blend of computer models, observation, and a knowledge of trends and patterns. Utilizing these strategies, sensibly precise estimates can be made up to around one or two days ahead of time. From this data, point by point estimates is less helpful, since atmospheric conditions like temperature and wind direction are extremely unpredictable.
The vast majority of the computer models utilized for forecasting are controlled by the National Weather Service, which makes figure models in view of complex equations. These models are utilized by a wide range of climate and news benefits in getting ready day by day estimates. Local climate observers, balloons, satellites, and climate stations additionally help give information on weather derived from the collected data estimates.
negative and prolonged impacts, as well as reduced private sector investment and productivity related to economic and environmental uncertainties.
Weather forecasts play a very important role in the fishing activities because they to plan their schedules by considering the weather forecasts. And in the recent days fishing activities are increasing day by day, and overfishing is one of the major problems in the marine territory which is grabbing the attention of the authorities of national and international. Overfishing only occurs, when the number of fish caught exceeds the set number of fishes to be caught in a certain period of time and there is no natural reproduction replacement done[1]. Overfishing creates marine life imbalance as well as affect the coastal communities who depend on fish for their way of life. Billions of people depend on the fish for proteins, in the case of marine life imbalance if there is an imbalance then it’s going to affect the billions of people around the world. In today’s life, more than 85 percent of fisher’s life have been crossed beyond their biological limits and also, they are targeting the particular species in the ocean which leads abundance of smaller marine species for this it requires strict rules and regulations.
The rate of illegal fishing activities has been increasing in the recent years in various areas. Various fishing regulation authorities have tried to come up with policies, procedures, and systems to curb illegal fishing. As a result, various technologies to avoid illegal fishing catches are been developed and implemented. Such regulation bodies include the XSealence, which is one of the companies which are developing vessel tracking application. The application allows regulation bodies can keep track of the vessel. The application monitors fishing activities and can detect when illegal fishing catches have occurred as well as a monitor if captured fish belong to protected species. The application also helps determine if the limit of weight of the allowed species has been exceeded. By using these kind technologies, we can easily maintain the marine life in a balanced way.
1.3 Reception Entity
The entity hosting this stage was Xsealence S.A. - Technologies do Mar SA, a company founded in 2013. Its main business area is maritime technologies, namely control, monitoring, and control. XSealence belongs to the Trailtec group to which Tecmic also belongs.
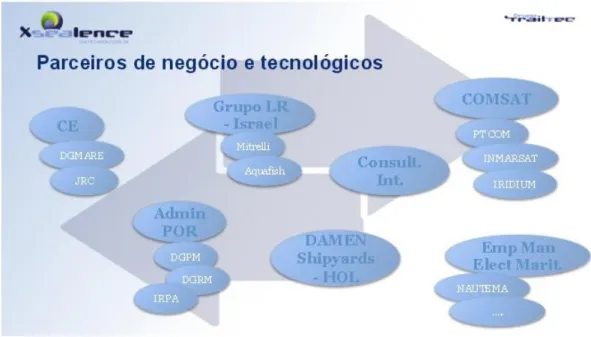
XSealence has roped in various partners so as to increase its service delivery and ensure quality marine life is protected. These partners include Aqua fish, JRC, IRPA, COMSAT, IRIDIUM, INMARSAT, NAUTEMA, Grupo LR of Israel, CE among other as shown in the figure below. XSealence relies on these entities for enhanced performance. The companies
share expertise and ideas on how to improve marine life. At the client level, it has MPA, IRPA, DGRM, among others. The area of influence extends to Portugal, Angola, Turkey, Ireland, Spain, and France.
Figure 1: XSealence business and technology partners
1.4 Significance of Research
In the past years, fishing was thought to be a leisure activity which mostly was done by the youth and their hobby. However, today fishing is considered a commercial activity which has attracted a lot of interest and activity alike. Fishing has grown to be a source of living for various families. Counties neighboring seas and oceans have engaged commercial fishing with some countries exporting the fish. This serves as part of the country income and thus boosting their economy. With commercial fishing being carried out in various water bodies, fish regulation and monitoring have grown to be one of the most key activity in marine life protection.
In the last few years back there were no problems like overfishing because at that time there were no technologies and no proper vessels to carry the fish. These problems have gained increasing attention in recent years as they challenge sustainable fishing. Overfishing is not a recent phenomenon but has been there and its worsening in recent decades[2]. According to the FAO, today, 25 percent of all the world fish stocks are either over-exploited or exhausted and another 52 percent are being fully exploited. Fish overexploitation has led invited slow and sure collapse of the fish industry with almost 80 percent of the fish and their species being overexploited, depleted or in the state of collapse[3]. Overfishing that can be described and characterized in several ways, but the idea is almost always the same: to make excessive catches in a short period in each ecosystem. In this way, the ecosystem will gradually degrade, for this reason, the quantity and variety of species present in this ecosystem are becoming smaller and smaller [4]. Illegal fishing creates a number of problems in the marine world, and it’s made to create the measures on them, such as to keep track the catches that are made. This Illegal catch is also a problem for sustainable fishing. This kind of overfishing should have rules and regulations in order to maintain the ecosystems in a balanced way and if they cross the limit they should be punished.
1.5 The proposed solution
The proposed system is a desktop application that gives marine weather prediction for the last 10 days. The given data include water and ice speed, the direction of the wind and other aspects of marine weather. Nowadays sea technologies are improving day by day, in order to help the marine community people. XSealence is one of the sea technologies company which is developing the application called vessel tracking, previously they did it web application called “web vessel tracking”, now they are working on the desktop application. XSealence already developed a device called MONICAP(monitoring and control of fishing activity)[5] is one of the systems which can help to prevent illegal, overfishing and also keep track the vessel. This MONICAP system is a VMS (Vessel Monitoring System). In brief about these two concepts are, they are the systems which are installed in the vessel this system helps to monitor their position and realized catches. This information is then transmitted to a control center where the fishing activity is monitored by the competent authorities, in particular fisheries authorities and the maritime authorities [6]. By using these kinds of application, the user can see the information about the vessel, they can create alternative sea routes when the intended route has bad conditions as shown by the application. Also, the application has a good Integrated Control Center (ICC) which is the desktop application that is installed
together with the MONICAP software at the control center to communicate with the shipping vessel. In that project, my part of work is Earth Observation which is explained in detail in the upcoming chapters. The project was started so to help people around the globe see various weather information of some specific areas defined by their coordinates. The desktop application will show various marine climatic conditions such as ocean mixed layer thickness based on sigma theta, sea ice thickness, sea area fraction, ice velocity towards a various direction, potential temperature, water salinity, water velocity and other various sea weather aspects. This information will not only help the fishermen but sea sailors as well. The boat controllers as well as shippers control towers will be able to monitor prevailing conditions in the sea and about the locations of their ships and advice the ship crew accordingly.
Ocean or sea weather data is crucial for all sea users as it serves to predict the conditions to expect and prepare a disaster management plan for any eventuality. Such data can help save lives and help fishermen is their daily fishing activities. The information is equally useful to boat and ship users as the sail through the sea or ocean.
1.6 Aims and Objectives
The application was developed primarily to give weather forecast to sea and ocean bodies users:
i. To provide marine weather forecast to fishermen and sailor as well as marine regulatory bodies;
ii. To predict possible marine weather information such as ice and water velocity
iii. To offer specific marine information about a specific location indicated by its coordinates;
iv. To provide past 10 days data on marine weather to help in informed decision making; v. To design and implement an offline marine weather forecast information that can
installed on sea vessels to help in times of bad internet connection problems. The desktop application will offer reliable and easily accessible marine weather forecasts.
1.7 Structure of the document
This paper will be organized into various sections in form of chapters. Each chapter will seek to address a specific issue on fishing and weather monitoring of the proposed desktop application.
• Chapter 2: This chapter discusses the various systems that exist for vessel and fisheries monitoring.
• Chapter 3: This chapter discusses the GIS map engines.
• Chapter 4: This chapter explains in detail the development methodology used, project planning and management.
• Chapter 5: This chapter outlines the Copernicus Services and technologies used. • Chapter 6: This chapter discusses the Backend development.
• Chapter 7: This chapter explains the Frontend development and Tests.
• Chapter 8: This chapter reflects on the work developed throughout this stage and describes the future work.
Chapter 2: State of the Art
2.1 Overview
In this chapter aims to describe the existing systems technologies that are used for the weather forecasting, and WMS (Web Map Service).
2.2 Weather
Weather provides the state of the sea based on marine data collected. For fishing activities, weather information is extremely important. Fishermen and fishing companies need ocean weather forecasts like sea temperature, sea water velocity, Ice speed, wind speed and so on, so as to know when it is safe to go fishing and when it is not. Earth consists mainly two important pressured environments weather (Air and Water). Sensible weather and the day-to-day weather that we experience every day-to-day is one of many factors that affect fishing as well as our daily lives. But weather plays a very important role for fishing because before entering the sea, the fishers will check the state of sea i.e. sea temperature, water velocity, the wind etc. By doing this they will get information about the state of the sea, and moreover, they can watch the earlier day's atmosphere and anticipate the future day's climate, and ultimately, they will get a sensible thought with respect to the weather.
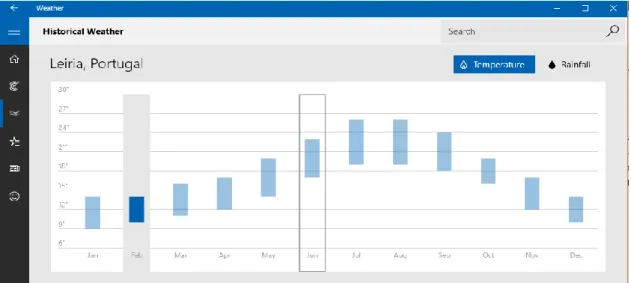
For the weather forecasting, there are existing applications, which may be seen everywhere from desktop to smartphones or even wearable devices. some of them are Microsoft desktop application, Google weather, now a day there are so many weather applications are available. In the below figure2(which is taken from the MSDN application[7]) which gives the overview bar graph and also line series graph.
Figure 2: MSDN Weather Report in bar graph
In figure 2, we are observing two tabs in the i.e. temperature and rainfall. In the temperature it will give the normal temperature level of all months in a year, we can see that in the above figure we normal temperature of all months, however, this is not precise, it's just with an average temperature of a specific month.
Figure 3: MSDN line series graph
In figure 3, its line series graph but this is giving the information on hourly basis, this hourly basis temperature is also important for fishing because they can easily decide about the next movement.
For fishing activities with these weather data and graph if its include the layers like temperature, wind, water velocity, ice speed etc. on the top of the map it’s easy to recognize the weather information. In the next section is going to discuss these WMS layers.
2.3 WMS Layers
In the recent last ten years or so, there has been a great innovation of geographical information science and technologies which have tremendously increased and thus making the whole idea of marine sea weather forecasting easy and enjoyable. Today there are more than ten thousand map layers are available in online through Open Geospatial Consortium (OGC) specified an interface, such as Web Map Service (WMS), Web Feature Service (WFS), and Web Coverage Service (WCS)[8]. A Web Map Service (WMS) layer is built on data from OGC (open geospatial consortium) WMS server. The web map service layer allows the users to access these services over the internet. It produces maps of spatially referenced data dynamically from geographic information[9].
WMS provides the spatial information to the internet users by the map images, this spatial information or data are stored as vector data. It is very difficult to load the whole image showing the entire map of a requested location, thus when the requests are made, the image is divided into several sub-rectangles. Subdivision to multiple rectangles allows fast to loading of the images on the map, for example each sub-rectangle is sent to a WMS node to produce some maps, the resulting map is produced by these maps and moreover all these sub-maps are produced in parallel so in this way its saves the loading time of the WMS layers on the map [10].
2.4 WMS Architecture
Figure 4: WMS Architecture
The above figure demonstrates the WMS architecture, the data is stored in the data store and it’s made accessible to others for use by means of the WMS. The more details about the WMS is explained in the upcoming chapters.
A simple WMS request is explained as follows: 1. Server details (a WMS 1.3.0 request); 2. Request type (WMS Get Capabilities); 3. Layer name (global-analysis-forecast).
The WMS provides simple HTTP interface for requesting geo-registered map images from one or more distributed geospatial. The WMS requests define the layers to be processed, the response to the request is in the form of images (returned as JPEG, PNG, etc.) which is displayed on the desktop or browser application. The request and response from the WMS are done according to a specific standard[11], there is three standard and third is optional from the given below:
1. GetCapabilities: This standard, which can query the WMS' capabilities; 2. GetMap: This standard, requests a specific map;
WMS solicitations are composed of the address of the server the request is being sent to and a progression of parameters. There are two sorts of request that are needed for any WMS request for GetMap and GetCapabilities. In spite of the evidence that GetCapabilities is typically the main request sent, it's less complex that GetMap and not generally required, so it's clarified later. A GetMap ask for is diagrammed beneath, separated into its segments. The GetMap ask is broken into three lines, however, it's only one demand. GetCapabilities solicitations can be made by embedding’s "GetCapabilities" set up of "GetMap" in the "REQUEST=" parameter. No different parameters should be indicated.[12] For instance, the valid GetCapabilities request is as given below diagram.
Figure 5: Example of WMS Request
In the above figure, it’s clearly explained that:
1. Server address which is provided in every WMS request made. The server address ends with question mark parameter;
2. The sign & Separates statements/parameters; 3. Defines this string of letters as a WMS request; 4. WMS request defines the type of WMS request; 5. Additional Parameters.
In the next section going to explain the existing application which are using the WMS layers.
2.5 Existing application using WMS
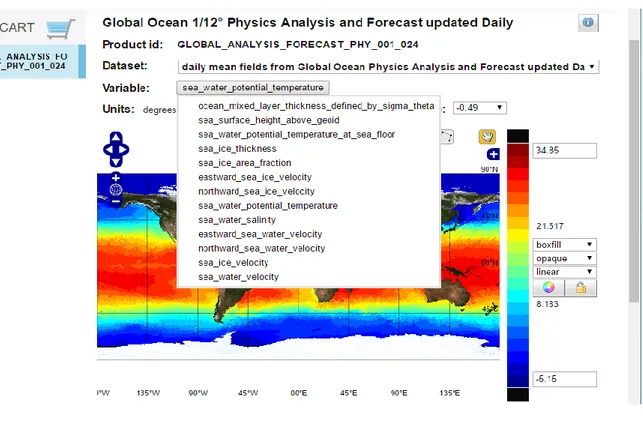
In the present days, there are many applications which are using the WMS service, it may be a desktop application or Web application. The WMS services are very important to the marine traffic control and also human activities, by the help of the WMS services, weather layer can apply on the top of the map so people can easily recognize where is it's more or less by seeing the WMS layer. The reference application for our desktop application is Copernicus product, the Copernicus is the European Commission site. Copernicus is a European Commission site which can provide the weather data, WMS services and so on for the marine environment and monitoring. And it's having their own product which used WMS services for displaying the layers and it also shows the numeric data representation as shown in the below fig(taken from Copernicus product)[13]
Figure 6: Layers of Copernicus product
In the above figure 6 we are seeing various weather layers like temperature, sea surface height, water velocity, ice velocity, potential temperature at sea floor, salinity etc. when the user selects the layer, its connects to the server as discussed in the above section in order to reflect to the other layers on top of the map which is as shown in the below figure.
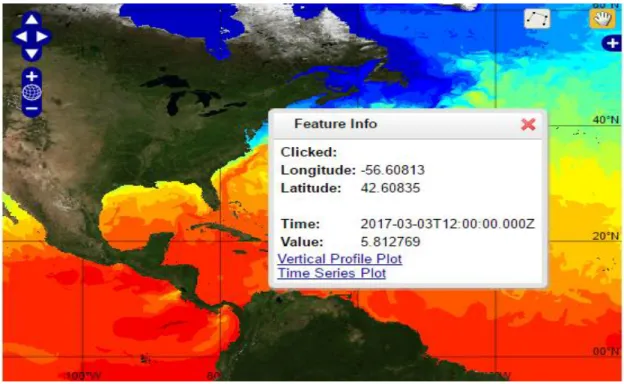
numeric data. The user clicks at a point on the map, for instance when users click at a particular latitude and longitude it’s going to give the value of that specific point.
Figure 8: Numeric data of weather
In today’s life, there are many desktops applications like Predict Wind Offshore, MSN weather etc. and web application like marine traffic, fish weather (FW) etc. Predict Wind runs a global weather model of 50-kilometer resolution using two sources. It generates 1 kilometer or 8-kilometer resolution forecasts for world’s popular areas [14]. Predict Wind own several mobile applications and forecasting website as well to assist interpret weather data collected. It uses various tools and representation charts such as line, bar graphs as well as wind arrows and maps to show weather information.
MSN weather runs weather forecast mobile apps and the web an online web application which offers the latest conditions expressed in hours, days or on the 10-day scale. The weather app was designed to run on Windows platform. It supports various data representation such as images and graphs. The app's features access a 10-day and hour forecast from various weather data providers and historic weather averages. This capability gives it a current weather data about various cities over the globe. The data details the weather data, Doppler, cloud cover, travel maps as well as satellite. It helps prepare for the harsh and severe weather in any city.
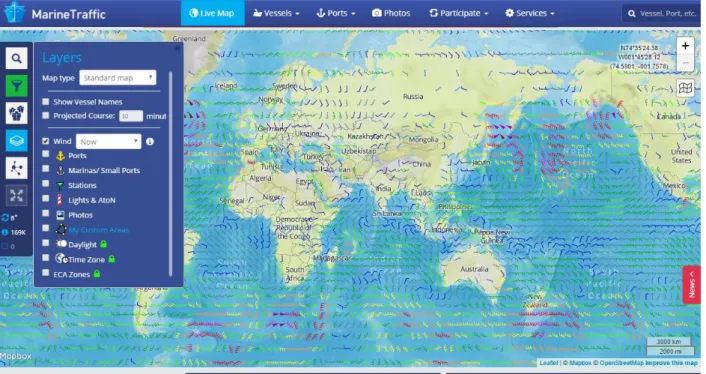
Marine traffic[15] is one of most useful application for the vessel tracking in this application they are providing the various layers on the top of the map, but they representing only one weather layer i.e. wind layer which is as shown In the below figure 9(which is taken from marine traffic[15]).
Figure 9: Marine traffic layers
direction, the live wind direction is very helpful for the users or the marine community people. Its gives alerts to the alerts to the users and represents the wind flow direction in arrows and also in wind bars as shown in figure 11 [16].
Figure 11: Wind layer of Predict Wind application
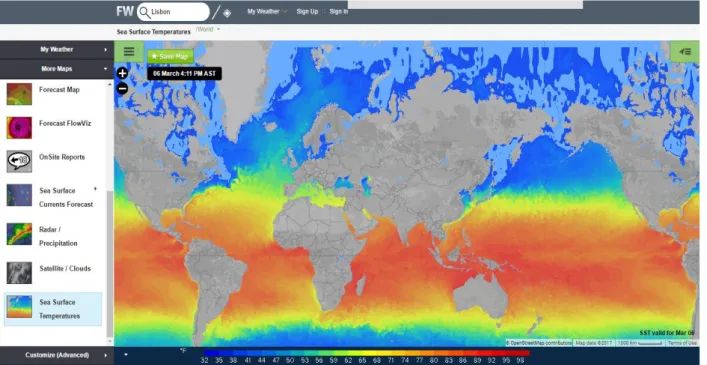
Fish weather (FW) is another application which helps for fishing activities, it can predict the weather forecasts by applying the layer on top of the map, in this application, they present various layers of weather information like temperature, wind, clouds etc. For fishing activities, the weather forecast is very important because by seeing this layer they can easily decide the fishing activities. The application displaying the weather layers is as shown below[17].
Most of the weather apps discussed either run on windows or android applications. However, Linux, iOS platform users have been equipped with weather applications as well. Weather underground and free iOS app have entered the weather forecast industry. The app runs on both iOS and Android devices. Unlike other apps, Underground weather app uses a network of personal weather stations. Other apps usually use NEXRAD radar data. The weather stations have weather measuring suite of instruments. There are over 200,000 personal weather stations that gauge temperature, wind speed, humidity, pressure, and direction [18]. The app gives a super detailed weather forecast hourly. The give radar imaging as well as projected storm path. Weather Underground is user oriented as gives you what you really need. For instance, most apps give when the sun rises and set but gives information on when it will get dark. This helps travelers decide if to cycle faster so as to reach the expected destination before it gets dark.
Dark Sky an Android and iOS app pulls data from national oceanic and atmospheric administration network. The network consists of 140 radar stations spread across the US using some fancy math to predict the hyper-local weather. International dark sky association believes weather can be chaotic and individuals can see and predict weather patterns in local and small scale. The app uses phone sensors to collect and generate local weather forecast via its report feature on NOAA radars. The app focuses on now and presents location data. The data predicts the next hour and within the user area[18]. The app has the ability to tell which minute of the next hour it is going to rain through extended forecast features. The app also has slick global view feature for global radar which show broad weather patterns over the globe. Users can zoom in and see their country, state, and town.
Rain Aware is a hyper-local short-term forecasting feature referred to as “nowcasting”. Rain Aware extracts data from radar, satellites and surface stations. The app has ability forecast precipitation in the user local area as a way to predict the local storm path. The app gives a detailed view of the weather in the next 3 hours. The app tells when is going to rain and how long it will rain. The app also gives a general prediction of the next 24 hours, as well as 7 days, predict with up to date images[18]. The up to date imagery give minute storm
2.6 Conclusion for State OF Art
In the above sections discussed about the existing application. There are various apps have been developed to predict marine weather. Some of the apps such as Rain Aware have real time reporting systems. However, the systems concentrate on only one element of weather such as rain, storm, wind or humidity. Today many applications developed on weather forecasting run on android, and iOS phones as the data carried is only useful to individuals. However, earth observation is the part of the application that shows various voluminous marine data which include temperature, water salinity, water speed, ice velocity and well as wind direction and speed. The application can be installed on marine vessels to give weather predictions for the last 10 days which other apps do not give.
In the upcoming chapters is going to discuss the technologies used and implementation of the project in detail.
Chapter 3: GIS Map Engines
3.1 Overview
This chapter discusses the two GIS search engines namely the Tatuk GIS and Sharp map. The first section discusses the Tatuk GIS in the Tatuk editor, on the top of the Tatuk OSM applying the weather forecasts layer. The discussion Visual studio that is window form and WPF (Windows Presentation Foundation), later discussed the sharp map and final conclusion about the two GIS search engines.
3.2 GIS Map Engines
GIS stands for "Geographical Information System" which is a framework for capturing, storing, checking. GIS is primarily concerned with a showing of the related information to positions on Earth's surface. GIS is the blend of computer both hardware and software as talked about in the above explanation, it is composed around advanced database which can store, manipulate, capture, analyze, create, and display spatially referenced data [17].
GIS employs the use of polygon warning to perform the geospatial analysis. GIS is used to develop the proposed application as it will help in collecting the weather data on various locations identified by their coordinates. The data will be used for plotting, analysis, visualization and weather data interpretation. The interpreted data will serve as the prognostication of weather. The application will help the marine authorities and users in instantaneous of determining weather data in specific areas indicated by use of longitude and latitude at various atmospheric isobars [19]. The GIS
GIS empowers people more effortlessly observe, analyze, and understand patterns and relationships with GIS technology. GIS users can compare the locations of different things to discover how they relate to each other. For instance, by utilizing the GIS, the client can
Figure 13: GIS layers
The different layers of map data are stored in the database, these different layers of the map are having its own layer of map theme, for example, a layer for roads, a layer of soils, a layer for rivers, etc. In figure 13(which is taken from [20][21]) is having a different set of layers, the GIS is a kind of electronic overlay, query, manipulate, and combine the various layers to create maps aimed at a specific purpose.
The map information is stored in the database is isolated into two fundamentals format which is the raster design and the vector principal configuration. The vector format can store spatial information as focuses, lines, or polygons. The vector GIS organization is much similar to conventional paper maps. The vector GSI in fig 14 [20] is having great database availability, great cartographic yield, yet it has poor surface displaying and restricted investigative abilities. Fig 14 demonstrates the distinctive components in a vector GIS, with soils spoken to as polygons, wastes as lines, and archeological locales as focuses.
Figure 14: Vector GIS
The second method of GIS data modeling is raster. The model resembles spreadsheet arrange with lines and sections. GIS raster model has a great surface display with great logical abilities. However, it has to have poor cartographic yield[20]. The lines and segments of the spreadsheet are fixing to x, y directions of the crossing point of each line and section shaping a cell which compares to a particular region in this present reality. Fig 15 demonstrates a similar soil map in Fig 13, but now in a raster arrange.
Figure 15: Raster GIS
The one very important type in the raster GIS is DEM (Digital Elevation Model). The changes in elevation in the raster format are indicated by changing z-axis values in each cell. The evolution in the DEM is continuously changing across the surface by creating a more realistic
3.3 TatukGIS Engine
The TatukGIS is one of the customs developing kits, its developer kernel is a professional-level GIS software development kit (SDK) for creating stand-alone, client-server, web server, embedded, and mobile applications. TatukGIS is useful for adding GIS functionality to effectively existing items, porting software from less creating custom GIS applications appealing GIS advancements, and from scratch [22]. TatukGIS product supports the multiple development platforms, some of them are Microsoft.NET for WinForms and WPF, Microsoft ActiveX/OCX, Microsoft ASP.NET (for web solutions), Microsoft.NET Compact Framework (for mobile solutions), Embarcadero Delphi/C++Builder VC etc. The best thing in the Tatuk GIS is that each developer kernel edition reflects essentially the same API, framework, and technology, which makes as possible to port GIS applications across development technologies and operating systems. The TatukGIS Developer Kernel is known for execution, rich and legitimate API, local support for most (raster, vector, and geodatabase) formats, state-of-the-art support for coordinate systems, 3D representation, consistency with many open principles, and sensible authorizing[22].
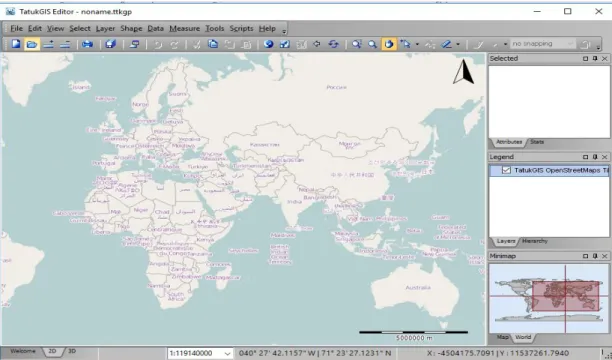
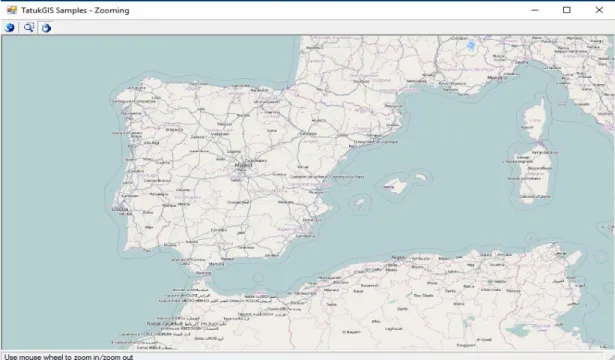
TatukGIS has the wonderful editor, Tatuk editor helps to merge the layers in an easy way, and again it has lots of options to do various kinds of maps. The TatukGIS Editor is a professional, universally useful desktop GIS mapping and information altering application with inherent scripting condition for customization and highlight expansions. The highlights include Viewing, 3D Viewing, Editing, Coordinate Systems, Rectification, Scripting, Databases. Locally (without import or configuration transformation) opens and shows an extensive variety of vector, picture, grid, and SQL database layer groups, including progressed spatial server geodatabases. WMS, WFS, and WMTS mapping services might be opened from the web. Complete visual layer property, legend, and scale controls support deep customization of the map appearance[23]. The outlook of the Tatuk editor is as shown in fig 16. The Open Street Map tiles of the Tatuk GIS in the Tatuk editor, its opens smoothly and clear it’s as shown below[24]
Figure 16: OSM in Tatuk editor
3.4 Applying layers using Tatuk Editor
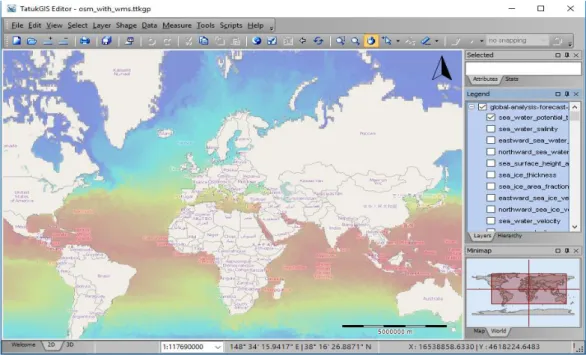
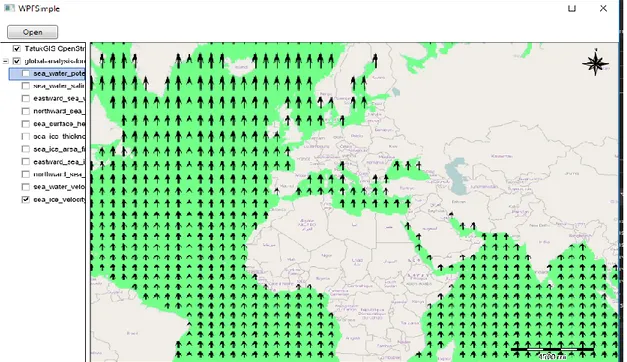
Tatuk editorial manager gives the best choice to check the WMS service layers fits for the Tatuk OSM (open street map). Adding the layers to the OSM of the Tatuk GIS, from the Copernicus, is a WMS service (Web Map Service). In the client-side, they can have diverse variables like temperature, sea water velocity, sea ice velocity and so on. In this picture, the OSM tiles of the Tatuk GIS is the base of the map and the layers are on the top, the users’ needs to make this service layer as translucent then both OSM tiles and layers are visible legitimately. It works fine in the Tatuk Editor, then for the testing purpose, it was implemented in Windows form as well as in WPF (Windows Presentation Foundation) which is shown in the next section.
Figure 17: OSM tiles with layers
3.5 Windows Form
The earth observation desktop application was developed in various releases. Each release was closed tested by my supervisor and the feedback worked on. In the end of the project, we ended up with a WPF form of weather data representation which was perfected from annotation representation. In the windows form, OSM tiles of the Tatuk GIS work properly and smoothly, but when the users try to add the layers on top of the OSM tiles of the base map, the OSM is not visible properly, its little bit hard to recognize the weather forecast layers, we overcome this problem in the WPF which is in the next section, the OSM tiles in the Windows form is shown below.
Figure 18: Tatuk OSM tiles in windows form
3.6 WPF (Windows Presentation Foundation)
The main reason for implementing in the WPF is that our whole company project in the WPF, so my company supervisor advised me to do it in WPF. Windows Presentation Foundation gives a very nice graphical representation of weather data with different types of layers or it’s very easy to change the layer from one layer to the other layer, but it takes lots of time to load or update the layer for example if user switch the layer from temperature to sea water velocity it takes lots of time to update the layer. WPF gets the layers from the online server and thus, it takes the time to update. OSM tiles and layers in the WPF is as shown below.
Figure 19: WPF with OSM and Layers
3.7 Sharp Map
Sharp Map is a simple to utilize mapping library for use in web and desktop applications. It gives access to many sorts of GIS information, empowers spatial questioning of that information, and renders lovely maps. The engine is composed in C# and based on the.Net 4.0 framework. [25] In the sharp map, the OSM (open street map) moves smoothly when compared to the other OSM GIS engines. Adding the WMS layers to the Sharp map is a really easy process, but its coast is too high.
3.8 Conclusion for Selecting GIS
In above sections, we saw two GIS engines that are Tatuk GIS and Sharp Map. In Tatuk GIS it’s easy to apply the layer directly from the server. On the other hand, in the sharp map, it’s easy to apply the layers from the server. However, the one of the main reason for selecting the Tatuk GIS is that sharp map is costlier then the Tatuk GIS and moreover later company decided to work with the Tatuk GIS, thus we continued with the Tatuk GIS in our project. The following chapter continues with the marine data downloading the data from the Copernicus by using the python script.
Chapter 4: Methodology and Management
4.1 Overview
This chapter reviews various project management practices that were used during the earth observation life development process. Various project methodologies such as waterfall, agile and incremental were reviewed and evaluated on which was best choice for the project. During development, the project was divided into small manageable parts and organized into work breakdown structure for easy development.
4.2 Project Methodology
This chapter depicts the development methodology used in the development of the project, and its planning and management. There are many steps in the software development which include the requirement, analysis, design, and development. Deployment and maintenance phase. However, most of the time will be spent on analysis, design and development phases. However, the other phases such as requirement phase where requirement collection and elicitation are done are crucial as they form the basis of the next phases. Failure to do a thorough work in requirement phase leads to various revisions of the phase when the project has already started. Revisions of the previous phases are restricted by some software development life cycles. These models include the traditional linear models such as waterfall methodologies. However, other methodologies such as agile, incremental and prototyping process models allow iterations. Software lifecycle iteration help improves the final product and thus the client is well satisfied [26]. So as to fulfill the customer requirements, they should follow all phases in the development. Customer collaboration is allowed in agile methodologies.
Waterfall methodology also known as the traditional model is a linear sequential software development methodology that decomposes the project into various phases designed to perform a particular activity. Each phase of waterfall model must be completed before the successor phase is started. The model is usually used when the requirement is not going to change or there are not requirements uncertain. Each phase is reviewed independently so as to determine if the project is on the right track[27]. Also, the phase must be reviewed as once the next phase is started the previous phases are closed and can be revised. The model is typically applied when it is known at the outset that it is possible to carry out the complete survey of
the requirements of a project. This means that most of the system requirements, and the inputs and outputs that it has with external systems are well known (if any) [26]. The flow of the development of the project is as shown in the below waterfall model[28].
Figure 21: waterfall model of the software development model (SDLC)
Incremental software development life cycle involves incremental requirement analysis, designing and implementation and well as testing. These phases are added incrementally till the project is closed. When all the system increments as specified in the model have been attained, then the project is marked complete. The incremental model divides the entire project into small manageable project increment which is developed incrementally and given in form of releases [29]. The increment is released to the marked for partial use and they wait for the main project which is finalized after several other increments. This way the product is allowed to enter the market earlier than when using traditional model. The model phases of specification, development and validation phase are interlinked as shown in the figure below:
Figure 22: Incremental Model of the software development model (SDLC) showing various increments up to nth increment
Another widely used model known as agile model encompasses various process such as Scrum, Extreme programming, rapid application development, enterprise agile and agile unified process. The agile model involves a set of practice such as iterative practices, adaptive planning, teamwork, customer collaboration as well as early delivery. As a result, the process model gives a perfect product which has severally been reviewed by the client who is part of the development team and given feedback for improvement. Agile approach releases a small increment after every iteration which is given to the client for review[31]. The agile approach is non-linear as it forms a cyclic process that keeps repeating itself as a result of iterations as shown in the figure below [32].Several cycles results to various releases and improvement of the previous release functionality leading to perfection. The previous releases are well tested with client-centered approach and feedback used to improve the quality of the product. Agile practices exhibit highly related dependencies which need a strong and technical development team. The skills will be used to ensure good business requirement analysis. The design and development phases of the model require highly skilled and experienced teams of designers and developers. However, such requirements of the development increase the cost. Also, the ability to support adaptive planning which helps redo the requirement, analysis, design and development phases increase the cost of the project. However, iterations help improve the quality of the product. According to Gupta, regular changes affect the project structure and thus degrade the structure leading to project scope creep[33].
From the above methodologies, it is clear that agile approaches will be best suited for product development. The models use agile practices such as adaptive planning, iterations, and customer collaboration. The project has gone several iterations which have been revised to get an improved and quality product. The customer collaboration, in this case, my supervisor always took a customer look at the product from a customer perspective. The first product of the weather forecast applied layers on top of the base map using the Tatuk map. The Tatuk editor was used to merge base map with web map service (WMS) layers. The product graphical user interface allowed the user to click and view data. When a certain point illustrated by coordinates a checkbox was opened and layers were listed. This product was tested for the functionality and forwarded to my supervisor for further quality assurance testing.
The first application allowed the details to pop up with specific numeric information of the specific point clicked by the user. This representation was done in the windows form. However, my supervisor noted some user problems on navigating the background window when the pop-up window is on. As a result of the feedback, a second cycle was started to perfect the product. In second release annotation representation was used to solve this problem which allows the user to move the background map when the annotation is on. However, just like a stubborn client, this was not all. The supervisor asked for a more improved application that could allow the viewers to see the weather for the last 15 days. These days were to be represented in a graph. These features called for a third-round iteration which in the provided a perfect product which was absorbed by the company as result.
The product was developed through a series of activities which involved Requirements collection and analysis:
In this starting phase, the potential requirement of the application is methodically analyzed, and note down the analyzed specification document, in the later stage this document serves as the basis for all future development work. In brief, the requirements document defines what the application should do, but not how it should do it.
System Design:
In this second phase largely covers the technical design requirements, for example, programming language, data layers, services, etc. The specification of the design will typically create outlines how exactly the business logic covered in the requirement will be technically implemented. The main goal of this phase is to "get across to a screen" the various ideas of how the project will work. In this way, it is possible to avoid possible problems and ensure that what was designed is in accordance with the intended. At this stage, a design of the system/application architecture and the interactions that it has with external sources is also conceived;
The system testers included my supervisor who assisted me in make necessary recommendations. The supervisor assisted to systematically discover and report the issues within the application that need to be corrected. This phase is the crucial phase because it requires repeating the previous coding phase in order to fix the bugs.
Maintenance:
This is the final stage where the project is already in production, and it will receive the necessary maintenance, mainly correcting the errors that have not been identified in the previous phases, and required to keep it functional up to date.
There are minor differences in the numbers and descriptions of the steps used in agile approach, depending on the developer. Regardless, the concepts are all the same and encompass the broad scope of what it takes to start with an idea and develop a full-scale, live application. In the above model, it’s possible to go back to the previous phases at any stage, for example, in case it is found that a requirement needs to be updated/modified or in the event that a function is not implemented as intended. Even though this project is doing not have concrete clients, so this role was done by the company’s advisor. Here he is the person that the requirements were defined and approved, as well as, the verification of the implementation of the same, that is if they were in accordance with the intended. In practice, at each stage, the objectives achieved were regularly evaluated with the company's supervisor in order to receive feedback and, if necessary moved back to an earlier stage.
4.3 Project Management
The project is large with limited resources. To ensure quality end product has achieved the project was divided into several activities with subtasks for easy development.
The internship began on September 12, 2016, and ended on June 12, 2017. During the first two months of the internship, Study of the state of the art regarding GIS engines in WPF, taking into account the identified requirements namely, WMS feeds integration. This phase served to acquire knowledge about the various GIS technologies that exist, how they could be integrated into the project and the various concepts inherent to this type of technology, such as the concept of feature and layer, or the concept of Map tile.
The second phase started on November 7, 2016. This phase consisted of downloading Copernicus data i.e. weather forecast data. During this phase firstly downloading the forecast data into the local drive of the system for testing purpose, the downloaded data was inserted into the MySQL database, it inserted the data successfully. Then the company supervisor advises me to download the forecast data directly into the company Oracle database. At end of this phase, we reached one of the major milestones in the project i.e. downloading the weather forecast data into the Oracle database every midnight.
The third phase started in the mid of the December i.e. on 16, 2016. This phase was to write the design document describing the work to develop. This phase helps to collect more information about WMS layer applications similar to our project i.e. Earth Observation. This phase ended after the improvements that were suggested from the supervisor of XSealence in Lisbon were applied.
The fourth phase of the internship began on January 5, 2017, with the implementation of the requirements set for the Earth Observation, and continued until the delivery of this document. This phase began with the development of the proposed solution, the main goal was to apply the WMS forecast layers on the top of the Tatuk base map. The next task is to get the weather information of the user clicked point. During the development phase, there were several discussions and meetings with the company advisor in order to improve the user interaction component.
These project activities were used to develop project work breakdown structure to ensure each activity is planned for given enough time.
Figure 24: work breakdown structure activities was used to develop Gantt chart
The work breakdown structure activities were used to develop Gantt chart to show duration for each activity plotted using horizontal bars.
Figure 25: The project Gantt chart
4.4 Conclusion for Project Methodology and Management
The project was developed using agile methodologies which allowed the project to be divided into small modules which allowed parallel programming. Earth observation system was a huge system and the company divided it into various parts and allowed to various team members. The project took about 9 months. The WBS activities were used to help guide through a systematic development of the system. Next Chapter describes about the Copernicus Marine Environment Monitoring Services.
Chapter 5: Copernicus (Marine Environment
Monitoring Services)
5.1 Overview
This chapter going to discuss the Copernicus (European Commission). The first section of the section will discuss the Copernicus programs and then components of the Copernicus Marine Environment.
5.2 Copernicus Marine Environment
For our project, data will be downloaded from the Copernicus Marine Environment Monitoring Services. For the Earth Observation, there are mainly it has two major space programmers they are GALILEO (satellite navigation system) and COPERNICUS [34]. The COPERNICUS started as Global Monitoring for Environment and Security (GMES), which was established as European program for earth observation and monitoring. The second space program of the Earth Observation i.e. Copernicus. The Copernicus space program covers the three components they are mentioned below:
• SPACE; • INSITU; • SERVICES.
5.2.1 The Copernicus Space Component
The Copernicus space component consists ESA’s (European Space Agency) “Sentinels”. The sentinels are primarily being developed for particular needs of the programs running be Copernicus. The programs are used in contributing missions that are established by national, international for European nations to offer a pool of data for Copernicus services. The agency is in charge for Copernicus space components that collect the data. European Organization for the Exploitation of Meteorological Satellites (EUMETSAT) offers Copernicus unparalleled operational remit experience for tried and tested capacity for meteorological satellite data, services and products[34].
5.2.2 The Copernicus InSitu component:
The Copernicus monitoring service which depends on data that is extracted from Insitu monitoring networks components such as ocean buoys, air quality monitoring network, maps, and ground-based weather stations. The monitoring network components offer powerful; integrated data and information for measuring and validating satellite data. For instance, moorings and surface measure a wide range of ocean sea surface options such as water salinity, water velocity, temperature, ice velocity, sea currents over a given period of time. The measured data is used by various bodies to make important decisions in their various day to day work life. InSitu networks are managed by European state members and international bodies who make the weather data available for forecasting services as agreed in their policies. Another agency named, European Environment Agency (EEA) is said to be main leading Copernicus FP7 GISC project Work for cataloging the requirements of the InSitu networks. The EEA agency offers Copernicus survives, pilot agreements as well as frameworks for accessing all relevant data in a sustainable and timely manner[34].
5.2.3 The Copernicus Service component
The third component of the Copernicus provides various services to help provide security, land monitoring, climate change, emergency management and atmosphere monitoring. The monitoring services are done the Space Component Sentinel which offers a set of Land Sea and atmospheric observations. Sentinel 1 was launched to offer high-resolution, all-weather, 24/7 and unique set of observation for both ocean land services[34]. Similarly, Sentinel 2 offers a high-resolution optical imagery for soil, water, and vegetation imagery. It also offers coastal areas and inland waterways imagery as well as emergency services. Sentinel 3 offers marine and land highly accurate radar and optical altimetry data such as sea surface topography, sea and land surface temperature. As a result of high accuracy, the data have high reliability. According to Copernicus Sentinel 4 will the third generation Meteosat to be managed by EUMETSAT for atmospheric monitoring of components [35]. Sentinel 5, which will be second generation Meteosat will be also be managed by EUMTSAT
5.3 Technologies used
Several different technologies and tools were used to develop the Earth Observation. The development platform used was.NET (version 4.5.1) because it was the most commonly used development environment in XSealence. In this way, it was possible to integrate with the existing project, the visual studio that allows receiving the information about the weather forecast from the database.
The IDE (Integrated Development Environment) that was used for application development was Visual Studio 2016[37], which owns Microsoft and which at the beginning of the implementation was the latest version of Visual Studio. Tatuk 4.6.0.9975 editor was used for merging base map the with the weather forecast layer from the server.
The project backend which will be downloading the weather forecast data was developed using Python script, the Python version 2.7[38] is used for downloading the data from the Copernicus server, and also used motu-client-python-1.0.8-delivery for deploying. Motu is a highly efficient and robust Web Server which fills the gap between heterogeneous Data Providers to End Users. Motu handles, extracts and transforms oceanographic huge volumes of data without performance collapse[39].