1
Automated Data analysis report and
User segmentation clustering
4
NOVA Information Management School
Instituto Superior de Estatística e Gestão de Informação
Universidade Nova de LisboaAUTOMATED DATA ANALAYSIS REPORT AND USER
SEGMENTATION CLUSTERING
by
Puneet Kumar Sharma
Internship report presented as partial requirement for obtaining the
master’s degree in Advanced Analytics
Supervisor: Leonardo Vanneschi
External Supervisor: Francesco Conzinere
5
DEDICATION
Dedicated to my parents for their unwavered love and support
throughout my life.
6
Acknowledgement
I would like to express my gratitude to my supervisor, Leonardo Vanneschi, of Nova Information Management School of Universidade Nova de Lisboa for all helpful advices and guidance. I also want to thank the Booklyng who gave me the chance to work on a real problem and provided me with all necessary resources that were needed to conduct the report. Without their passionate support I would not have been able to conduct the report.
7 Abstract
In the time of Online Travel agencies like Booking.com, TripAdvisor dominating hotel market in terms of user experience and ease of experience. It is becoming tough for the independent hotels to survive their own identity and user experience value they used to create. Which in turn also affecting virtue of the hotels used to enjoy loyalty from their users.
Booklyng is a web solution which creates a journey for the user experience for any visitor by creating personalize offers, push notifications, exit intent technology and other smart notification technologies. Booklyng understands the importance of user transaction data and want to utilize the full potential of data by using data analysis on data and machine learning.
I had worked in booklyng as a data science intern for 6 months. In this report I intend to present the data analysis done for different hotels based on their past data to present their clients to sustain them for future purpose. They also wanted to generate user profiles to segment them based on their likeability and differentiability. To achieve this, I created an autonomous report generation system for different hotels using python and user profile based on their transaction data, their geographic data and travel expenses based on GDP. Which would help hotels to make better business decisions and provide personalize offers to their users.
Keywords
Data analysis, Python, Kmeans, java script, clustering, segmentation
8
Table of Contents
1. Introduction………..12 1.1 Contextualization ... 12 1.2 Goals... 12 1.3 Project approach: ... 131.4 About the organization: ... 13
2. Automated data analysis:………14
2.1 Data Source ... 14 2.2 Data preparation: ... 14 2.3 Data Understanding: ... 14 2.4 Data Cleaning: ... 19 2.5 Data Transformation: ... 19 2.5 Data Visualization: ... 21
3. User Profile clustering:………..28
3.1 Data Source: ... 29
3.2 User profile creation: ... 29
3.3 Data Preparation and transformation: ... 30
3.5 High dimensionality and Principal component analysis ... 32
4. Clustering:………..32
4.1 K Means clustering: ... 34
4.2 Advantages and Disadvantages of K-Means: ... 35
4.3 K-means Initialization: ... 36 4.4 Number of clusters: ... 36 4.4.1 Elbow method: ... 36 4.4.2 Silhouette Analysis: ... 37 4.5 K-means parameters: ... 39 4.5.1 Distance function: ... 39 4.5.1.2 Manhattan distance: ... 40 4.5.2 Initialization Method: ... 40
4.5.2.2 Furthest point centroid: ... 41
4.5.3 Convergence criteria: ... 41
4.5.4 Variable correlation: ... 41
4.6 K-means computational analysis: ... 42
5. User cluster segmentation:………43
9
7. Future works: ... 49 8. Bibliography ... 50
10
List of Figures
Figure 1 IPSpam List ... 20
Figure 2 year month and hour ... 20
Figure 3 Hotel name and hotel ID ... 20
Figure 4 Spain reservation summary for Iberostar for coupons ... 22
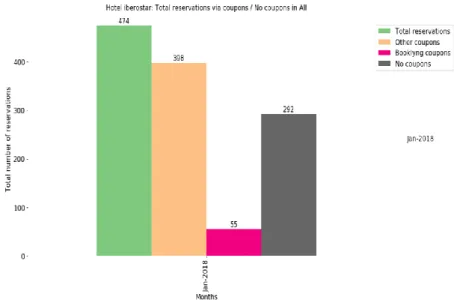
Figure 5 : Iberostar total reservation summary with or without coupons ... 23
Figure 6 : Total reservation summary for different Iberostar hotel chains ... 23
Figure 7 Reservation summary for Iberostar different iberostar hotel chains in Spain ... 24
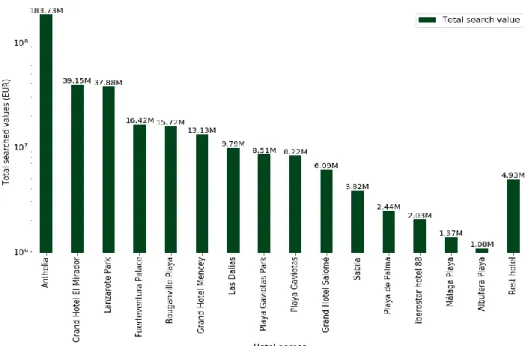
Figure 8: Total search value for different hotel chains for Ibersostar ... 24
Figure 9 Total revenue generated by Iberostar different hotel chains overall ... 25
Figure 10 Revenue generated by different Iberostar hotel chains in Europe ... 26
Figure 11 Total number of nights reserved in Spain for Iberostar ... 26
Figure 12 Total number of night searched in Spain ... 27
Figure 13 Total different number of nights reserved in Europe ... 27
Figure 14 Line chart for conversion rate (%) engagement rate (%) ... 28
Figure 15: Outlier detection for variable money spent ... 31
Figure 16 Average guest values before vs after scaling ... 31
Figure 17 Elbow curve method for optimal number of clusters ... 37
Figure 18 Silhouette plot for number of cluster 2 and 3 ... 38
Figure 19 Silhouette plot for number of cluster 4 and 5 ... 38
Figure 20 Silhouette plot for number of cluster 6 ... 39
Figure 21 Heatmap for correlation matrix ... 42
Figure 22 Pie chart illustrating the user distribution in clusters ... 44
Figure 23 Total money spent vs Average money spent by users ... 45
Figure 24 Average price searched and average length of stay by users ... 46
Figure 25 Average seconds spend between clicks and average no of clicks by user on hotel website ... 46
Figure 26 Conversion rate (%) and Engagement rate (%) ... 47
Figure 27 Promo conversion rate (%) ... 47
11
List of Tables
Table 1 Variables action ... 15
Table 2 Campaign variables ... 15
Table 3 Reservation variables ... 16
Table 4 Reservation variables ... 16
Table 5 Data variables ... 17
Table 6 Visit variables captured by hotels ... 17
Table 7 User information variables captured by hotels ... 19
Table 8 Silhouette score ... 37
12
1. Introduction
The aim of this master thesis internship is to work with Booklyng and develop an automated report solution to analyses the various hotel’s data. They also intend to create user profiles based on the data gathered with an intent to utilize user profile and try to segment them to get some useful insights. Consequently, the objective is to present and review conceptual and practical approaches. Therefore, during this project the chosen data analysis and segmentation solution will be implemented, which will be followed by the delivery of automated report for data analysis, allowing the Booklyng to have a clearer understanding about the data is produced at their client’s side.
1.1 Contextualization
Nowadays, organizations are creating and capturing more data than ever before. It is by itself a whole new challenge for companies, which struggle to manage increasingly great amounts of data growing at a rapid rate. To deal with this new paradigm, Enterprises turn to data analysis and machine learning theories and technologies to extract the maximum amount of information from this data to make data driven business decisions. In fact, Data Analysis are now quite advanced in some organizations. Therefore, the present project aims at suggesting a data analysis method of developing an Autonomous report system for data analysis that could be used extract information for understanding of users and make better decisions within the organization. Also, the analyzed data can be used to present as report to the hotels about their performance on monthly basis with Booklyng collaboration. Once data analysis is done, second objective is to create user clustering, segmentation and use business insight along with segments and use the information for the business.
1.2 Goals
The project goal is to provide Autonomous data analysis report of various hotels data by using generated data using data analysis approaches and machine learning.
Furthermore, the aim of this project discloses in the following objectives
1. Analyze the data collected from data management system. Create variables which are helpful to extract insights from the data.
2. Build an autonomous report system, which helps to generated data analysis report based on the variety of data variables.
3. Create user profiles containing new variables generated from existing data and try to implement segmentation methods (K-Means) to understand the customers better.
13
1.3 Project approach:
Data analysis is a technique to transform data, understand the business and to guide decisions for smart business operations. With that in mind, this project will use data analysis approach to understand the data, then use different data visualization techniques to generate graphical data using data visualization techniques. I will be using python programming language and pandas as library for this. After this, user profiles will be created based on existing data and segmentation methods would be implemented. Therefore, we will present several data analysis, data visualization methods and techniques, find the most suitable for the company, apply it to the data it currently manages and deliver a report based on this. Once the report is delivered, I will also work to create clustering user profiles and get some insights from these. I will be using python and pandas, sklearn library for this.Final result would be segmentation of user profiles.
1.4 About the organization:
Booklyng is a Barcelona based company founded in 2015 by Francesco Canzoniere. Francesco has been consultant for top travel companies, former CEO of viajar.com and head of online marketing for NH hotels in past 10 years. He strongly believed the need of solution which can help to contribute to direct booking of hotels more to destroy the monopoly of OTAs(Online Travel Agencies) such as Booking.com, expedia.com. Booklyng has been part of Wayra (Telefonica open_future). Wayra offers seed funding, coaching & mentoring, beautiful work-space, access to our global network of Wayra Academies, fast-track to future funding, and the potential to unlock the power of 300+ million Telefónica customers globally.
Despite the existence of online discount travel aggregator platforms like Travelocity, Priceline, Booking.com, and Expedia, unnecessary costs continue to be passed onto travelers by way of bloated profit margins and various hidden fees. This is caused by the fact that over the years these major companies have managed to build monopolies over online travel booking. The result is that small hotels and airline companies tend to lose out over larger companies and the end customer pays extra for less choice. Another way of describing these monopolies is that say that the online travel industry is centralized, which has led to higher prices.
Booklyng, as a web solution help to increase the conversion rate for direct bookings for hotels by using user transactional data collected by hotels. It's an easy 5 minutes JavaScript installation to website and its booking engine. Booklyng integrates on top of hotel website without any intervention of hotel or any booking engine department. Booklyng tracks 100+ behavioral and profile variables. Booklyng's intelligence engine can detect and understand any event and touchpoint of the customer experience to know when and how to interact in a personalized way with each visitor. Booklyng asses the visitor data using 100+
14 variables and segment any potential customer in real time according to their profile, understand what they are looking for and assess their potential business. Booklyng provide 20+ smart solutions to persuade user by analyzing their personal journey.
Booklyng uses some powerful smart solutions such as A/B testing, push notification, Email retargeting and so on.
2. Automated data analysis:
Main objective of this task is to achieve data analysis and report generation of hotel data using data analysis techniques to understand the hotel business and understand the Booklyng’s contribution to hotel business. By end of this section, we will be able to generate automated data analysis for hotels. This will also help us to share insights of Booklyng’s contribution to their business.
2.1 Data Source
Data is collected in JSON format and kept on the server. I use JSON file to access the data.
2.2 Data preparation:
Booklyng generates loads of data every day for all the hotels. Iberostar is one of the biggest client for them. Iberostar 6-month user transaction data has been collected for the data analysis purpose. Data consist 676943 records and 103 different variables. Variable are captured based on the different aspect of user behavior on the website of any hotel. Variables are divided based on if any user comes to website and makes a search for hotel availability, for how many days he is looking for room, how many people is he looking to book room, monetary variables, Geographic variables about hotel details and user. Personal details about user and reservation details if user have already made a reservation.
This data needs lots of work to clean this data and generate something which can be in a state where it can be used and utilized fully.
There have been many steps used to prepare data to keep in usable state.
2.3 Data Understanding:
In the phase of data understanding, I mainly have gone through all the variables and try to understand their values to get the groove of data. These variables are well defined to understand the intention of a user to visit on a hotel website. Sample variables of data and Their working to understand the datasets.
15
Table 1 Variables action
Variable Name Type Values
Action Defines the action performed on website by user
Search, popup, signup, missed, yes-please, close, converted
Whenever any user visit to the hotel website, variable ‘Action, defines the action performed during the visit by user. Data is collected for every forward succession action performed on website.
● When user makes a visit to website, action is marked as ‘search’. If popup is presented to user by booklyng then action is popup. Pop up can be any offer such as 10% off on booking or free breakfast to user on booking ● If user signs up for the popup then user wants to sign up for the offer
provided by booklyng and offers would be sent to user via email. Yes-please is part of same process where user clicks the yes-Yes-please for the offer.
● If user don't want to user offers provided by booklyng, then he closes the popup and action is captured as closed.
● If user makes the booking using the booklyng offer or coupon provided by the booklyng then action is marked as converted. Which will be counted as conversion made by booklyng.
● If action is missed, then user was interested in booklyng offers but he didn't use the offer apparently in the end.
Variable action fairly defines the user interest in booklyng offer provided and help booklyng to track their contribution in hotel booking in turn their conversion rates.
Table 2 Campaign variables
Variable Name Type Values
Campaign, campaignId
It defines the type of campaign used by user and id of campaign
‘No-campaign’,
Multi-offer for Adults NOV DIC 2017,
Relax Late Checkout NOV DEC 2017 BOOKWINTER4,
'KIDS FunPack NOV DEC 2017 BOOKWINTER1',
'BOOKWINTER1 - Info Kids FunPack'
Booklyng create different campaign for the hotel user based on their different users, seasons. When the value of variable campaign is ‘No-campaign’ then user is not using any campaign provided by booklyng to make the reservation. Otherwise user is using any of the different campaigns booklyng running for the hotel. This
16 variable capture value of all the campaigns run by booklyng and help to understand which campaign is doing better comparatively for them.
Table 3 Reservation variables
Variable Name Type Values
Data.adults / Data.babies / Data.children /
Data.guests
Show the number of adults / babies / children / Guests select while booking is made by user
Any number of adults / babies / children
E.g 1,2,3...
Data.checkin / Data.checkout
It's a date variable which shows the date of checkin and date if checkout provided by user while booking is made
Dates are provided for checkin and checkout.
Data.coupon Its a variable which contains all the variables used by user while booking is made
Name of all the coupons provided by hotels.
E.g AUTOMATISMO, BOOKWINTER1
All the variables starting by data are the variable used while booking is made by any users. Variable data.coupon captures all the coupon used by user while booking is made. There are coupons which are provided by the Booklyng and there is other coupon as well used by users provided by hotel but not by the booklyng. This variable helps to understand booklyng contribution in terms of user engagement via coupons provided by booklyng.
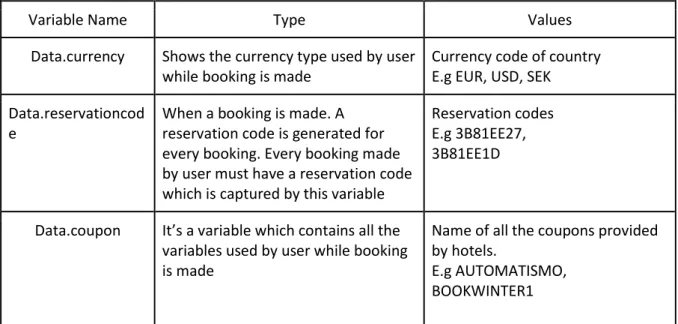
Table 4 Reservation variables
Variable Name Type Values
Data.currency Shows the currency type used by user while booking is made
Currency code of country E.g EUR, USD, SEK Data.reservationcod
e
When a booking is made. A reservation code is generated for every booking. Every booking made by user must have a reservation code which is captured by this variable
Reservation codes E.g 3B81EE27, 3B81EE1D
Data.coupon It’s a variable which contains all the variables used by user while booking is made
Name of all the coupons provided by hotels.
E.g AUTOMATISMO, BOOKWINTER1
17 Data.nights /
Data.rooms
It’s a variable which contains total number of nights / rooms user wants to book while booking is made
Number of nights E.g 1,2,3..
Data.totalprice / Data.totalpricebkp/
Data.totalpriceFlot
It’s a variable which contains the total price for the booking made by user.
Total price of booking E.g 100 Eur, 200 Eur
Data.roomtype It’s a variable describes different room type provided by hotel for bookings
Room type of hotel rooms E.g ‘Doble Vista Jardín’, ‘Doble’,’Familier’
Every booking made by user have a reservation code. This helps to track total reservations made and data.currency captures the currency type of booking while payment is made. There are 3 variables used for price. One is just backup of variable data.totalprice and other one is float value of same variable. These 3 variables are compared, and final value used based on at least 2 of them have same value for price. This is used so precise value for reservation price is captured. Data.coupon variable is used to distinguish between the coupon used by user are the Booklyng coupons or not.
There are also some variables which captures the details about the hotel name, mail and ID of hotels. As iberostar hotels is a multi-chain hotel with lots of branches, so hotel id defines the branch of hotel.
Table 5 Data variables
Data.hotelname / data.hotelID / Data.hotelEmail
These variable captures the name / ID and email ID of hotel for the booking
Name / ID hotel / Email of hotel
E.g Iberostar canary island / 21 / [email protected]
There are variables which start with search instead of data are all the variable captures the values of all the search made by user during his visit to hotel website. All the variables for reservation starting with data. Search doesn’t have reservation code variable as that’s for confirmed booking but instead it has searchID variable, which is an ID for every search made by user.
There are also variables which captures all the visit made by user to hotel website by hotels perspective according to every visit.
Table 6 Visit variables captured by hotels
visit.cookies.BooklyngActive It's a variable show if Booklyng is currently active on the hotel
Boolean variable E.g True, False
18 website. (If hotel is using
booklyng technology) visit.country This variable provides the
country user visiting
Name of country E.g Spain, Portugal visit.device.browser.family This variable provides the
browser used by user during visit
Name of browser
E.g 'Mobile Safari', 'Samsung Browser', 'Chrome', 'Safari', visit.device.model This variable which device is
being used during the visit
Name of devide
E.g Iphone 6, Samsung x, Lumia 520
visit.device.type This variable provides type of device used during visit to hotel website
Type of device
E.g Tablet, Phone,smart tv
Visit.geodata.continent / visit.geodata.country
These variable captures the country and continent of visit
Name of country / continent E.g Spain / Europe
visit.hotelId This variable captures ID of hotel for the visit
Hotel ID E.g 21
visit.ip This variable tracks the IP
address of the user during visit
IP address
E.g 172.20.135.201
visit.lang This variable captures the
language used during visit
Language used in browser E.g Spanish, Dutch
visit.pageType This variable capture if user has been converted by booklyng or not
Offer and converted values
visit.searchId This variable captures the search id for visit
Search id E.g 12dg33
visit.step This variable captures the step
where user landed during visit
Name of step on the web page of hotel
E.g credit card, generic, search, convert
These variables capture all the data that can be used for analysis during any visit to hotel website. Variable visit.step segregate the user visit based on which page he lands during the visit such as credit card details page. If user is just on the website and don't make any search then its counted as generic search, if makes any search that is converted into reservation then user made the booking.
19
Table 7 User information variables captured by hotels
user.hotelVisitorId This variable captures ID of hotel user visit
Id of hotel E.g 21 user.newVisitor This variable capture if user is
new of old user
Its boolean values True or False user.visitorId This variable generates an ID
for every user visits hotel website
ID of user. Its unique value
There are two other variables like Time and trigger.
Time variable captures the time when user visited the website of hotel. Trigger variable keeps track of user if user is being abandoned from the site or closes the booklyng page.
2.4 Data Cleaning:
Data collected at organization is always messy and dirty. Data cleaning is a prerequisite which is needed to get meaningful insights out of the data. I have followed few steps to clean the messy data and make it clean.
1. Removed all the records with messy values of currency. Also replaced currency symbols to currency name.
2. Compare all the three price columns and calculate mode and use the value of mode for missing price value in price column.
2.5 Data Transformation:
Data understanding phase gives initial glimpse about the data and brief definition about the variables, but they cannot be used directly for the analysis purpose of data. Some transformation is needed to use them for data analysis.
1. Date and Time variable: We have three variables which are related to Date and Time format in the dataset. As data will be analyzed according to European and Paris time zone so I am converting the time zone to ‘EU / Paris’ time zone. Variables time, data.checkin, search.checkin have been converted to ‘EU / Paris’ has been converted.
2. Data is always full of junk until it is not being treated properly. In hotel website data, there is lots of spammer who just try to make fake searches to affect the traffic. They are called bots. I have removed all the records of having more than 30 searches in a day from same IP address without making any reservation.
20
Figure 1 IPSpam List
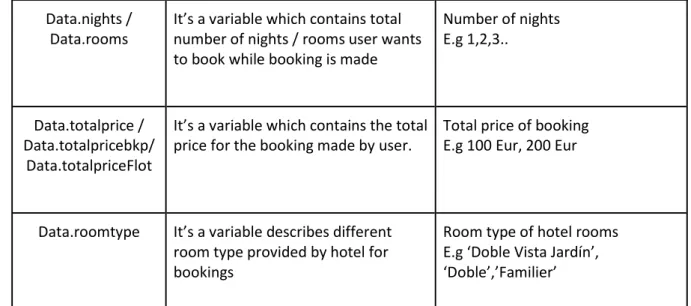
3. As we want to segment our data in weekly, monthly, yearly and daily basis. We create time variables for daily, weekly, monthly and yearly basis.
Figure 2 year month and hour
4. While Analyzing the data, I realized there are lots for record where hotel name or hotel ID is not captured. Any record which has any of the hotel name or ID, hotel name or ID is filled based on the other information.
5. Hotels with no information about their hotel ID or hotel name are marked as unregistered hotel.
21 6. We have 103 variables available in the data but all the them can’t be used directly, so, I created few new variables based on the available data information.
● Computed nights: based on total nights is calculated for reservations made by any user
Computed nights = (Date user checked out - date user checked in)
● Total room nights: Total room night is a key performance indicator for any hotel.so I created total room nights based on for every reservation made by user
Total roomnight = (total rooms booked by user * total nights reservation made by user)
● Conversion per month: Conversion per month is a performance indicator which help Booklyng to track their conversion rate for user.
Conversion rate = (Number of people who make reservation via booklyng / Total number of people who saw the booklyng coupon)
● Engagement rate per month: Engagement rate helps booklyng to understand how well they are engaging with people they are providing offers
Engagement rate = (Number of people signed up for Booklyng offer / Number of people saw the booklyng Pop up)
● Promo conversion rate: Promo conversion rate helps booklyng to track how many people are making reservations after signing up for their pop ups every month.
Promo conversion rate per month = (Number of people made reservation via Booklyng / Number of people signup for the booklyng pop up)
● Hotel lead time: Lead time helps to understand how many days before people tend to make reservations. Better the lead time, better the performance.
Lead time in days for reservation = (Check in date for user reservation - Date user made the reservation)
Lead time in days for searches= (Check in date for user search- Date user made the searches)
2.5 Data Visualization:
Intent of data analysis project is to deep dive into the data and try to segregate data to understand business and their customer better. All the visualized form of data would be used to present to clients as well as to use by booklyng to understand their business involvement with their clients. Approach is to automate the process with to reduce the manual work and present the data in simple form for better understanding of data.
22
As Iberostar is a big hotel chain and generate loads of customer data. Our plan is to visualize the data in comparison of Booklyng vs Non-Booklyng performance. So, our analysis would be around these segments data is divided.
1. Booklyng coupons Vs Non-Booklyng (without Booklyng coupons) performance
2. Iberostar performance in every month for all hotel branches in Spain, in other countries and different continent as well.
Analysis for Iberostar reservation summary:
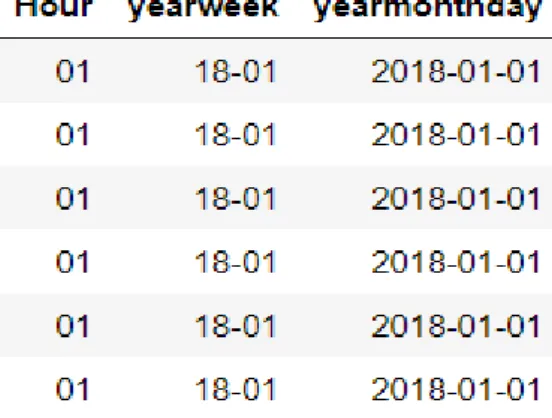
● Spain reservation summary for month January 2018 Via different coupons used.
Figure 4 Spain reservation summary for Iberostar for coupons
This chart displayed the total reservations made in hotel Iberostar in month January by using different coupons available. Here 39 reservations are made by booklyng coupons.
● Total reservations made for month January 2018 via different coupons used.
Figure 4 and 5 illustrate the total reservation in Spain for Iberostar and total reservation for Iberostar hotel overall. Here we can clearly see how reservation are divided in customers who uses the coupons, coupons provided by Booklyng and shows the users who don’t like to use coupons while making a booking.
23 ● Total reservations made for Month of January 2018 for different hotels
Figure 6 : Total reservation summary for different Iberostar hotel chains
• Total reservations made in month January by different hotels in Spain.
24
Figure 7 Reservation summary for Iberostar different iberostar hotel chains in Spain
Figure 6 and 7 shows reservation summary for different hotel chains in overall for Iberostar and hotel chains in Spain. These plots give an insight how monthly reservation stat are also help Booklyng to understand about their contribution.
Figure 8: Total search value for different hotel chains for Ibersostar
Analysis for Iberostar revenue:
Booklyng calculates revenue in three different forms. One is total money generated by reservation. Total search price is total money searched by all the customer for while searching for a booking and Booklyng consider
25 money which is difference between total total value - total revenue as missed revenue where they can work to improve.
• Total searched price generated for Iberostar in January 2018 by all different hotels
• Total revenue generated by iberostar in January 2018 by all different hotels.
Figure 9 Total revenue generated by Iberostar different hotel chains overall
Figure 8 and Figure 9 gives an insight about searched prices and revenue for different hotels. Search prices is price when user search for a hotel to book reservations. Revenue is money generated when reservation is made. Idea is to increase the revenue by providing some offers to customer or good deals.
● Iberostar total revenue generated in Europe.
Figure 10 is showing all the revenue generated by different hotels in Europe. All the charts about revenue provide information about total revenue. This helps Booklyng to understand and present insights about performance with hotels. This analysis also helps to Booklyng to understand their role where they can help. Analysis about all the revenue by is done automated functions which takes values as different region, different months and different type of hotels data and provide the data in form of visualized data.
26
Figure 10 Revenue generated by different Iberostar hotel chains in Europe
Figure 11 Total number of nights reserved in Spain for Iberostar
Analysis of number of reservation nights:
Reservation nights have been calculated in different numbers to understand how user make booking. Here in Figure 10, we can see max reservations are 1 reservation night. Which is usually for official trips. There are also good number of reservations for more than 10 nights. Which is good sign for the hotel.
27 Figure 11 shows the total different number of nights searched in Spain value. Here we can see value for 1 and 2 search nights is huge. Lots of users have been
searching for reservations. Booklyng can help to increase the conversion to hotels.
Figure 12 Total number of night searched in Spain
Figure 13 Total different number of nights reserved in Europe
Figure 13 shows the total number of nights reserved in Europe. Here we can see maximum reservations are 6-9 number of nights. Which is clearly states that most of reservations are of traveler or leisure vacations. More insights can be gathered from other data.
28 Booklyng help to convert more direct bookings for hotel. Booklyng send pop notifications, smart popups, coupons registrations, coupons by email for the users to convert bookings.
Figure 14, Line chart comparing monthly conversion / engagement / promo-conversion rates for Booklyng. The conversion rate, black, is the number of people that make a reservation via Booklyng divided by the number of people who see a Booklyng popup, the engagement rate, yellow, is the number of people that sign-up to a Booklyng offer divided by the number of people that see a popup and the promo-conversion rate, red, is the number of people that make a reservation via Booklyng divided the number that signed-up to an offer.
Figure 14 Line chart for conversion rate (%) engagement rate (%) And Promo conversion rate (%)
All these charts have been generated from automated data analysis. Very few of the analysis have been presented in the report in visual form but any type of analysis is needed can be generated by just passing graph name as parameter. This analysis has been performed to segment data more into location such as continent, country, time such as week, month and day and different hotel branches. This automated analysis is a created using python code and run every week for different hotels to generate analysis and present it with hotels as well use to understand the business.
3. User Profile clustering:
Now that a detailed analysis report system has been created, in this section I will `focus more on the analysis carried out to understand more about the customer behavior using clustering algorithms. The objective of this analysis is not to create best solution from mathematical point of view but create to create a subset of
29 customers which are interesting from business perspective. The gained insights should be used to manage customers in a more profitable way. Simply partitioning the population into groups by applying fixed rules would also be a valid procedure to achieve this goal. But it is decided, that a machine learning technique (k-means clustering) should play a role when defining the segments, too.
3.1 Data Source:
This work is about generate the user profiles from the transaction data collected by Booklyng from various clients. Data is collected as a JSON file. I would be using python and pandas, sklearn as library as a tool to generate customer segmentations.
First milestone of this work is to create a proof of concept to generate customer segmentations.
3.2 User profile creation:
As a user visits the hotel website, data is generated in the form of transaction with user having a specific user id. I have created a profile for every customer while they make a booking or visits the website to make a booking. I will be using JavaScript to generate user profile.
Basic idea about user profile is to capture data their actions on website, how much time to spend while making a booking, avg price they look for, if they are converted via booklyng. I have also considered data about the language of user and demographic data such as country of customer.
Variables Descriptions
avgBookedGuests Average value for number of guest in reservation
avgBookedRooms Average value for number of rooms in
reservation
avgGuests Average value for number of guest in
booking search
avgLengthOfStay Average value for number of days people search for booking
avgPriceOfClickedRooms Average value for price in search for booking by user
30
avgRooms Average value for number of rooms user search for booking
avgSecondsBetweenClicks Average value for number of second user spent between
everyclick on the hotel page during booking process
clicks Total number of clicks user perform during visit to hotel website
conversions Total number of reservations user made via booklyng
language Language user selected in browser while making booking
country Country name user made booking from first_time Date and time when first time user visits the hotel web.
last_time Date and time last time user visits the hotel web.
visitorId Unique ID for every visitor or user profile This is the complete information about variables have been created from the customer transaction data. There is a new variable created from the time variables to check how about the total time user is associated with the same hotels to make bookings. This might help to understand user’s loyalty to specific hotel.
diff = last_time - first_time
3.3 Data Preparation and transformation:
● Missing values: As user profiles are created based on transaction data,
there are no missing values for any variable is experienced in user data.
● Outlier detection: Apart from completeness of data, I have also looked
through the data to understand the presence of outliers. I have used various approaches like boxplot, scatter plot and Z-score. I used box-plot method as this seems efficient to understand the values of data. Few records have been removed from the data.
31
Figure 15: Outlier detection for variable money spent
● Dummy binary variable creation: Variable language and country are
categorical variable. I have converted those variables into dummy variables to use them in algorithm.
Figure 16 Average guest values before vs after scaling
● Data standardization: Data standardization is used to fit the data to
algorithm. Our data contains mixed variables as continuous variables and binary variables (dummy variables for language and country). As data have disproportional variation in all the variables so I have used minMax standardization technique is used to convert data spread between 0 and 1. Which also helps binary variables having values as 0 or 1. standardization is applied after the removal of outliers and dummy variables creations.
32 As data have been prepared and transformed in a shape where it can be used to for further analysis for clustering and segmentation approaches. Now, I will further investigate into clustering to gain better insight of data.
3.5 High dimensionality and Principal component analysis
Problems with high dimensionality result from the fact that a fixed number of data points become increasingly sparse as the dimensionality increases. For clustering purposes, the most relevant aspect of the “curse of dimensionality” concerns the effect of increasing dimensionality on distance or similarity. Most clustering techniques depend critically on the measure of distance or similarity, and require that the objects within clusters are, in general, closer to each other than to objects in other clusters.
One of the solutions to this issue is employing a dimension reduction technique that can reduce the number of dimensions while maintaining sufficient richness in the data. One such technique, principal component analysis, was adopted in the project.
Principal Component Analysis (PCA) is a dimension reduction technique that reads a table of observations described by several inter-correlated quantitative dependent variables, extracts the important information from it, and represents the data in a set of new orthogonal variables called principal components. The principal components capture the similarity of the observations and of the variables as points in maps.
Each principal component explains a proportion of the variance of the original dataset and is dependent on all its preceding components. Therefore, if n components are selected, it must be the first n components. The number of principal components selected is usually less than the number of original variables, as principal components are more data rich than the original variables. Care needs to be taken when choosing the number of principal components to consider, to strike an optimum balance between reducing the number of dimensions and preserving the richness and detail in the data.
4. Clustering:
Clustering has been discussed widely in literature over the past decades, a variety of definitions can be found while researching about clustering. That is why it should be started by giving an overview of definitions. This goes together with a brief description of the fields in which clustering is applied.
Definition and Application: Clustering is not one specific algorithm, but rather a group of algorithms with similar goals. This section should give conclusion about the matter of clustering, provide an overview of different clustering types, and should give a summary of the field in which clustering is applied broadly.
33
● Definition: Clustering varies depending on the researcher and the
respective research field and topic. In general clustering is considered a form of unsupervised machine learning (A. Jain, Murty, & Flynn, 1999). In contrast to supervised machine learning, it does not try to approach a target value. However, it might be helpful to compare the outcome of clustering algorithm to the real clusters, if available.
The following table provides an overview of different definitions.
Author(s) Definition
(Jain, Murty, & Flynn, 1999, p.264) “Clustering is the unsupervised classification of
patterns (observations, data items, or feature vectors) into groups
(clusters)”
(Liu, Li, Xiong, Gao, & Wu, 2010, p.911) “dividing a set of objects into clusters such that
objects within the same cluster are similar while objects in different clusters are distinct”
(Rendón et al., 2008, p.241) “determine the intrinsic grouping in a
set of unlabeled
data, where the objects in each group are indistinguishable under some criterion of similarity”
(A. K. Jain, 2010, p.651) “Cluster analysis is the formal study of methods
and algorithms for grouping, or clustering, objects according to measured or perceived intrinsic characteristics or similarity”
(Likas, Vlassis, & Verbeek, 2003, p.12) “defined as a region in which the density of
objects are locally higher than in other regions”
Table 1 - Definitions of clustering
Clustering pursues the objective of identifying groups of data that are like data of the same group and less like data of other groups. In this work the terms groups, segments, clusters, and classes are used synonymously.
34 ● Field of research: Such properties, as described above, are desirable in a wide range of fields. The following list should provide an overview of some of the most relevant fields in clustering:
1. Customer Segmentation: To provide companies with potentially interesting insights about their customer and help them manage different customer segments in different ways.
2. Human Genetic Clustering: Applies clustering to human genetic data to draw conclusions about population structure (de Hoon, Imoto, Nolan, & Miyano, 2004).
3. Medical Imaging: Uses clustering to make similarly behaving structures insight the body visible and interpretable on a monitor. 4. Image Segmentation: Clustering is used to detect similar regions
in a visual image. This technique is applied in research topics like object recognition, video analysis for self-driving cars, and map creation from satellite images.
Clustering Approaches: Due to its appeal to many research areas, a variety of different techniques have emerged over time. But I will be using Means and K-means++ clustering algorithm initially for user profile segmentation.
4.1 K Means clustering:
K-means clustering is part of partial clustering. In partial clustering, all observations are grouped at same time. The most popular representative of this class is the k-means algorithm. In this section, I will explain the working of K-means, important properties and problems associated with.
K-means algorithm, as defined by MacQueen (1967) is an iterative process that starts with a predefined number of initial cluster centers (seeds), that corresponds to the number of clusters that should be defined. After the initialization of the seeds, observations are assigned to their closest seed (considering all dimensions). Then the mean of the observations that have been assigned to the same group is computed. This mean is called centroid. In each subsequent iteration the centroids of the previous iteration are treated as seeds. This procedure iterates until one of the stopping criteria is met. The stopping criteria are:
● The maximum number of iterations has been reached
● The centroids converge: The difference in the position of all centroids of
the current iteration is similar enough to their respective position in the previous iteration. So, the distance between observations and centroids can be considered minimized
All observations associated to same centroid in final iteration belongs to same cluster.
35
4.2 Advantages and Disadvantages of K-Means:
Due to its wide range of application fields, it is necessary to obtain a more detailed overview of the capabilities of k-means. This section studies the main strength and weaknesses of the k-means algorithm.
(MacQueen, 1967) points out that k-means is a particularly easy algorithm, which makes it preferable over other methods. As we are in initial `phase in cluster analysis, this is an advantage to implementation and advantageous to explaining to non-specialist people.
Its greatest strength is probably its low computational cost in comparison to hierarchical clustering. Steinbach et al. (2000) emphasize the linear relation of time and complexity of data set. This computational efficiency makes it the technique of choice for many problems with large data sets.
Although these properties are desirable, there are several drawbacks of the k-means algorithm. One of them is number of clusters needs to be predefined. It can be hard to predict number of clusters without having much knowledge about number of cluster. Although there are methods to predict number of clusters. Here i will be using k-elbow curve method to predict the number of clusters. However, these methods are only heuristic, they don't provide definitive solutions. In conclusion it is always necessary to run k-means with different k, to find the best suitable model. When doing so there are two major problems. The first is, that it is difficult to compare models with a different number of clusters because naturally models using high number of clusters will lead to less sum of square errors. The second problem is, that even if k-means is initialized with different k, there cannot be certainty that the optimal number of clusters has been found within these iterations.
Another problem with rerunning k-means is, that it minimizes the distance between observations and centroids depending on an initial solution, and so converges towards a local optimum. The relation between the initialization, and the result is deterministic. Once it has found a local optimum (smallest distance between observations and centroids), a termination condition is met.
The inability of separating overlapping clusters correctly is another drawback of many clustering algorithms, including k-means. In the case of overlapping true clusters, k-means will allocate each observation to its closest centroid, and so, create an artificial threshold by which observations are grouped with either of the clusters (Cleuziou, 2008).
Another drawback of K-means is that, it assigns every observation to one class even if it could have been assigned to two clusters of same likelihood. This also means outliers which should not belong to any class would be assigned to closed centroid.
36
4.3 K-means Initialization:
K-means algorithm converges towards a local optimum, and the relation between initialization and result is deterministic. Therefore, the initial centroids (seeds) have a major impact on the solution that will be found. This section will give an overview of different initialization techniques, which can be used to explore the search space in the most effective way possible.
As i am using initialization methods as random selection of centroid, furthest point from centroid, Kmeans++ and ndarray. In random selection method, randomly centroid are generated and then data points are assigned to centroids. In furthest point method, randomly generate a furthest point as centroid. In K-means++ method, elects initial cluster centers for k-mean clustering in a smart way to speed up convergence.
As performance of K-means clustering is majorly depends on the initial centroids have been chosen as K-means algorithm might caught up in local optimum solution before algorithm iterations get exhausted.
4.4 Number of clusters:
in K-means algorithm, number of clusters needs to be predefined. Number of cluster should be large enough to define the characteristics of data set but at the same time should be significantly smaller then number of observations. The choice of the best number of clusters is like the question of whether the result of clustering is good or not.
4.4.1 Elbow method:
Therefore, I will be using the Elbow curve method to choose the number of cluster method.
This method helps to choose number of clusters based on sum of squared errors. Optimal value of number of cluster is chosen when there is a break and sum of squared error graph become steep to x-axis. Here optimal values are being chosen as 5.
37
Figure 17 Elbow curve method for optimal number of clusters
4.4.2 Silhouette Analysis:
As predefined clusters are needed for K-means algorithm. I am also using
silhouette analysis to identify optimal values for number of clusters. Silhouette analysis is used to study the separations among resulting clusters. The silhouette plot displays a measure of how close each point in one cluster is to points in the neighboring clusters and thus provides a way to assess parameters like number of clusters visually. This measure has a range of [-1, 1].
Silhouette coefficients near +1 indicate that the sample is far away from the neighboring clusters. A value of 0 indicates that the sample is on or very close to the decision boundary between two neighboring clusters and negative values indicate that those samples might have been assigned to the wrong cluster. Silhouette score and clusters plot analysis:
Table 8 Silhouette score
Number of clusters Silhouette score
2 0.3757
3 0.4320
4 0.5391
5 0.5913
38
Figure 18 Silhouette plot for number of cluster 2 and 3
Silhouette score shows the closeness of point with in the cluster and distance of data points among the clusters. Here we can see Silhouette score is increasing as number of cluster values is increasing. Silhouette plot shows here that cluster 2 and 6 are bad pick. As clusters are below average silhouette score. Number of cluster 3,4,5 have most of the cluster values above the silhouette score. Which is clearly a good sign. Plot also shows that clusters for number of cluster 4 and 5 are in better shape and sizes are bit identical then 6.
Figure 19 Silhouette plot for number of cluster 4 and 5
When choosing number of clusters as 6, cluster 0 and cluster 5 are very small in size. Clearly, they don’t define the data well. For number of cluster 4 and 5, size of clusters looks similar and quite big, clusters can describe the data well.
After carefully considering K-elbow method and Silhouette analysis we will be choosing optimal values for number of clusters as 5. As according to elbow method sum of squared errors are minimized and variation with in cluster is minimized.
39
Figure 20 Silhouette plot for number of cluster 6
4.5 K-means parameters:
K-means algorithm is very fast in computing. The average complexity is given by O(k n T), were n is the number of samples and T is the number of iteration. The worst-case complexity is given by O(n^(k+2/p)) with n = n_samples, p = n_features.
As in practice, K-means algorithm is very fast but fails at local minima sometimes when iteration gets over. Choosing initial centroids also makes a huge difference in the performance of the algorithm. If algorithm stops before fully converging because of tolerance value of max iterations, mean of points in clusters and labels for clusters will not be consistent. Therefore, we will be using different parameters to implement and capitalize the full capacity of K-means algorithm.
4.5.1 Distance function:
The way means is constructed is not based on distance function, but means minimize the variance with in the clusters. So, the basic idea of K-means is minimizing the sum of squared error. Which is the sum of squared distance between cluster centroid and data points within the same cluster. We will be using two different distance function Euclidean distance and Manhattan distance.
4.5.1.1 Euclidean distance:
Euclidean distance or Euclidean matric a straight line between two points in Euclidean space. Euclidean distance between points p and q is line segment connecting points p and q.
In cartesian coordinates, if p = (p1,p2,p3…pn9 and q=(q1,q2,q3,….qn) are two points in Euclidean space, the distance d from p to q or from q to p is given by Pythagorean formula
40 In K-means algorithm, Euclidean distance from data points to a centroid. However, K-Means is implicitly based on pairwise Euclidean distances b/w data points, because the sum of squared deviations from centroid is equal to the sum of pairwise squared Euclidean distances divided by the number of points.
4.5.1.2 Manhattan distance:
Manhattan distance is absolute values between two points in space. In practice, you should get similar results most of the time. Absolute value distance should give more robust results, whereas Euclidean would be influenced by unusual values.
This is a multivariate technique, and "distance" between two points involves aggregating the distances between each variable. So, if two points are close on most variables, but more discrepant on one of them, Euclidean distance will exaggerate that discrepancy, whereas Manhattan distance will shrug it off, being more influenced by the closeness of the other variables.
The Manhattan distance function computes the distance that would be traveled to get from one data point to the other if a grid-like path is followed. The Manhattan distance between two items is the sum of the differences of their corresponding components.
The formula for this distance between a point X=(X1, X2,X3,..Xn) and a point Y=(Y1, Y2, Y3..Yn) is:
Manhattan distance calculates the absolute distance between centroid and data points within the cluster and distance is minimized, closer the data points are to centroid.
4.5.2 Initialization Method:
As already discussed, K-means algorithm may converge towards minimum optimum solution. It’s very important how initial centroid are chosen. K-means algorithm is also sensitive to outliers so if any outlier values is chosen as initial centroid, possibility is final centroid may not lie within the
41 cluster. So, I will be assessing the performance of algorithm with various initialization method.
4.5.2.1 Random initialization:
in this method, randomly centroids are chosen for every cluster and data points closed to centroid would be assigned to clusters. If selection of centroids has been good using this method, then you may end producing good clusters. But sometimes if all centroids are very closer to each other, results can be not the best fit.
4.5.2.2 Furthest point centroid:
in this method initially, a centroid is chosen randomly. A random data point is generated and compared with centroid if it’s the furthest point. If it’s the furthest point, I will be considered as a centroid. This method helps to keep centroids away from each other keeps clusters distant. Which certainly enhance the quality of clusters.
4.5.2.3 Kmeans++:
This method selects initial cluster centers for k-mean clustering in a smart
way to speed up convergence. The intuition behind this approach is that
spreading out the k initial cluster centers is a good thing: the first cluster center is chosen uniformly at random from the data points that are being clustered, after which each subsequent cluster center is chosen from the remaining data points with probability proportional to its squared distance from the point's closest existing cluster centers.
This seeding method yields considerable improvement in the final error of k-means. Although the initial selection in the algorithm takes extra time, the k-means part itself converges very quickly after this seeding and
thus the algorithm lowers the computation time.
4.5.3 Convergence criteria:
This parameter is used to as an exit parameter for algorithm to stop if convergence criteria is met. Here we will be using 1% as min threshold value. If the % percent change in the centroid of cluster is less than 1%, algorithm would stop executing.
4.5.4 Variable correlation:
correlation is any statistical association, though in common usage it most
often refers to how close two variables are to having a linear
relationship with each other.
we have 18 original variables and 100+ dummy variables about language and user’s country. I have created correlation matrix among variables to understand relation among them. Correlations are useful because they
42
can indicate a predictive relationship that can be exploited in practice. We can use correlation technique to for the variable selection as well.
Figure 21 Heatmap for correlation matrix
Variable avgGuest is positively correlated with variable avgRooms having coefficient as 0.95. similarly, variable conversion has positive correlation with variable spentInEUR with coefficient 0.90. we can use any of the variable in algorithm in correlated variables.
4.6 K-means computational analysis:
K-means algorithm has been implemented with various parameters to generate clusters. I will be assessing the performance of K-means algorithm based on the SSE value. Intention here is to reduce the SSE value as much to reduce the variance with in the clusters. I have run the algorithm with different variables and different seeds.
43
Table 9 Results for Kmeans algorithm
Different runs Euclidean distance Manhattan distance Random selection Furthest distance minChange Threshold Kmeans++ Max iter No of cluster SSE value 1st run 0 1 0 1 1% 0 1000 5 30592 2nd run 0 1 1 0 1% 0 1000 5 30844 3rd run 1 0 0 1 1% 0 1000 5 17612 4th run 1 0 1 0 1% 0 1000 5 14116 5th run 1 0 1 0 1% 1 1000 5 10517
Table describe all the runs for along with all the parameters used in every run. Every paraments used in run has value as 1 all are 0. All the runs have run for 1000 iterations and 5 number of clusters.
Initially, I will be choosing initialization method as furthest and distance measure as Manhattan. minChangeThreshold is 1%. Here we can see value of SSE is 30592. In 2nd run, I Will be choosing initialization method as random selection keeping
rest of the parameters same. SSE value slightly goes up to 30844.
In 3rd run, I am choosing initialization method as furthest and distance matric as
Euclidean. Here results give a clear indication about that Euclidean distance is a better distance metric for our data. As SSE value goes down significantly.
In 4th run, I am choosing initialization method as furthest distance and verified the
result. SSE value decreases slightly.
These results have been tested with multiple seeds as well but there were no significant difference. These are best seed results.
Finally, in 5th run, I chose Kmeans++ algorithm. As Kmeans++ algorithm choose
selects initial centroid smartly, allows algorithm to reach convergence fast. It is also experienced in the result of Kmeans++ algorithm run. Results with the best seed has been captured. SSE value decreases to 10517.
Kmeans++ algorithm would be used to generate final clusters. All the results have been tested on 30% of sample data and best seed is 99.
5. User cluster segmentation:
To gain knowledge about customers from different business perspective and data perspective, we will try to create segment based on money and other related variables. All the variables have been selected based on correlation technique and business insights and understanding of data.
Because of its scalability the k-means algorithm was identified to be the best clustering algorithm for a data set. Before applying the algorithm to the input variables, some preprocessing needs to be performed.
44 At first the segmentation process is carried out on a sample of 30% of the data. Once an acceptable solution is found, the settings are applied to the whole population. These results have been analyzed by business experts to understand business perspective.
All in all, about 1000 iterations are performed, where, among others, also principal component analysis for dimensional reduction is applied. The solutions using principal component analysis are rejected because of their difficult interpretability and will not be part of this work.
After various iterations the algorithm resulted with five clusters. Clusters are named based on their demography and booklyng conversion rates. A description of the clusters can be done using the cluster definitions.
• Best conversion: This cluster consist 17.7 % of total users. Total 32% of money is generated by users in this clusters. 61% users belong to United Kingdom and 99% users speak English. This cluster experience the best conversion rate for booklyng. This cluster is best average money spent by user.
• United states: This cluster consist 27.4 % of total users. This is the biggest cluster and all the users belong to united states and 99.6 % speaks English. This is most spent money cluster but 2nd best average money spent per user.
Figure 22 Pie chart illustrating the user distribution in clusters
• Spanish cluster: This cluster consist 21.4 % of total users. 40 % users belong to Spain and all the user speak Spanish language in this cluster. This cluster has the best engagement rate of 7.4% but still could convert those users to bookings. Total 23 % money is generated by this cluster. • Least conversion: This cluster consist 21.6 % users. But still this cluster
consist of users least convert to bookings. This cluster has least conversion, promo conversion rate. All the users in this cluster belongs to
45 Canada and speaks English. This cluster needs to be looked seriously why users are not converting into bookings. This cluster is generating the least amount of money to the hotel which is 2 % of total sum.
• Mixed European: This cluster is the smallest one consisting 12 % users in this. Total 7 % of money is generated by this cluster. This cluster is belonging to people from France, Portugal and Germany majority and speaks their language. This cluster is 4.6 % of promo conversion rate.
Figure 23 Total money spent vs Average money spent by users
Figure displays how money is spent by users in every cluster. There is a clearly distinction among clusters according to demography, language and spending money.
It is clearly visible that best conversion cluster and United states cluster generate majority of money. offers generated for these users are working well but least conversion cluster needs to be looked. More relevant offers need to be generated for these users.
By analyzing these two figures, it’s clearly visible that users belong to clusters best conversion and Spanish users have high values search price as well high value for length of stay. We can understand
users in these two clusters make booking for long vacations or personal vacations for leisure.
Whereas, in other two cluster united states and least conversion search price and length of stay is less. These users are making reservations for official purposes. In cluster mixed European, user have reservations mixed of both official as well as personal.
46
Figure 24 Average price searched and average length of stay by users
By analyzing these figures, user is spending lot more time in all the clusters during the booking steps. We can see clusters with European users spent more time looking for the information during the booking steps on average. From the business perspective these are the users who look for more information or offers, coupons they could use. American users are comparatively spending less time. Same goes with no of clicks by users while made the booking or not. Spanish cluster users have the highest average clicks. Based on the business decisions, offers being generated for different clusters can be revisited using this information.
Figure 25 Average seconds spend b/w clicks and average no of clicks by user on hotel website
By analyzing these 3 figures, we can clearly understand how Booklyng is helping hotels to convert user bookings. The conversion rate, black, is the number of people that make a reservation
47
Figure 26 Conversion rate (%) and Engagement rate (%)
Figure 27 Promo conversion rate (%)
via Booklyng divided by the number of people who see a Booklyng popup, the engagement rate, yellow, is the number of people that sign-up to a Booklyng offer divided by the number of people that see a popup and the promo-conversion rate, red, is the number of people that make a reservation via Booklyng divided the number that signed-up to an offer.
We can see cluster Best conversion has best conversion / engagement and promo conversion rate. Cluster Spanish has the best engagement rate but still promo conversion rate is going down. These users are abandoned users. Still more study can be done on these users.
Finally, an attempt to visualize the PCA data via scatter plot of the first two principal component.