2017 | Lavras | Editora UFLA | www.editora.ufla.br | www.scielo.br/cagro
Genetic divergence among interspecific
Paspalum
hybrids based
on seed production traits
Divergência genética entre híbridos interespecíficos de Paspalum baseada em caracteres da produção de sementes
Rodrigo Ramos Lopes1*, Lucia Brandão Franke1, Cléber Henrique Lopes de Souza1, Patrícia Bertoncelli1, Larissa Arnhold Graminho1
1Universidade Federal do Rio Grande do Sul/UFRGS, Porto Alegre, RS, Brasil
Corresponding author: lopezhsf@hotmail.com
Received in March 9, 2017 and approved in June 6, 2017
ABSTRACT
The use of genetic divergence as a basis for identifying superior individuals, with greater heterozygosity, is important in view of the difficulty
when selecting of dissimilar genotypes exhibiting high average for interest traits. The aim of this study was to evaluate the genetic divergence and the expression of seed production traits in seventeen apomictic Paspalum plicatulum × Paspalum guenoarum hybrids and two male parents (P. guenoarum). A randomized block design was used, with genotypes individually arranged into ten blocks. The following traits were assessed: total
number of tillers/plant (TT), reproductive tiller/plant (RT), number of racemes per inflorescence (NRI), reproductive tiller height (RTH), inflorescence rachis length (IRL), number of seeds/inflorescence (NSI), weight of a thousand seeds (WTS) and seed production (SP). Genetic divergence among
the genotypes was estimated using the Tocher method and UPGMA clustering, based on the generalized Mahalanobis distance (D2
ii’). The Tocher and UPGMA optimization methods showed high concordance. The traits that most contributed to genetic divergence were RTH (23.59%), IRL (21.63%), WTS (16.67%) and SP (14.23%). The presence of genetic diversity made it possible to identify divergent genotypes and those with high means for the traits studied, allowing the selection of genotypes with significant breeding potential. Repeated cross-breeding of female superior plants with the genotypes Azulão and H20 can result in a high heterosis effect on seed production characteristics.
Index terms: Clustering analyses; seed yield components; P. plicatulum; P. guenoarum.
RESUMO
A utilização da divergência genética como base para a identificação de indivíduos superiores, com maior heterozigose, é importante diante da dificuldade de escolha de genótipos dissimilares, que apresentem média elevada para as características de interesse. O objetivo deste trabalho foi avaliar a divergência genética e a expressão dos caracteres da produção de sementes de dezessete híbridos apomíticos de Paspalum plicatulum × Paspalum guenoarum e dois genitores masculinos (P. guenoarum). O delineamento experimental utilizado foi o de blocos casualizados, com os genótipos arranjados individualmente em dez blocos. Foram avaliadas as seguintes características: total de perfilhos/planta (TP), perfilhos reprodutivos/planta (PR), número de racemos/inflorescência (NRI), altura dos perfilhos reprodutivos (APR), comprimento de inflorescência (CI), número de sementes/inflorescência (NSI), peso de mil sementes (PMS) e produção de sementes (PS). A divergência genética entre os genótipos foi estimada pelos métodos de agrupamento de Tocher e UPGMA, com emprego da distância
generalizada de Mahalanobis (D2
ii’). Os métodos de otimização de Tocher e UPGMA foram concordantes entre si. As características APR (23,59%), CI (21,63%), PMS (16,67%) e PS (14,23%) foram as que mais contribuíram para a divergência genética. A presença de variabilidade genética permitiu a identificação de genótipos divergentes e com médias elevadas para os caracteres estudados, o que possibilita selecionar genótipos com elevado potencial para fins de melhoramento genético. O cruzamento repetido de plantas sexuais superiores com os genótipos Azulão e H20 pode proporcionar efeito heterótico elevado nos caracteres da produção de sementes.
Termos para indexação: Análise de agrupamentos; componentes do rendimento de sementes; P. plicatulum; P. guenoarum.
INTRODUCTION
The genus Paspalum L. is the most important natural pasture grass in South America and is ecologically dominant in different grasslands used for livestock (Novo et al., 2016). In Brazil, it stands out in terms of the large number of native species and high yields in total dry matter, TDM (15995 kg ha-1) and leaf dry matter, LDM (11218 kg ha-1),
as well as high digestibility and cold tolerance (Pereira et al., 2012; Pereira et al., 2015).
However, it exhibits different levels of ploidy and reproductive behavior, whereby diploid populations reproduce sexually while polyploids reproduce by apomixes (Sartor et al., 2011). Cross-breeding when one of the parent plants reproduces sexually generates variability and enables
hybrid vigor will be fixed due to apomixis (Acuña et al., 2011). Sartor, Quarín and Espinoza (2009) induced polyploidy with colchicine and obtained a tetraploid sexual plant of P. plicatulum denominated 4c-4x,enabling the production of new hybrids through cross-breeding with genotypes of P. guenoarum (Aguilera et al., 2011).
Motta et al. (2016) and Motta et al. (2017) evaluated the superior progenies resulting from these crosses and
identified the existence of genetic variability in agronomic
characteristics in different locations and years. The authors
obtained significant TDM (21463.0 kg ha-1) and LDM
yields (17370.0 kg ha-1) and a high leaf:stem ratio (9.6) in several of the genotypes studied, demonstrating the emergence of a new cultivar or new hybridization cycles.
However, artificial selection pressure in species used
for livestock farming prioritizes genotypes that express effective gains in forage traits, such as leaf production, the primary trait linked to forage quality and directly linked to total dry matter produced by the plant (Pereira et al., 2012). Current breeding programs to obtain superior genotypes lack strategies that include the combined selection of agronomic characteristics and the ability to produce viable seeds, crucial to ensure widespread adoption of new cultivars (Lopes;
Franke, 2011). The authors confirmed that although Paspalum
species show excellent results in terms of forage production, commercial production is limited by the lack of public incentive policies and studies on producing high quality seeds.
The aim of this study was to evaluate the genetic divergence of seventeen apomictic Paspalum plicatulum
× P. guenoarum hybrids and two apomictic hybrids of P. guenoarum based on seed production traits, in order to expand genetic improvement prospects in the Paspalum
breeding program.
MATERIAL AND METHODS
The experiment was conducted in the 2013/2014 and 2014/2015 growing seasons in Eldorado do Sul (Rio Grande do Sul state – RS), located in the Central Depression region (30º05’52”S and 51º39’08”W, at an altitude of 32 m). The climate is type Cfa, according to the Köppen classification
system, with annual rainfall of 1440 mm (monthly average
of 120 mm). The soil is dystrophic Argisoil (Rhodustults – PVd) (Embrapa, 2013), with the following chemical
characteristics: pH (H2O) = 5.6; SMP index = 6.1; P = 4.5 mg dm-3; K = 80 mg dm-3; organic matter (OM) = 1.2%; Al3+ = 0.0 cmol dm-3; Ca2+ = 2.9 cmolc dm-3; Mg2+ = 1.4 cmolc dm-3; and cation exchange capacity (CEC) = 8.4 cmolc dm-3. The experimental area (15.0 m × 24.0 m = 360.0 m2) was corrected with 2500 kg ha-1 of lime on July 7, 2013. In
October 2013, 290.0 kg ha-1 of 5-20-20 fertilizer, satisfying the demand for potassium. This recommended amount was supplemented with 115.0 kg ha-1 of N (urea) and 145.0 kg ha-1 of P
2O5 (triple superphosphate), meeting the needs of
perennial warm-season grasses (CQFS-RS/SC, 2004). In the second year, 30.0 kg ha-1 of N (urea) and 75.0 kg ha-1 of P2O5 (replenishment dose) were applied.
Nineteen apomictic genotypes of Paspalum were
used, consisting of thirteen hybrids belonging to UFRGS (Universidade Federal do Rio Grande do Sul), Forage Plants and Agrometeorology Department (“10E” prefix), originated from artificial crosses between P. guenoarum Azulão and Baio (male genitor) and P. plicatulum 4c-4x (female genitor),
four hybrids [Rojas cultivar (P. guenoarum) × 4c-4x (P. plicatulum)], called H12, H13, H20 and H22, from Botanical
Institute of the Northeast (IBONE, Corrientes province, Argentina) (Sartor et al., 2009; Aguilera et al., 2011) and two native genotypes (P. guenoarum “Azulão” and “Baio”)
from Rio Grande do Sul state. These genotypes stood out,
in preliminary studies, for greater forage production (Huber et al., 2016; Motta et al., 2016; Motta et al., 2017; Pereira et al., 2012; Pereira et al., 2015).
Seedlings were kept in a greenhouse during the winter
until the time for planting in the field (October 24, 2013). In the second year, rejuvenation pruning was performed on all the
genotypes (September 26, 2014), leaving 0.15 m of residue. Seeds were manually harvested, when more than
50% of inflorescences exhibited brown coloring and signs of dehiscence in caryopses. All inflorescences per plant were harvested (March 25, 2014 - first year, and February
18, 2015 - second year). Prior to harvesting, the following characters were assessed: a) TT, number of total tillers -
direct count of all the tillers/plant; b) RT, reproductive tillers/ plant - direct count of the tillers that formed inflorescences; c) NRI, number of racemes/inflorescence - average number of racemes of six inflorescences from each plant, randomly chosen for each genotype; d) RTH, reproductive tiller height at the flowering stage – mean of four randomly selected
reproductive tillers from the center of the tussock, with
fully formed inflorescences. The determination was with a
ruler, placed vertically from the soil surface to the insertion
point of inflorescence. The results were expressed in cm.
The following analyses were conducted after
seed harvesting: a) SP, seed production/plant - all the inflorescences collected per plant were dried in a forced air oven at 30 °C for 72 h and manually threshed. Sieves were
used to remove impurities and a South Dakota blower to separate heavy and empty seeds. After cleaning, the pure seeds of each genotype were weighed, expressed in g; b)
subsamples of 100 seeds, multiplied by 10 (Brasil, 2009); c)
NSI, number of seeds/inflorescence – rule of three between WTS and the average weight of seeds per inflorescence. The average weight of seeds/inflorescence was determined at harvest, when six intact inflorescences were separated
from each genotype, manually threshed, processed and individually weighed on a precision scale, expressed in
g; d) IRL, inflorescence rachis length - average length of six inflorescences from each plant, obtained with the aid
of the graduated scale (cm), by measuring the distance
between the insertion point of the first and last raceme in the inflorescence. The results were expressed in cm.
A randomized block design was used, with genotypes individually (individual plants) arranged into ten blocks. The experiment was composed of 190 experimental units (intra and inter-row spacing of 1.0 m), corresponding to the 19 genotypes, with ten repetitions. The data were statistically interpreted by analysis of variance and, in the event of a
significant difference; means were compared using the
Scott-Knott test at 5% probability. Clustering analyses were conducted considering the standardized Mahalanobis (D2
ii’) distance as dissimilarity measure and, as joining methods, the Tocher’s optimization method and the Unweighted Pair Groups with Arithmetical Averages (UPGMA). Clusterings
were performed using the eight variables studied. The
magnitude of the relative contribution of the variables (S.j), for the total variability observed, was determined by Singh’s model (1981). The cophenetic correlation coefficient (CCC), obtained from 1000 simulations and analyzed by “t” test,
was calculated to assess the accuracy of the clusters. Data
was analyzed using the Genes software (Cruz, 2013).
RESULTS AND DISCUSSION
Significant differences (p<0.05) were observed in
the expression of seed production traits in the Paspalum
genotypes, suggesting the presence of genetic variability and, consequently, the possibility of obtaining genetic gains in breeding programs (Table 1).
Source of Variability DF Mean Square
TT RT NRI RTH
Block 9 2211.3 2432.1 0.2 75.4
Genotype (G) 18 21824.3** 20955.7** 25.0** 5526.5**
Year (Y) 1 117040.9** 184580.6** 0.6 ns 0.2 ns
G × Y 18 7116.9** 5434.9** 10.8** 3.3 ns
Error 333 424.2 370.6 0.2 29.5
Total 379 − − − −
Means 180.2 145.1 6.0 126.7
C.V. (%) 11.4 13.2 8.3 4.3
Source of Variability DF Mean Square
IRL NSI WTS SP
Block 9 0.7 96.7 <0.1 155.3
Genotype (G) 18 150.26** 45706.5** 2.8** 9438.3**
Year (Y) 1 <0.1 ns 91667.4** 3.8** 61707.5**
G × Y 18 <0.1 ns 8594.7** 0.2** 558.3**
Error 333 0.9 106.9 <0.1 57.7
Total 379 − − − −
Means 18.5 175.8 3.4 64.9
C.V. (%) 5.1 5.9 3.6 11.7
Table 1: Summary of analysis of variance for the seed production characters in Paspalum genotypes.
** Significant at 1% of probability, by F-Test; ns, not significance. TT, total tillers; RT, reproductive tillers; NRI, number of racemes
per inflorescence; RTH, reproductive tiller height; IRL, inflorescence rachis length; NSI, number of seeds per inflorescence; WTS,
The experimental year exerted a greater influence
than other factors on the phenotypic expression of total
tillers (TT), reproductive tillers (RT), number of seeds per inflorescence (NSI), weight of a thousand seeds (WTS)
and seed production (SP). Significant genotype × year
interaction for NSI, TT and RT indicates that more than one
year of assessment is needed to effectively determine seed production traits for the genotypes. Identifying genotypes with greater phenotypic stability is a widely used alternative to minimize the effects of genotype x environment interaction and make the process of identifying of forage plants (Melo
et al., 2007). The traits reproductive tiller height (RTH) and inflorescence rachis length (IRL) showed no significance for
genotype × year interaction (p>0.05), demonstrating that the expression of these characteristics is inherent to the genotype.
The coefficient of variation ranged between 3.6 and 13.2 %,
indicating good consistency for experimental data (Table 1).
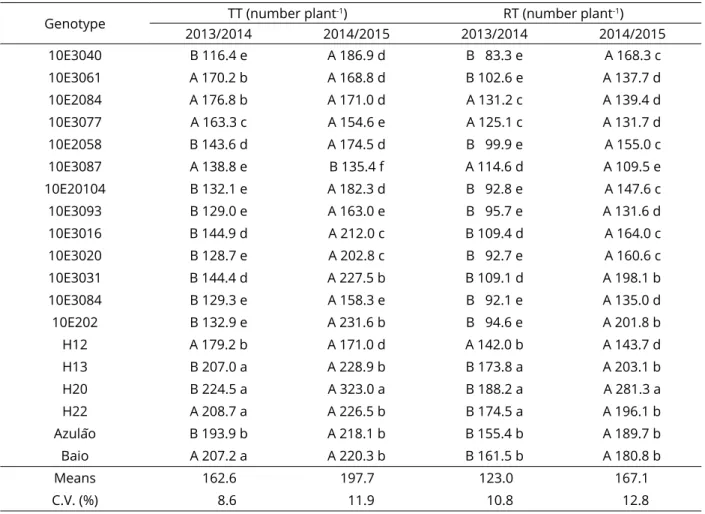
The highest TT values essentially occurred in the
second year of assessment, except for genotype 10E3087, which exhibited a larger population of tillers in the first
year (Table 2).
In the first year, five different classes formed in
relation to TT. The genotypes with the highest values
were H20, H22, Baio and H13. The second year resulted
in greater variability, with the formation of six statistically
distinct classes, the most significant genotype being H20
(Table 2). Evaluating the agronomic potential of Paspalum
genus apomictic genotypes, Pereira et al. (2015) reported the superiority of TT, TDM and LDM of the H20 genotype in relation to the others, surpassing even their parents. According to Pereira et al. (2012), total dry matter (TDM) and leaves dry matter (LDM) are decisive characters in forage plants improvement, in order to obtain superior performance Paspalum cultivars.
Genotype TT (number plant
-1) RT (number plant-1)
2013/2014 2014/2015 2013/2014 2014/2015
10E3040 B 116.4 e A 186.9 d B 83.3 e A 168.3 c
10E3061 A 170.2 b A 168.8 d B 102.6 e A 137.7 d
10E2084 A 176.8 b A 171.0 d A 131.2 c A 139.4 d
10E3077 A 163.3 c A 154.6 e A 125.1 c A 131.7 d
10E2058 B 143.6 d A 174.5 d B 99.9 e A 155.0 c
10E3087 A 138.8 e B 135.4 f A 114.6 d A 109.5 e
10E20104 B 132.1 e A 182.3 d B 92.8 e A 147.6 c
10E3093 B 129.0 e A 163.0 e B 95.7 e A 131.6 d
10E3016 B 144.9 d A 212.0 c B 109.4 d A 164.0 c
10E3020 B 128.7 e A 202.8 c B 92.7 e A 160.6 c
10E3031 B 144.4 d A 227.5 b B 109.1 d A 198.1 b
10E3084 B 129.3 e A 158.3 e B 92.1 e A 135.0 d
10E202 B 132.9 e A 231.6 b B 94.6 e A 201.8 b
H12 A 179.2 b A 171.0 d A 142.0 b A 143.7 d
H13 B 207.0 a A 228.9 b B 173.8 a A 203.1 b
H20 B 224.5 a A 323.0 a B 188.2 a A 281.3 a
H22 A 208.7 a A 226.5 b B 174.5 a A 196.1 b
Azulão B 193.9 b A 218.1 b B 155.4 b A 189.7 b
Baio A 207.2 a A 220.3 b B 161.5 b A 180.8 b
Means 162.6 197.7 123.0 167.1
C.V. (%) 8.6 11.9 10.8 12.8
Table 2: Means of the total tillers (TT), reproductive tillers (RT), number of racemes per inflorescence (NRI) and
reproductive tiller height (RTH) in seed production characters of Paspalum genotypes.
RT showed variability in the first year of establishment (2013/2014), with five distinct classes and genotypes H20, H22 and H13 demonstrated as superior.
Similar behavior was observed in the perennial year
(2014/2015), with the formation of five classes and H20
standing out as superior (Table 2). Analysis of these results
showed a larger number of RT in the second year. However, there were no significant differences (p>0.05) between the years for genotypes H12, 10E2084, 10E3077 and 10E2058 (Table 3). The literature describes RT as the trait
most correlated with Paspalum seed production (Lopes; Franke, 2011), in addition to serving as an indicator for breeding programs aimed at producing seeds of forage species (Biligetu et al., 2013).
The greatest expression of NRI variability was
observed in the first year, with the formation of six
groups and genotypes H22 and Baio identified as superior
(Table 2). Variability was lower in the second year, with the formation of four classes and the Azulão genotype
confirmed as superior. Genotypes 10E3060, 10E20104 and 10E3020 exhibited lower NRI in the first and second years of assessment (Table 2). According to Wunderlin et al.
(2017), P. guenoarum and P. plicatulum have 6-12 and 3-7
NRI, respectively. Selective crossbreeding between these
species produces new hybrid combinations, contributing to the genetic variability of this trait.
Significant genetic divergence was observed for RTH (Table 2), with variation between the genotypes (p<0.05). Nine phenotypic classes occurred over the
two-year period, identifying Azulão and Baio as superior.
Genotype H22 showed the lowest RTH values. This
characteristic should be exploited with caution, since
Values followed by the same letter in columns (lower case) and rows (uppercase) do not differ by the Scott-Knott test, at 5%
probability.
Genotype NRI (number inflorescence
-1) RTH (cm)
2013/2014 2014/2015 2013/2014 2014/2015
10E3040 A 4.7 e A 5.1 d A 107.1 g A 108.8 g
10E3061 B 4.0 f A 5.0 d A 117.9 e A 119.0 f
10E2084 A 5.8 d B 5.0 d A 112.2 f A 112.3 g
10E3077 A 6.0 d B 4.7 d A 141.1 b A 139.1 c
10E2058 B 5.8 d A 6.5 b A 103.0 h A 104.3 h
10E3087 A 6.7 c A 6.5 b A 134.4 c A 133.7 d
10E20104 B 4.0 f A 5.0 d A 123.6 d A 132.7 e
10E3093 A 5.9 d A 6.0 c A 128.1 d A 127.2 e
10E3016 A 5.7 d A 5.4 d A 121.9 e A 121.9 e
10E3020 B 4.0 f A 5.0 d A 116.9 e A 116.5 f
10E3031 A 4.9 e A 5.3 d A 124.0 d A 124.0 e
10E3084 B 5.0 e A 6.0 c A 138.9 c A 139.0 c
10E202 A 5.9 d A 6.0 c A 121.1 e A 121.5 e
H12 B 5.9 d A 7.9 a A 134.5 c A 134.0 d
H13 A 7.6 b B 6.6 b A 145.7 b A 145.9 b
H20 A 6.6 c A 6.5 b A 125.2 d A 125.4 e
H22 A 10.0 a B 6.4 b A 96.0 i A 95.8 i
Azulão B 6.0 d A 7.5 a A 156.9 a A 157.8 a
Baio A 9.8 a B 6.4 b A 157.8 a A 157.9 a
Means 6.0 5.9 126.6 126.7
C.V. (%) 7.7 8.8 5.4 2.8
taller plants are more prone to lodging. Short plants, in
turn, make mechanical harvesting difficult due to the accumulation of plant matter. Regulation between plant
height and mass largely depends on the stresses imposed by the environment and the type of crop management used (Lopes et al., 2016).
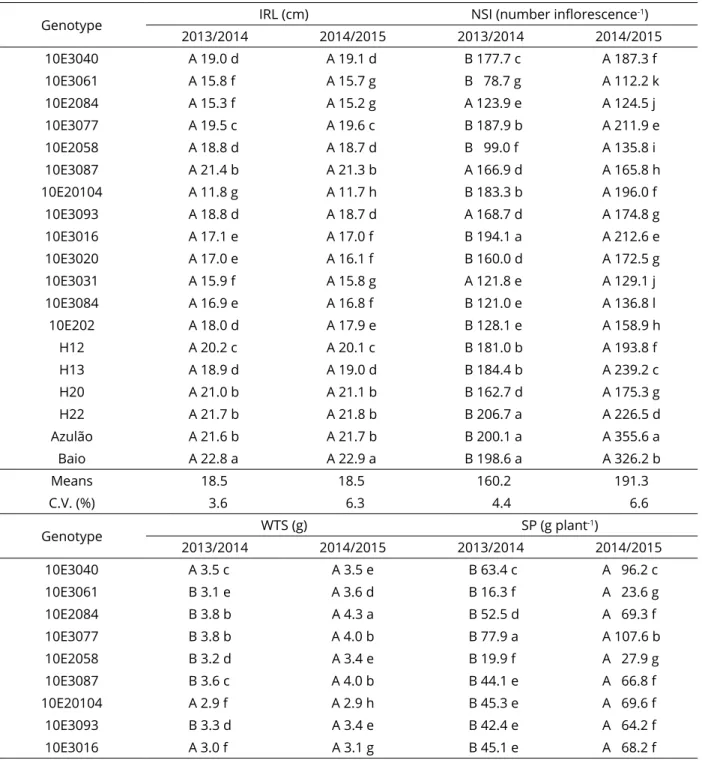
Table 3: Means of the inflorescence rachis length (IRL), number of seeds per inflorescence (NSI), weight of
thousand seeds (WTS) and seed production (SP) in seed production characters of Paspalum genotypes.
Genotype IRL (cm) NSI (number inflorescence
-1)
2013/2014 2014/2015 2013/2014 2014/2015
10E3040 A 19.0 d A 19.1 d B 177.7 c A 187.3 f
10E3061 A 15.8 f A 15.7 g B 78.7 g A 112.2 k
10E2084 A 15.3 f A 15.2 g A 123.9 e A 124.5 j
10E3077 A 19.5 c A 19.6 c B 187.9 b A 211.9 e
10E2058 A 18.8 d A 18.7 d B 99.0 f A 135.8 i
10E3087 A 21.4 b A 21.3 b A 166.9 d A 165.8 h
10E20104 A 11.8 g A 11.7 h B 183.3 b A 196.0 f
10E3093 A 18.8 d A 18.7 d A 168.7 d A 174.8 g
10E3016 A 17.1 e A 17.0 f B 194.1 a A 212.6 e
10E3020 A 17.0 e A 16.1 f B 160.0 d A 172.5 g
10E3031 A 15.9 f A 15.8 g A 121.8 e A 129.1 j
10E3084 A 16.9 e A 16.8 f B 121.0 e A 136.8 l
10E202 A 18.0 d A 17.9 e B 128.1 e A 158.9 h
H12 A 20.2 c A 20.1 c B 181.0 b A 193.8 f
H13 A 18.9 d A 19.0 d B 184.4 b A 239.2 c
H20 A 21.0 b A 21.1 b B 162.7 d A 175.3 g
H22 A 21.7 b A 21.8 b B 206.7 a A 226.5 d
Azulão A 21.6 b A 21.7 b B 200.1 a A 355.6 a
Baio A 22.8 a A 22.9 a B 198.6 a A 326.2 b
Means 18.5 18.5 160.2 191.3
C.V. (%) 3.6 6.3 4.4 6.6
Genotype WTS (g) SP (g plant
-1)
2013/2014 2014/2015 2013/2014 2014/2015
10E3040 A 3.5 c A 3.5 e B 63.4 c A 96.2 c
10E3061 B 3.1 e A 3.6 d B 16.3 f A 23.6 g
10E2084 B 3.8 b A 4.3 a B 52.5 d A 69.3 f
10E3077 B 3.8 b A 4.0 b B 77.9 a A 107.6 b
10E2058 B 3.2 d A 3.4 e B 19.9 f A 27.9 g
10E3087 B 3.6 c A 4.0 b B 44.1 e A 66.8 f
10E20104 A 2.9 f A 2.9 h B 45.3 e A 69.6 f
10E3093 B 3.3 d A 3.4 e B 42.4 e A 64.2 f
10E3016 A 3.0 f A 3.1 g B 45.1 e A 68.2 f
Genotype was a decisive factor in IRL variation (p<0.05), forming seven classes in the first year and eight in the second (Table 3). In both years, the Baio genotype obtained the highest IRL values. H22, Azulão, 10E3087
and H20 (second class) also stood out, displaying higher
values than the remaining genotypes. Inflorescence length
is a desirable trait in that it is positively correlated with the
number of seeds per inflorescence and therefore associated with final seed production (Luz et al., 2016).
The genotypes showed different behavior in
different environments for NSI (Table 3). In the first
year, seven statistically different classes were formed
(p<0.05), with H12, Azulão, Baio and 10E3016 exhibiting
higher means in relation to the remaining genotypes. The best performance was observed in the second year, with
significant variation between genotypes, forming eleven
different classes. The highest mean NSI was recorded in
the native Azulão genotype (Table 3). IRL influences this trait, since a higher NRI leads to greater expression of NSI. Analysis of Tables 2 and 3 corroborates this statement.
WTS variability was expressed in the formation of seven phenotypic classes in the first year and eight in the second (Table 3). Genotype 10E3084 exhibited higher WTS (p<0.05) in both years. In the second year,
genotype 10E2084 did not differ statistically (p>0.05)
from 10E3084 (Table 3). Evidence suggests that seed size
plays an important role in regulating genetic control of the
number of seeds produced (Sadras, 2007). According to Nakagawa (2014), plants show plasticity or the ability to
compensate in regulating inflorescence traits, that is, an
increase in one leads to a decrease in another.
SP was higher in the second year (Table 3), enabling
the expression of greater variability among the genotypes.
According to Souza (2001), in the first year of cultivation,
perennial grasses exhibit lower yields due to the delayed onset of the reproductive phase, indicating the existence
of a juvenile period, when plants need a certain level of growth before flowering. The first year saw the formation
of six classes, whereas seven statistically difference classes were observed in the second year. The genotypes Azulão
and 10E3077 produced the most seeds in year one, and
Azulão continued to do so in the second year. However,
the performance of H20 and 10E3077 was also noteworthy.
The lowest seed production rates were recorded for
10E3061 and 10E2058 (Table 3).
Clustering analysis using the Tocher method distributed the nineteen genotypes studied into eight different groups based on their genetic similarity (Table 4).
Group I contained eight genetically similar genotypes,
representing 42.1% of the total, suggesting that they form part of the same heterotic group (Table 4). Although the genotypes had different male parents (Azulão, Baio and
Rojas), they were similar genetically and formed the same
cluster. It is possible that the genetic component from the
Values followed by the same letter in columns (lower case) and rows (uppercase) do not differ by the Scott-Knott test, at 5%
probability.
Genotype WTS (g) SP (g plant
-1)
2013/2014 2014/2015 2013/2014 2014/2015
10E3020 B 3.5 c A 3.9 c B 47.2 e A 68.9 f
10E3031 B 3.5 c A 3.6 d B 41.5 e A 66.1 f
10E3084 B 4.1 a A 4.2 a B 43.0 e A 76.1 f
10E202 B 3.5 c A 3.8 c B 42.0 e A 68.5 f
H12 A 3.1 e A 3.1 f B 65.8 c A 84.5 e
H13 B 3.0 f A 3.2 f B 63.6 c A 82.8 e
H20 A 3.6 c B 3.3 f B 72.1 b A 109.3 b
H22 B 3.1 e A 3.5 e B 66.3 c A 90.7 d
Azulão A 3.1 e A 3.2 f B 82.6 a A 133.2 a
Baio B 2.8 g A 3.1 g B 60.6 c A 102.4 c
Means 3.3 3.5 52.2 77.8
C.V. (%) 4.1 3.1 10.8 11.4
female parent (4c-4x) influenced this similarity. Group II
consisted of three genotypes, accounting for 15.7% of the total, including the male parents Azulão and Baio, as well
as genotype H13 (Table 4), exhibiting the greatest genetic similarity for RTH and NSI (Table 2 and 3). Groups III
and IV consisted of two genotypes, indicating that 10.5% of the total were in the same group. The third group (III)
contained genotypes 10E3077 and 10E3084 (Table 4),
with similar mean TT values in relation to the other genotypes (Table 2). The most noteworthy traits for
10E3061 and 10E2058 (group IV) were the low mean NSI and SP values (Table 4). Genotypes 10E2084 (highest mean WTS), 10E20104 (lowest mean NRI, IRL and WTS), H22 (lowest mean RTH and highest NRI) and H20 (highest mean TT, RT and SP) formed groups V, VI, VII and VII,
respectively (Table 4). Each of these groups represented
5.3% of the total, confirming their relatively high distance
values for the pairs in which they participated. Vasconcelos et al. (2007) emphasized the peculiarity of this method in generally combining the highest number of genotypes in
the first group and isolated individuals clustered in the last
groups. In this type of study, this characteristic is relevant because it makes it possible to identify both genetically dissimilar individuals and groups.
The genotypes within each group showed a mean genetic distance of less than 0.20, that is, mean intragroup similarity was greater than 0.80, demonstrating that the groups formed were homogeneous (Table 4). Intergroup analysis indicated higher genetic divergence between groups VII and VIII when compared with group VI (122.68 and
113.61, respectively), and greater similarity between groups
III and V (29.53) (Figure 1). The Tocher method showed that
mean intergroup distance was consistently higher than the mean intragroup distance, meaning that homogeneity will be greater between genotypes of a same group than those from different groups (Vasconcelos et al., 2007).
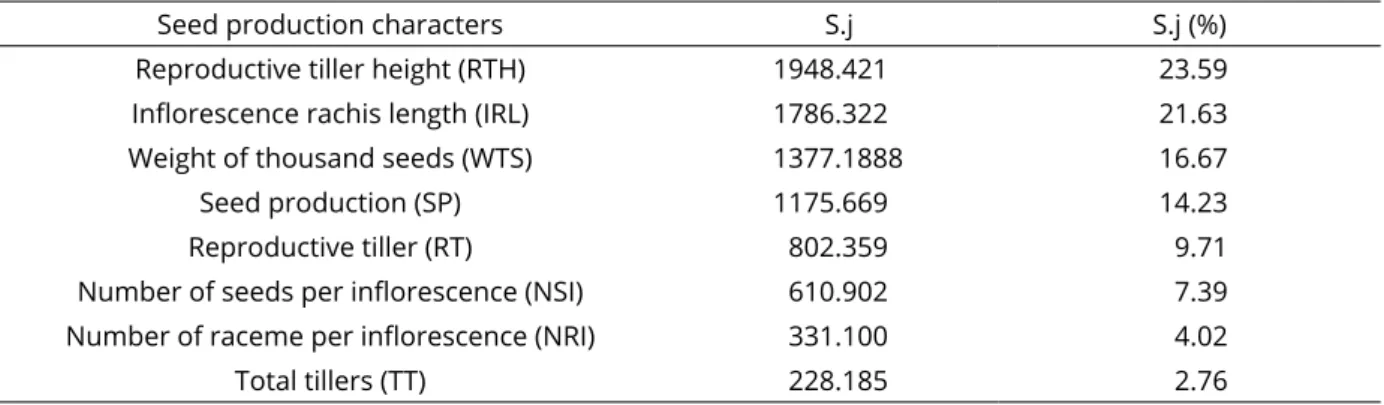
Analysis of the relative contribution of each variable
to genetic dissimilarity found the highest values for RTH and IRL (45.22%) and WTS and SP (30.90%), accounting for 76.12% of genetic divergence, while RT and NSI contributed
to 17.10%. The traits with the lowest relative importance
were NRI and TT, with a combined total of 6.78% (Table 5). Among the traits studied, RTH and IRL were the most efficient at explaining divergence among genotypes, in addition to WTS and SP. RT and NSI are the yield components most correlated with final seed production in
the genus Paspalum (Lopes et al., 2016; Lopes and Franke, 2011); however, in this study, they contributed to the genetic divergence of genotypes with median values. The remaining quantitative descriptors used contributed little to explaining
the diversity observed among the genotypes. NRI and TT
accounted for 4.02% and 2.76%, respectively, despite showing
substantial variability (4.0-10.0 racemes and 116.4 - 322.0
total tillers) (Table 2). The low contributions of these traits are agronomically relevant, demonstrating the need to increase their variability as interest demands. Pereira et al. (2012) studied apomictic Paspalum genotypes and found no tillering differences, suggesting crossbreeding with sexual plants with more tillers to generate variability. TT was essential to the production of forage in the genotypes studied, showing
significant correlations (p<0.05) with TDM (r = 0.82) and
LDM (r = 0.68) (Motta et al., 2016; Motta et al., 2017).
Group Genotype % Mean dissimilarity within each group
I 10E3020 10E202 10E3031 10E3093 10E3016 10E3040 H12 10E3087 42.1 0.19
II Azulão Baio H13 15.7 0.17
III 10E3077 10E3084 10.5 0.16
IV 10E3061 10E2058 10.5 0.20
V 10E2084 5.3 −
VI 10E20104 5.3 −
VII H22 5.3 −
VIII H20 5.3 −
Total 19 100.0
Largest distance between the minimums = 26.9012
Table 4: Cluster analysis by the Tocher optimization method obtained based on Mahalanobis distances (D2 ii’) and
From a plant breeding perspective, data processing using more than one method and considering the peculiarities of each increases the credibility of inferences, substantiating decision-making in selecting promising genotypes for future crosses.
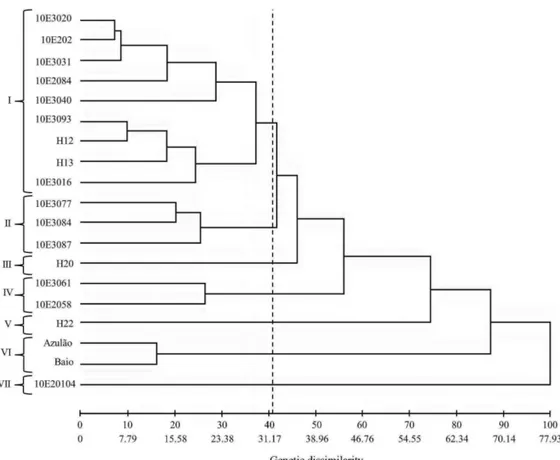
UPGMA clustering distributed the nineteen genotypes
studied into seven different groups based on their genetic
similarity (Figure 2). A cutoff point was applied by subjective interpretation (Cruz et al., 2012) at a distance of 32.26, corresponding to 41.39% of the highest level of fusion.
Both methods showed a tendency to discriminate genotypes (groups) in a similar, but not identical, manner.
Group I was the largest, composed of nine genotypes
and representing 47.4% of those assessed (Figure 2).
Figure 1: Clustering diagram formed by Tocher’s method representing the relationships of average distances
between the clusters, based on generalized Mahalanobis distance (D2
ii’).
Seed production characters S.j S.j (%)
Reproductive tiller height (RTH) 1948.421 23.59
Inflorescence rachis length (IRL) 1786.322 21.63
Weight of thousand seeds (WTS) 1377.1888 16.67
Seed production (SP) 1175.669 14.23
Reproductive tiller (RT) 802.359 9.71
Number of seeds per inflorescence (NSI) 610.902 7.39
Number of raceme per inflorescence (NRI) 331.100 4.02
Total tillers (TT) 228.185 2.76
Table 5: Relative contribution (S.j) of characteristics to genetic diversity according to Singh (1981) based on the
generalized Mahalanobis distance (D2
It contained the same genotypes from group I formed
using the Tocher method, with the exception of H13 and
10E2084 (groups II and V, respectively). In relation to
the Tocher method, UPGMA clustering exhibited more
complex formation at smaller distances, making it possible to visualize the most similar genotypes within the groups.
Group II (UPGMA method) contains the same genotypes
as group III under the Tocher method, with the exception
of genotype 10E3087, which was allocated to group I
when using this technique (Table 4). The male parents, Azulão and Baio, were clustered into group VI, with a
genetic distance of 12.62 (Figure 2). UPGMA hierarchical
clustering (Figure 2) and the Tocher optimization method (Table 4) showed high concordance in grouping genotypes
10E3061 and 10E2058 into the same group (IV), in
addition to H20 (group III), H22 (group V) and 10E20104 (group VII) in isolation. The most similar genotypes were
10E3020 and 10E202 (divergence of 5.63) and 10E20104 was classified as the most divergent (77.93) (Figure 2).
The cophenetic correlation coefficient (CCC) was 73% (r = 0.7252; p<0.0001; 1000 simulations), indicating satisfactory fit between the similarity matrix
and the dendrogram obtained, so that the lines of the
dendrogram reasonably reflect the multivariate patterns
of genetic distance. Bertoni et al. (2007) suggest CCC
values above 0.80 to ensure a good fit between original
matric distances and the graph. However, lower values do not render the dendrogram useless, but rather indicate distortion, meaning it can still be used to assess the cluster formed.
Comparison of the means and analysis of
the clustering methods enabled the identification of
promising genotypes, as well as those that might result in limited variability in segregating generations. The most divergent genotypes can be used in targeted hybridization, making it possible to increase the number of desirable recombinants and obtain superior genotypes for seed production in Paspalum.
Figure 2: Dendrogram developed from quantitative data with the generalized Mahalanobis distance (D2 ii’) and
CONCLUSIONS
Continuous improvement should theoretically be possible through repeated crossbreeding of superior sexually reproducing plants with superior apomictic male pollinators. The high means obtained for seed production traits and the divergence of Azulão and H20 suggest that these genotypes could result in a high heterosis effect on seed production characteristics after additional hybridizations.
ACKNOWLEDEGMENT
To Coordenação de Aperfeiçoamento de Pessoal
de Nível Superior (CAPES, process 007488/2011-35) for financial support and scholarship granted.
REFERENCES
ACUÑA, C. A. et al. Tetraploid bahiagrass hybrids: Breeding
technique, genetic variability and proportion of heterotic
hybrids. Euphytica, 179(2):227-235, 2011.
AGUILERA, P. M. et al. Interspecific tetraploid hybrids between
two forage grass species: Sexual Paspalum plicatulum and apomictic P. guenoarum. Crop Science, 51(4):1544‑1550, 2011.
BERTONI, B. W. et al. Genetic variability in natural populations
of Zeyheria montana Mart. from the Brazilian cerrado. Scientia Agricola, 64(4):409-415, 2007.
BILIGETU, B. et al. Seed yield variation in plains rough fescue [Festuca hallii (Vasey) Piper] populations and its relation with phenotypic characteristics and environmental factors. Grass and Forage Science, 68(4):589-595, 2013.
BRASIL. Ministério da Agricultura, Pecuária e Abastecimento.
Regras para análise de sementes.Secretaria de Defesa
Agropecuária. Brasília: MAPA/ACS, 2009. 395p.
CQFS-RS/SC – Comissão de Química e Fertilidade do Solo.
Manual de adubação e calagem para os Estados do Rio Grande do Sul e de Santa Catarina. Porto Alegre: SBCS -
Núcleo Regional Sul, 2004. 400p.
CRUZ, C. D. GENES - A software package for analysis in
experimental statistics and quantitative genetics. Acta Scientiarum, 35(3):271-276, 2013.
CRUZ, C. D. et al. Modelos biométricos aplicados ao melhoramento genético. 4. ed. Viçosa: UFV, 2012. 514p.
EMBRAPA - Empresa Brasileira de Pesquisa Agropecuária.
Sistema Brasileiro de Classificação de Solos. 3 ed. Rio de Janeiro: CNPS, 2013. 353p.
HUBER, K. G. C. et al. Variabilidade agronômica e seleção de
progênies F1 de Paspalum. Revista Brasileira de Ciências Agrárias, 11(4):374-380, 2016.
LOPES, R. R. et al. Management of consecutive cuts in the production and quality of wintergreen paspalum seeds.
Revista Brasileira de Zootecnia, 45(10):587-595, 2016.
LOPES, R. R.; FRANKE, L. B. Produção de sementes de quatro ecótipos de Paspalum nativos do Rio Grande do Sul. Revista Brasileira de Zootecnia, 40(1):20-30, 2011.
LUZ, V. P. et al. Identificação de variabilidade para caracteres de importância agronômica em famílias mutantes de arroz
irrigado. Bragantia, 75(1):41-50, 2016.
MELO, L. C. et al. Interação com ambientes e estabilidade de
genótipos de feijoeiro-comum na Região Centro-Sul do Brasil.
Pesquisa Agropecuária Brasileira, 42(5):715-723, 2007.
MOTTA, E. A. M. da et al. Valor forrageiro de híbridos interespecíficos superiores de Paspalum. Revista Ciência Agronômica, 48(1):191-198, 2017.
MOTTA, E. A. M. da et al. Forage performance of Paspalum hybrids from an interspecific cross. Ciência Rural,
46(6):1025-1031, 2016.
NAKAGAWA, J. Os componentes da produtividade de sementes.
Informativo Abrates, 24(1):15-21, 2014.
NOVO, P. E. et al. Interspecific hybrids between Paspalum plicatulum and P. oteroi: A key tool for forage breeding. Scientia Agricola, 73(4):356-362, 2016.
PEREIRA, E. A. et al. Agronomic performance and interspecific
hybrids selection of the genus Paspalum. Científica,
43(4):388-395, 2015.
PEREIRA, E. A. et al. Variabilidade genética de caracteres
forrageiros em Paspalum. Pesquisa Agropecuária Brasileira, 47(10):1533-1540, 2012.
SADRAS, V. O. Evolutionary aspects of the trade-off between
seed size and number in crops. Field Crops Research,
100(2-3):125-138, 2007.
SARTOR, M. E. et al. Ploidy levels and reproductive behavior in natural populations of five Paspalum species. Plant Systematics and Evolution, 293(1):31-41, 2011.
SINGH, D. The relative importance of characteres affecting
genetic divergence. The Indian Journal of Genetics and Plant Breeding, 41(2):237-245, 1981.
SOUZA, F. H. D. Produção de gramíneas forrageiras tropicais. São Carlos: Embrapa Pecuária Sudeste,
2001. 43p.
VASCONCELOS, E. S. et al. Método alternativo para análise de agrupamento. Pesquisa Agropecuária Brasileira,
42(10):1421-1428, 2007.
WUNDERLIN, R. P. et al. Atlas of Florida Plants. Institute for Systematic Botany, University of South Florida. Available in: