i
BUSINESS CLIENTS' SEGMENTATION
BASED ON ACTIVITY
Pedro Afonso Bandeira Ferreira Marques
A Banking Approach
Internship report presented as partial requirement for
obtaining the Master’s degree in Information
ii NOVA Information Management School
Instituto Superior de Estatística e Gestão de Informação
Universidade Nova de Lisboa
BUSINESS CLIENTS' SEGMENTATION BASED ON
ACTIVITY - A BANKING APPROACH
by
Pedro Afonso Bandeira Ferreira Marques
Internship report presented as partial requirement for obtaining the Master’s degree in Information Management, with a specialization in knowledge Management and Business Intelligence
Advisor: Professor Doutor Frederico Cruz Jesus
iii
ACKNOWLEDGEMENTS
I would like to thank my thesis advisor Professor Frederico Cruz Jesus for all the guidance and patience during this year. He was an amazing advisor who was really there for me, always supporting me to do more and better, providing me with information and orientation, and it is because of him that this project is completed. To him, my deepest gratitude for the rest of my life.
I would also like to thank Professor Roberto Henriques who as such a huge help in the beginning of this project, guiding me to a good start and being always available to help.
Finally, I must express my very profound gratitude to my mom and dad who are always supporting me in all my adventures, to my friends for being there when I need them and specially to my dear friends and colleagues Miguel, Amélia, Joana, Ziad and Ana for all the good insights, ideas and revision of this project. This accomplishment would not have been possible without them all. Thank you.
iv
ABSTRACT
Clustering algorithms are frequently used by companies to segment their customers in order to develop accurate marketing strategies. The K-means is one of the most popular algorithms, despite its drawbacks in terms of seeds’ generation. In this study, several clustering algorithms were tested but in the end the K-means initialized with random seeds was used to segment the data due to its better performance. This B2B segmentation resulted in four clusters based on the activity patterns of each business client, The Loyals, The Minglers, The Challengers and The Believers. Each one of these clusters shows a different type of relationship with the bank, being the bank the first choice for The Loyals and for the Believers but not for the others.
KEYWORDS
B2B Segmentation; Banking Segmentation; Cluster Analysis; Hierarchical K-Means
v
INDEX
Introduction ... 1 Internship Objective ... 2 Company’s Background ... 2 Report Structure ... 2 Theoretical Background ... 4 Market Segmentation ... 4The path of banking through the digital ... 4
Data Mining (DM) ... 5 Hierarchical Methods ... 7 K-Means ... 8 Methodology ... 10 Tools ... 11 Variables ... 12
Analytical Base Table (ABT)... 13
Cluster Analysis for Outliers’ Removal ... 14
Factor Analysis ... 16
Cluster Analysis for Segmentation ... 18
Results and discussion ... 20
Cluster 1 (The Loyal) ... 24
Cluster 2 (The Mingler) ... 24
Cluster 3 (The Challenger) ... 25
Cluster 4 (The Believer) ... 25
Outlier Inclusion ... 27
Conclusions ... 29
Limitations and recommendations for future works ... 30
Limitations ... 32
Future Works ... 32
Bibliography ... 34
Appendix... 38
Appendix 1 - Interval variables’ statistics (standardized) ... 38
Appendix 2 - Ordinal variables’ frequency ... 39
vi
LIST OF FIGURES
Figure 1 - How K-means algorithm works ... 9
Figure 2 - Bank’s hard segmentation ... 10
Figure 3 - Z-Score formula... 12
Figure 5 – Parallel Analysis Criterion ... 18
Figure 4 – Scree Plot Criterion ... 18
Figure 7 – Elbow Graphic supporting the number of clusters chosen ... 19
Figure 8 – Clusters’ division... 23
Figure 9 – Cluster 1 activity variables ... 24
Figure 10 – Cluster 2 activity variables ... 24
Figure 11 – Cluster 3 activity variables ... 25
Figure 12 – Cluster 4 activity variables ... 25
Figure 13 – Outliers’ inclusion process ... 27
vii
LIST OF TABLES
Table 1 - New variables ... 14
Table 2 - New variables’ statistics ... 14
Table 3 - Outlier removal first iteration ... 15
Table 4 - Outlier removal second iteration ... 15
Table 5 - Outlier removal third iteration ... 16
Table 6 – Kaiser Criterion ... 17
Table 7 – K-Means random seeds Wilcoxon test (p-values)... 20
Table 8 – K-Means Ward seeds Wilcoxon test (p-values) ... 21
Table 9 – K-Means Centroid seeds Wilcoxon test (p-values) ... 22
Table 10 – K-Means Average-Linkage seeds Wilcoxon test (p-values) ... 22
viii
LIST OF ABBREVIATIONS AND ACRONYMS
ABT Analytical Base Table
APP Application (mobile application) ATM Automated Teller Machine BB Business to Business BC Business to Consumer
CRM Customer Relationship Management DM Data Mining
EI Sole Proprietorships NC Not Classified
OO Other Organizations POS Point of Sale
SAS Statistical Analysis System
1
INTRODUCTION
The banking’s business model has been suffering several changes. According to recent theories of financial intermediation, one of a bank’s main roles is to serve as a relationship lender. Relationships offer banks comparative advantages in lending through the accumulation of private information, which can arise from the length of the relationship over time and its breadth across multiple products. In turn, these relationships benefit bank customers through increased credit availability, such as greater amounts of credit and with lower prices (Agarwal, Chomsisengphet, Liu, Song, & Souleles, 2018).
According to Leverin & Liljander (2006), the Relationship Marketing (RM) has been put forth as a way for firms to develop mutually beneficial and valuable long-term relationships with customers. Relieved to work most effectively when customers are highly involved in the good or service, there is an element of personal interaction and customers are willing to engage in relationship building activities.
With the competitors’ proliferation, it became more difficult to attract new customers (Miguéis, Camanho, & Falcão E Cunha, 2012) so, understanding the needs of these customers at different levels of profitability and adjusting services based on those differences is more critical to companies than has been before (Zeithaml, Rust, & Lemon, 2001). The segmentation of the customers’ base revealed information about behavioral patterns of individual and business customers that would otherwise have been masked under a universal assessment of satisfaction scores (Athanassopoulos, 2000).
Thus, as DM techniques are rising as tools to analyze data resulting from customers’ activity, stored in large databases and find patterns in these great volumes of data (Miguéis et al., 2012), this report uses these techniques in order to perform a market segmentation based on customers’ banking activity.
This report consists in the description of an internship for a year in a Portuguese bank, performing the task of Data Analyst. This report consists in a previous literature review about the concepts being approached during the internship which serves as basis for the development the analysis and in the development of a clustering analysis for the bank’s business customers.
2 In this report are being used methods as factor analysis to reduce dimensionality of the database, k-means with random seeds and k-means with seeds predefined by three hierarchical methods (ward, average and centroid) in order to compare the performance of the usage of non-hierarchical methods before hierarchical methods and the non-hierarchical methods only.
I
NTERNSHIPO
BJECTIVEThe main objective of this internship is to develop a market segmentation for the bank’s business customers, regarding their involvement with the bank. Although it cannot be known which is the “1st Bank” of each customer, it can be explored the activity patterns in order to categorize their current activity with the bank and if the sector’s level of activity is profitable or not for the bank’s business model.
Nowadays observing the behavior of each customer one by one is impossible due to the market massification and scale economies. Therefore, this kind of projects has revealed itself a powerful tool for companies who store large amount of data from its customers, since it can be used to find behavioral patterns which allow a greater comprehension of these customers and consequently a better and more accurate marketing strategy.
C
OMPANY’
SB
ACKGROUNDThis company is a Portuguese private bank in the financial market in Portugal, being one of the most well-known Portuguese private banks with some branches in the country, approximately 7000 employees, with 16% market share, and the first private bank institution in terms of market share, to ever provide loans to customers and customer deposits in Portugal. Currently, the bank has operations in several European and African countries.
R
EPORTS
TRUCTUREFor this internship, it was proposed to me the development of a behavioral segmentation of the bank’s business customers, since there only existed a sectorial
3 segmentation which divides the customers into 4 clusters: B2B (Business to Business), B2C (Business to Consumer), EI (“Empresários em nome Individual”, which in English stands for Sole Proprietorship), OO (Other Organizations) and NC (Not Classified).
Being this a limitation for the bank in order to understand more about their customers, it was discussed the importance of having a behavioral segmentation based on the business customers’ activity with the bank aiming to know if they see this bank as the first-choice bank or not.
In order to achieve this goal, it will be developed a descriptive model with the purpose of clustering B2B, B2C and OO customers according to their similarities, finding patterns on their banking activities and thus aggregating them into the clusters since the ‘worst customers’ to the ‘best customers’.
Not Classified customers are companies that operate in Portugal but do not belong to the Portuguese fiscal system, so they will not enter the segmentation process along with EI customers which behavior is much more similar to personal banking.
4
THEORETICAL BACKGROUND
M
ARKETS
EGMENTATIONThe Marketing segmentation concept was introduced to the scientific community by Wendell R. Smith (1956) through the publication of the article: "Product Differentiation and Market Segmentation as Alternative Marketing Strategies." in 1956 He defined market segmentation as a process that divides the target customers of a company into groups, using their similarities in characteristics, behavior and needs to create homogeneous groups which are heterogeneous among the other groups (Smith, 1956).
Nowadays, this concept of market segmentation is a powerful tool mostly for big companies in order to understand their great number of customers, since it is impossible to know in detail every one of the customers but is possible to understand some clusters that represent patterns of demographic, transactional, locational and behavioral aspects, originating different consumption needs (Kotler, Wong, Saunders, & Armstrong, 2005). This concept allows companies to develop different products, prices and marketing campaigns for the different cluster (Kotler et al., 2005).
T
HE PATH OF BANKING THROUGH THE DIGITALDigital transformation has been transforming organizations, leading to new conditions as market volatility, customer’s increasing expectations about the quality of products and services, the impact of the Internet on the core business of an organization and consequentially, an increase in high-level jobs as managerial and professional positions requiring flexibility and problem-solving skills (Sousa & Rocha, 2018).
Banks are financial institutions that use money as their main product. The banking activity focuses on loans, deposits management and investments in capital markets, among others. The banking industry is the pillar of the economy since it helps maintaining record of the flow of money, being a subject of great interest for researchers in many areas such as management science, marketing, finance and
5 information technologies. Technological development seems to have a positive relation with productivity since it is used to build statistical models for risk and loans (Moro, Cortez, & Rita, 2015).
Banking has become an industry that aims for innovation by adopting information systems and technologies such as IT solutions in order to become more adaptative and proactive in the relationship with its customers (S. Agarwal, et al., 2018). It is important for the sake of the business progress to study this relationship by using customer’s information. This way some assumptions can be made, such as the relation between the default rate and the possession of a saving account (Puri, Rocholl, & Steffen, 2017). In addition to this, S. Agarwal, et al. (2018) state that if the customer has a perceived high default cost, even in difficult economic periods, they will avoid to enter default in their credits at all costs. Ercan & Sayaseng (2016) and Dias & Ramos (2014) conclude that foreign investment on the banks and time series of events are utterly important in the analysis because bank’s characteristics may change over the time and in an economically open world, they can turn into much like as foreign banks with different policies.
One of the hottest topics in banking these days is how to use all the data retrieved from transactions and demographic information from customers’ life-cycle (Railienė, 2014). Therefore, many banks started to analyze that data, in order to know their customers better, improving customer acquisition, retention, loyalty and profitability (Santouridis & Tsachtani, 2015). As (Soukal & Hedvicaková, 2011; Martins, 2012) state, this is an important step since there is a great percentage of active e-banking customers which even prefer internet over the branch and Automated Teller Machine (ATM) to perform their daily payments.
D
ATAM
INING(DM)
Data mining is defined as the execution of computing processes to discover hidden patterns in large datasets. These processes include methods related to machine learning, statistics and database systems. The results may include the identification of data records (cluster analysis), unusual records (anomaly detection), and dependencies (association rule mining, sequential pattern mining) (Han, Cheng, Xin, & Yan, 2007).
6 The computing processes in DM are mathematical and statistical algorithms, used to process large bulks of data for a specific purpose, these mining applications rely more on the quantity of data to create business value than the complexity of the algorithm applied. DM algorithms can use data available in Relational databases, data warehouses, transactional database, data streams, sensor data, social networks, multi-linked data, Multimedia database and text databases (Shmueli & Koppius, 2011).
The first clustering approaches were originally based on geographic data, since entities were segmented by their area of residence. Being followed by a segmentation by demographic data such as age, gender, income or occupation. In 1964, it was suggested a new approach where clustering methods should also include transaction data such as volume of sales since half of the customers can account for 80% of the sales, stating differences between the clusters (Miguéis et al., 2012).
Cluster analysis is an umbrella for several algorithms that aim to organize data into groups (clusters) which are groups of entities that share similarities between them (F Bação, Lobo, & Painho, 2004; Negnevitsky, 2017). This analysis’ uprising utility in companies’ Customer Relationship Management (CRM) explores unclassified data, reducing its dimension to an understandable level and being extremely useful for explanation and prediction of marketing phenomena (Hunt & Arnett, 2004; Bücker, 2016) and decision making such as tailor-made promotional polices to each segment that fill their needs (Adolfsson, Ackerman, & Brownstein, 2018; Miguéis et al., 2012), with the objective of maximizing the customer value to the company (Karahan & Kuzu, 2014).
Adolfsson et al. (2018) state that the cluster analysis presupposes the existence of a clustering structure and since clustering techniques tend to partition a dataset, it can induce to wrong conclusions. Therefore, it is important to verify if the data is clusterable or not. In spite of this, the clustering analysis is a well-accepted method throughout the world as an important component of companies’ market strategy and fundamental component of modern marketing (Hunt & Arnett, 2004).
7
Hierarchical Methods
Hierarchical clustering methods can be divided into agglomerative methods, which use a bottom-up approach and divisive methods which use a top-down approach (Rajalingam, 2011). In bottom-up agglomerative methods, all the observation are an independent cluster at the beginning and then these clusters start being merged with each other based on their distance which some authors consider “greedy” algorithms since it follows a sequence of irreversible steps while clustering the data (Murtagh & Contreras, 2017).
These agglomerative methods can be subdivided in two groups, the first containing linkage methods which are the single-linkage, complete-linkage and average-linkage and a second group that contains methods in which the cluster centers can be specified like the centroid and ward methods (Murtagh & Contreras, 2017).
This project focus on three hierarchical clustering methods:
• Ward method, which calculates the centroid for each cluster and at each step merges the two clusters with the minimum distance between them minimizing the within-cluster variance (Gelbard, Goldman, & Spiegler, 2007).
• Centroid method, which calculates the mean value for each variable to find the centroid of each cluster and the clusters with the closest centroids are merged (Gelbard et al., 2007).
• Average-linkage method, which calculates the mean of the distance between two clusters, creating clusters usually with low variance (Pavlopoulos et al., 2011).
8
K-Means
K-means is a popular segmentation algorithm that calculates cluster centers which converge to a local minimum of the objective function (Fernando Bação, Lobo, & Painho, 2005), agglomerating n objects into k clusters (Yin & Zhang, 2013). This technique cluster the data based on distance between observations and the centroid of each cluster by using the Euclidean distance as metric which is given (Ismkhan, 2018)
The most used method is the Random Partition method which randomly chooses K observations from the dataset using them as the initial centroids. This method first randomly assigns each observation to a cluster based on its Euclidean distance to the centroid, and then calculates the mean observation for each cluster and turn it the new centroid of the cluster (Hamerly & Elkan, 2002).
However, Yu, Chu, Wang, Chan, & Chang (2018) point that this method has some disadvantages such as:
• “The number of clusters must be predetermined. In many applications, however, it is difficult to predetermine the number of clusters;
• The random initial cluster centers will affect the clustering results;
• Is inadequate for clustering categorical data since describing them by value is difficult;
• Clustering results will be affected by noisy data and outliers;
• The influences of dimensional features are different in computing the distances of one datum and the cluster centers. Hence, applying appropriate weights for the data features is necessary;
• Different measurement units of data features and different distance functions adopted will affect the clustering results. Hence feature normalization is required;
9
Figure 1 - How K-means algorithm works
According to Arai & Ridho Barakbah (2007), the merging of the K-means algorithm for market segmentation was an improved solution when compared with a k-means algorithm with random seeds. In their study they used small amounts of data and tested 8 different methods, being the hierarchical K-means the best performing method. This is also confirmed by Lu, Tang, Tang & Yang (2008), after testing the performance of a hierarchical K-means method and stating that the performance of the proposed algorithm held better results than traditional methods. In 2014 also Murtagh & Legendre (2014) stated that using the ward method in order to minimize the variance inside the cluster and then use the k-means to improve the solution proves itself an efficient approach.
10
METHODOLOGY
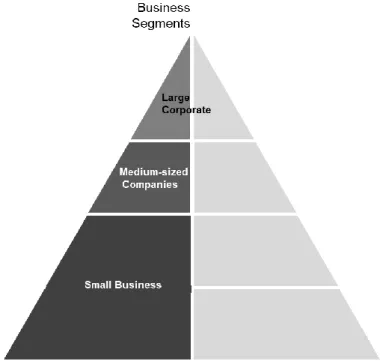
In order to understand the profile of the target customers it is necessary to understand how the hard segmentation works. For this project only the business customers are being segmented as seen in the figure below (Figure 2).
Figure 2 - Bank’s hard segmentation
The bank also has a sectorial segmentation that divides these customers in four groups: Business to Business (B2B), Business to Consumer (B2C), “Empresários em nome Individual”, which in English stands for Sole Proprietorship (EI), Other Organizations (OO) and Not Classified (NC).
In order to achieve this project’s goal, a descriptive model is being developed with the purpose of clustering these customers based on their banking activities into clusters which can tell the bank if it is the first choice of each customer or not.
NC customers are companies that operate in Portugal but do not belong to the Portuguese fiscal system, so they will not enter the segmentation process because there are several limitations to the products and services that the bank can’t offer
11 these customers since the banking system is strictly controlled by Banco de Portugal’s rules.
Along with NC customers, EI customers which behavior is much more similar to personal banking are not entering the segmentation model too. In order to understand these customers, EI are one with the company and all the data of the company, account, cards are also their own, which makes it impossible to cluster them along with the other business customers.
T
OOLSFor this cluster analysis, it is used SAS®. The methodology used in SAS® is
SEMMA, an acronym that stands for Sample, Explore, Modify, Model and Assess. It's a list of sequential steps developed by SAS Institute, one of the largest producers of statistics and business intelligence software. It guides the implementation of data mining applications. Although the SEMMA process is independent from de DM chosen tool, it is linked to the SAS software and pretends to guide the user on the implementations of DM applications (SAS Institute Inc., 2013). The SEMMA phases are:
1. Sample - This stage consists on sampling the data by extracting a portion of a large dataset big enough to contain the significant information, yet small enough to manipulate quickly. This phase also deals with data partitioning;
2. Explore - This phase covers the understanding of the data by discovering trends and anomalies in order to gain understanding of the relationships between the variables;
3. Modify - The Modify phase contains methods to select, create and transform variables in preparation for the model selection process;
4. Model - In the Model phase the focus is applying various techniques on the data by allowing the software to identify a combination that reliably predicts a desired outcome.
5. Assess - The last phase is Assess. The evaluation of the usefulness and reliability of the findings from the modelling and how it performs.
12 SEMMA offers an easy way to understand process, allowing an organized and adequate development and maintenance of DM projects. Thus, it confers a structure for conception, creation and evolution, helping to present solutions to business problems as well as to find de DM business goals.
V
ARIABLESThe variables for the segmentation that will be used are from the CRM’s Datamart tables which are updated in a mensal basis with all the information available from each customer and by recommendation of the bank, the following variables are to be tested in order to select the most fit to enter the model:
In order to choose the model’s input variables, it is necessary to describe the variables statistics and its’ distribution. This variables describe the various types of products and services the bank provides to its business customers such as value and number of products as loans, credit cards, savings and investments and the relation between the bank and these customers such as how many years the customer has been customer of the bank, the number of logins in the digital channels like the mobile application and the site and the number and value of transactions of each customer’s account. In the end, the variables with the best performance and worth will be chosen to be part of the model
Due to banking secrecy rules, all the data in this project (Appendix 1) is standardized since it cannot be of public access. The data in this project is standardized using Z-Score, a method that uses the mean and the standard deviation in order to standardize the data. The formula for Z-Score is described as the difference between the point value minus the mean divided by the standard deviation as seen below:
𝒵
𝔦=
𝒳
𝒾− 𝒳
̅
𝒮
13 When analyzing business customers’ data is important to understand that this diversity comes from almost all variables (since there are customers such as small coffee shops on one side and huge malls and tech giants on the other) and if outliers were to be removed by common methods such as box plots, half or more of the observations would be removed. So instead of removing outliers using a regular approach, it was chosen a different approach.
Regarding the Ordinal variables, having just one and no nominal variables that the bank considers utterly important, the risk level of the customer is only used in a posterior correlation analysis with the clusters. However, it is important to see the distribution of this variable since it is a core variable to the business model.
The risk level of a customer (Appendix 2) goes from 1 to 19 where 1 is for sovereign risks (e.g. Countries or sovereign public entities), 12 for the max risk level and from 13 to 19 is only for customers which are already in default.
A
NALYTICALB
ASET
ABLE(ABT)
An ABT is the table that serves as base for the model and is built having the selected variables from the various tables where customer data is stored. To build this ABT, it is gathered information from several tables with different information and joined in a single one.
Although the model is not using all the variables, it is the company’s choice to create this initial table with all the variables in order to use them if not in the model, in a post-modeling relation analysis that sees if the clusters obtained have some kind of relation to this variables which bring important business information to the bank’s business model.
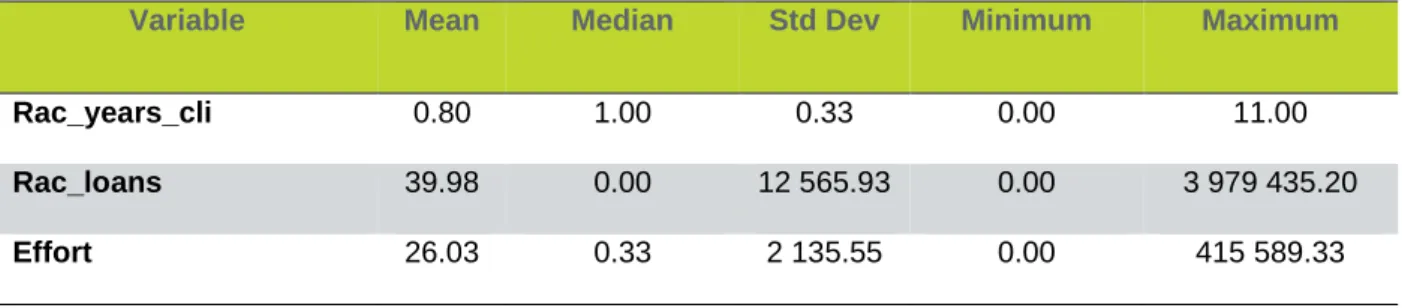
During the creation of the ABT, there were tested several new variables, having been kept three of them.
14
Table 1 - New variables
Variable Formula
Rac_years_cli (Years as client / Company’s age)
Rac_loans (Loans / Overall loans in Portugal)
Effort (Value of account debits / Value of account credits)
Table 2 - New variables’ statistics
Variable Mean Median Std Dev Minimum Maximum
Rac_years_cli 0.80 1.00 0.33 0.00 11.00
Rac_loans 39.98 0.00 12 565.93 0.00 3 979 435.20
Effort 26.03 0.33 2 135.55 0.00 415 589.33
C
LUSTERA
NALYSIS FORO
UTLIERS’
R
EMOVALLike stated before, a usual outlier’s removal was not possible in this project since business customers unlike personal customers don’t tend to follow a normal distribution where the major part of the sample is middle class and there are much fewer rich or poor people. In business customers the distribution is far from normal, in fact, in these customers there is a strong relation between the company’s size and the volume of that company’s data.
In order to remove the outliers from the database a series of k-means clustering processes were run, and in each k-means the clusters with fewer customers were removed as outliers. This process was iterated three times before the sample became less sparse and ready to begin the actual clustering process:
On the first iteration only the cluster 5 was kept and from the 100,289 customers in the ABT 100,264 customers remained, having all the others been dropped summing a total of 25 customers.
15
Table 3 - Outlier removal first iteration Cluster Frequency RMS Std Deviation Maximum Distance from Seed to Observation Nearest Cluster Distance Between Cluster Centroids 1 1 0 5 191.30 2 1 0 5 284.30 3 7 10.96 33.99 5 95.46 4 2 8.99 15.56 6 100.50 5 100,264 0.62 58.12 6 61.05 6 12 17.12 84.78 5 61.05 7 1 0 5 113.60 8 1 0 7 152.70
On the second iteration the 5th and the 7th clusters have been kept with 99,726
customers, having all the others been dropped representing 538 customers summing a total of 563 where included the previous excluded 25 customers.
Table 4 - Outlier removal second iteration Cluster Frequency RMS Std Deviation Maximum Distance from Seed to Observation Nearest Cluster Distance Between Cluster Centroids 1 32 3.21 21.47 7 11.19 2 250 2.61 49.86 7 7.86 3 17 3.45 11.95 7 13.83 4 12 4.95 20.93 6 23.69 5 63,916 0.32 7.04 7 1.72 6 154 2.18 14.46 7 8.50 7 35,810 0.47 8.48 5 1.72 8 73 2.75 21.48 7 10.31
16 On the third iteration the 1st, the 4th and the 6th clusters have been kept with
98,504 customers, having all the others been dropped representing 1,222 customers summing a total of 1,785 where included the previous excluded 563 customers. These 1,785 excluded customers representing 1,77% of the main data, are to be integrated in the clusters in a later stage through a predictive decision tree.
Table 5 - Outlier removal third iteration Cluster Frequency RMS Std Deviation Maximum Distance from Seed to Observation Nearest Cluster Distance Between Cluster Centroids 1 14,878 0.40 4.20 6 1.53 2 39 0.81 3.79 8 2.83 3 126 0.87 4.46 4 2.56 4 27,987 0.36 6.28 1 1.69 5 1,026 0.82 5.92 1 1.93 6 55,639 0.24 4.19 1 1.53 7 2 0.63 1.09 2 7.47 8 29 1.15 4.55 2 2.83
F
ACTORA
NALYSISAs the ABT has 35 variables, a decision of which variables to use in the model must be taken, so in order to maintain the maximum information possible it was decided to use a Factor Analysis.
The Factor Analysis is a dimensional reduction technique that usually uses a two-step procedure. The first two-step consists in extracting factors of an unrotated matrix while the second step consists in applying an oblique or orthogonal rotation to this matrix in order to improve its interpretability. While in oblique rotation factors can be correlated, in orthogonal rotation they are uncorrelated with each other. The most common factor rotation methods used in factor analysis are varimax, CF-quartimax, geomin, and target rotation (Zhang et al., 2019).
17 For this project’s factor analysis, the chosen method is a factor analysis in principal components with orthogonal varimax rotation in order to be easier to identify each variable’s presence through the factors.
The factor analysis always outputs the number of factors that have served as inputs, so it is important to choose how many factors are being kept based on how much variance will be lost in spite of how much interpretability will be gained. In this project were kept 6 factors (APPENDIX 3), Loans and Value of Transactions, Assets balance and commissions, Age and Seniority, Quantity of Transactions, Products and Credit Card and Utilities, all being well represented by its variables and with relatively high communality, maintaining near 80% of the ABT’s variance.
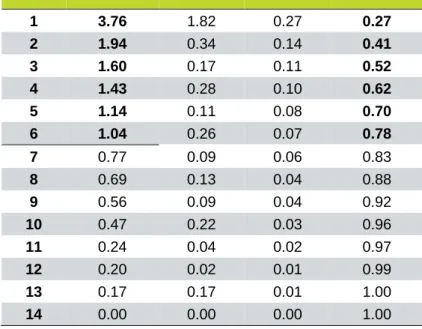
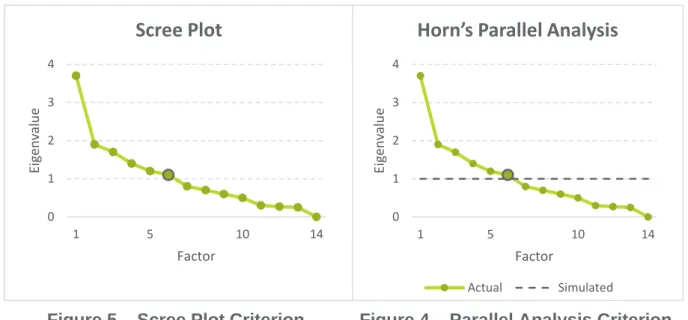
To decide how many factors are being kept, there are three criterions that are usually used. By the Kaiser Criterion (Table 5), all the factors with an eigenvalue below one should be dropped. The Scree Plot Criterion (Figure 4) is a much more visual one and uses the elbow rule. And the Horn’s Parallel Analysis (Figure 5) that compares the actual eigenvalues of the database with the eigenvalues simulated by a matrix from a random sample of that database. Therefore, by these three rules, only 6 factors are being kept.
Table 6 – Kaiser and Pearson’s criteria Factors Eigenvalue Difference Proportion Cumulative
1 3.76 1.82 0.27 0.27 2 1.94 0.34 0.14 0.41 3 1.60 0.17 0.11 0.52 4 1.43 0.28 0.10 0.62 5 1.14 0.11 0.08 0.70 6 1.04 0.26 0.07 0.78 7 0.77 0.09 0.06 0.83 8 0.69 0.13 0.04 0.88 9 0.56 0.09 0.04 0.92 10 0.47 0.22 0.03 0.96 11 0.24 0.04 0.02 0.97 12 0.20 0.02 0.01 0.99 13 0.17 0.17 0.01 1.00 14 0.00 0.00 0.00 1.00
18
C
LUSTERA
NALYSIS FORS
EGMENTATIONIn this part of the project, and in order to find patterns through data to know for which companies the bank is the first bank, were tested 4 methods of clustering. Using the K-means method with random seeds as base method, it served to control and compare with the other methods.
As the methods to test against random seeds K-means, were chosen three hierarchical methods that calculated the initial seeds for the K-means algorithm. In fact, although the original idea was to test the random seeds K-means against five predefined seeds K-means, there was no computation power for Single-linkage and Complete-linkage, so they stood out of the test and thus, only Ward, Centroid and Average-linkage were tested.
To find the number of clusters was used the R2 of the random seeds K-means
method, through 9 iterations from 10 to 2 clusters and built an elbow graphic (Figure 4) which concludes that both 4 or 6 clusters would be a good decision to go on with. It was decided to choose 4 clusters as it was the best choice when fitting the model to the business needs. For the other methods and in order to get a better comparison state, 4 clusters were chosen for each one.
Figure 5 – Scree Plot Criterion 0 1 2 3 4 1 5 10 14 Eig en valu e Factor
Scree Plot
0 1 2 3 4 1 5 10 14 Eige n valu e FactorHorn’s Parallel Analysis
Actual Simulated
19
Figure 6 – Elbow Graphic supporting the number of clusters chosen
For the evaluation of the cluster’s quality it was used the Wilcoxon test to check if the clusters in each method are significantly different from each other. This test was applied to all the methods between every cluster (e.g. Cluster 1 vs Cluster 2, Cluster 1 vs Cluster 3 and so on). To perform this test, the chosen variables to analyze are the six factors that are being used in all the clustering methods.
0 0,1 0,2 0,3 0,4 0,5 2 3 4 5 6 7 8 9 10
Elbow Graphic
20
RESULTS AND DISCUSSION
Being the aim of this project to find if the bank is the first bank of each customer, it was developed a series of events that led to the creation of 4 clusters. Each one of these 4 clusters represent a type of customer based on its banking activity with the bank.
To develop this cluster analysis, it was tested a merging technique that combines the K-means algorithm with predefined seeds using hierarchical algorithms vs the K-means with random seeds. These algorithms are the Ward algorithm, the Centroid algorithm and the Average-Linkage algorithm.
When evaluating the cluster results there were two evaluation criteria. The main evaluation criterion was the insight from the bank about how the results fitted the business model, and the second criterion used was the Wilcoxon test in order to check if the clusters were significantly different from each other.
Regarding to Wilcoxon test, the p-value (or probability value) lower than 0,05 is being used to reject the null hypothesis and thus concluding that the clusters are significantly different in each analyzed variable. The results below present the values of an exact p-value for Wilcoxon test.
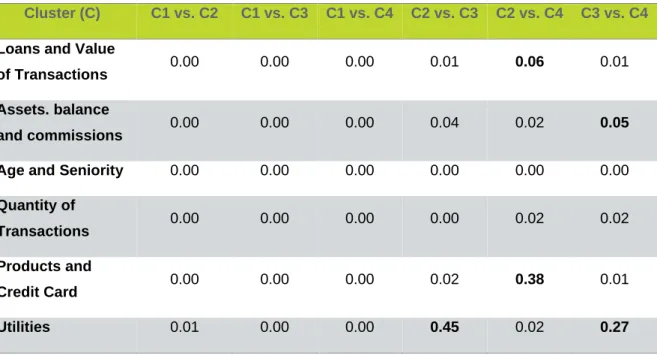
Table 7 – K-Means random seeds Wilcoxon test (p-values)
Cluster (C) C1 vs. C2 C1 vs. C3 C1 vs. C4 C2 vs. C3 C2 vs. C4 C3 vs. C4
Loans and Value
of Transactions 0.00 0.00 0.00 0.01 0.06 0.01
Assets. balance
and commissions 0.00 0.00 0.00 0.04 0.02 0.05
Age and Seniority 0.00 0.00 0.00 0.00 0.00 0.00
Quantity of
Transactions 0.00 0.00 0.00 0.00 0.02 0.02
Products and
Credit Card 0.00 0.00 0.00 0.02 0.38 0.01
21 The K-means random seeds method’s results state that all the clusters are statistically significantly different, despite having variables with some resemblance through the clusters. For this model the factor with most difference through the clusters is the quantity of transactions which is one of the most important variables to evaluate the customers’ activity according to the bank’s business model.
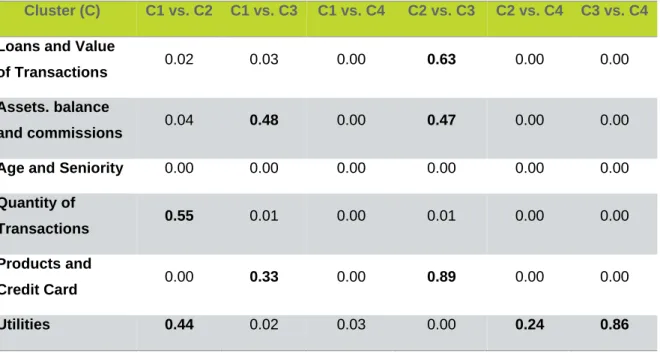
Table 8 – K-Means initialized with Ward seeds - Wilcoxon test (p-values) Cluster (C) C1 vs. C2 C1 vs. C3 C1 vs. C4 C2 vs. C3 C2 vs. C4 C3 vs. C4
Loans and Value
of Transactions 0.02 0.03 0.00 0.63 0.00 0.00
Assets. balance
and commissions 0.04 0.48 0.00 0.47 0.00 0.00
Age and Seniority 0.00 0.00 0.00 0.00 0.00 0.00
Quantity of
Transactions 0.55 0.01 0.00 0.01 0.00 0.00
Products and
Credit Card 0.00 0.33 0.00 0.89 0.00 0.00
Utilities 0.44 0.02 0.03 0.00 0.24 0.86
The K-means Ward seeds method’s results are the most similar to the random seeds model and state that overall the clusters are statistically significantly different, however the clusters 2 and 3 have some variables with high p-values which indicates that those variables are nearly equal in both clusters. For this model the variable with most difference through the clusters is the Age and Seniority and the Utilities has the most resemblance through the clusters.
22
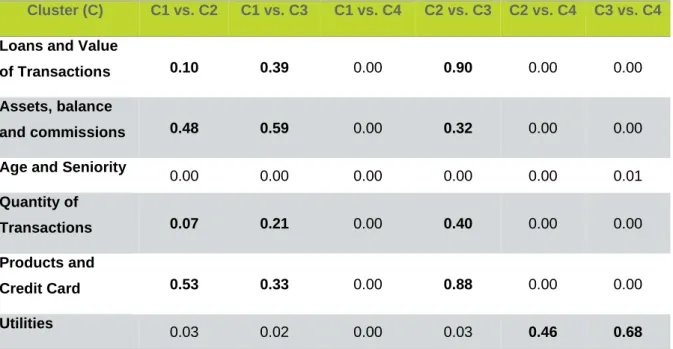
Table 9 – K-Means initialized with Centroid seeds - Wilcoxon test (p-values) Cluster (C) C1 vs. C2 C1 vs. C3 C1 vs. C4 C2 vs. C3 C2 vs. C4 C3 vs. C4
Loans and Value
of Transactions 0.10 0.39 0.00 0.90 0.00 0.00
Assets, balance
and commissions 0.48 0.59 0.00 0.32 0.00 0.00
Age and Seniority
0.00 0.00 0.00 0.00 0.00 0.01 Quantity of Transactions 0.07 0.21 0.00 0.40 0.00 0.00 Products and Credit Card 0.53 0.33 0.00 0.88 0.00 0.00 Utilities 0.03 0.02 0.00 0.03 0.46 0.68
The K-means Centroid seeds method’s results state that almost none of the clusters are statistically significantly different, except for cluster 4 which in general seem statistically significantly different from the other clusters. In this model the p-values are mostly high between clusters 1, 2 and 3, which means that these clusters resemble each other in almost all the variables.
Table 10 – K-Means initialized with Average-Linkage seeds - Wilcoxon test (p-values)
Cluster (C) C1 vs. C2 C1 vs. C3 C1 vs. C4 C2 vs. C3 C2 vs. C4 C3 vs. C4
Loans and Value
of Transactions 0.35 0.05 0.00 0.26 0.00 0.00
Assets. balance
and commissions 0.19 0.19 0.01 0.09 0.00 0.00
Age and Seniority 0.00 0.00 0.00 0.00 0.00 0.00
Quantity of
Transactions 0.56 0.00 0.02 0.00 0.00 0.00
Products and
Credit Card 0.31 0.11 0.00 0.27 0.00 0.00
23 The K-means Average-Linkage seeds method’s results state that overall only cluster 4 is statistically significantly different from the others, being the utilities variable its only resemblance with the other clusters. This model also shows that cluster 1, 2 and 3 are not statistically significantly different, however their p-values are not so high as in the centroid method.
Based on the results from the Wilcoxon test, the K-means with random seeds model has the lower p-values between its clusters and the K-means with Centroid algorithm’s predefined seeds has the higher p-values between its clusters.
Each one of these 4 clusters represent a type of customer of the bank, being distributed in a way that cluster 1 represents 12%, cluster 2 represents 14%, cluster 3 represents 46% and the cluster 4 represents 28% of the bank’s business customers.
Figure 7 – Clusters’ division
12% 14% 46% 28% Cluster 1 Cluster 2 Cluster 3 Cluster 4
24
Cluster 1 (Loyals)
Loyals contain 12,127 customers which are mostly small companies with low assets, low value transactions and loans, but with a quantity of transactions and products above the general distribution. These companies also have a long relationship with the bank, being its customers since they were created.
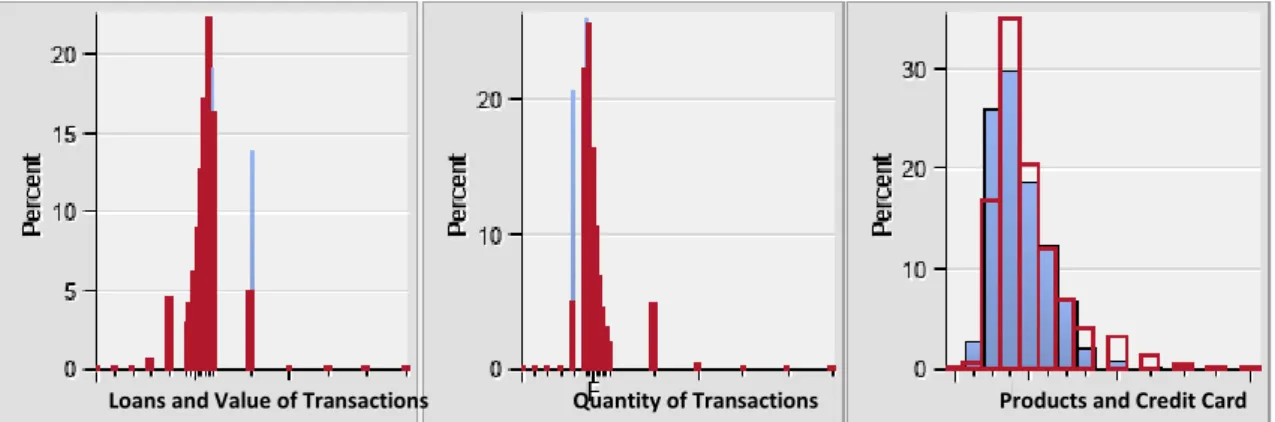
Figure 8 – Cluster 1 activity variables
Cluster 2 (Minglers)
Minglers contain 14,012 customers which are mostly medium size corporations and large corporations with high assets, high value transactions and loans, but with a quantity of transactions below the general distribution and quantity of products slightly below the general distribution. These companies are mostly mature companies with large scale production and have a long relationship with the bank.
Figure 9 – Cluster 2 activity variables
s and Value of Trans action s
Loans and Value of Transactions Quantity of Transactions Products and Credit Card
s and Value of Trans action s
25
Cluster 3 (Challengers)
The Challengers contain 44,673 customers and is characterized by low value transactions and loans, low quantity of transactions and products below the general distribution. This companies also have a more volatile behavior with the bank, being recent customers or customers which left the bank and returned, or just customers which have their accounts open but do not use them.
Figure 10 – Cluster 3 activity variables
Cluster 4 (Believers)
The Believers contain 27,692 customers which are mostly companies with moderate high assets, high value transactions and loans, but with a quantity of transactions and products slightly below the mean. These companies are young companies that open recently and are recent customers in the bank.
Figure 11 – Cluster 4 activity variables
s and Value of Trans action s
Loans and Value of Transactions Quantity of Transactions Products and Credit Card
s and Value of Trans action s
26 This market segmentation is the basis for a better understanding of the customers’ behavior since it provides knowledge of their relationship with the bank. This is utterly important because what was a marketing strategy for all the customers are now four marketing strategies, each one aligned with the customers’ behavior and with the business model. Therefore, the bank can easily reach its customer’s in a way that can make retention policies to one cluster, customer acquisition for other, and so on.
Loyals are companies that have walked beside the bank for many years and they expect to see that reflected when the bank offers them its products. Thus, the bank could invest in the creation of a retention policy which awards these customers with financial advice along with valuable investment products and discounts in the credit rates.
On the other hand, Minglers which have high dimensions are a difficult cluster to work with. Usually these companies already have the products they need, have loans spread across the banking system as well as investments, which turns it difficult to sell new products given their bargaining power. However, these customers are receptive to efficient services like immediate transactions, accounting services, which could be a secure field for the bank to invest, since these services do not increase market exposure.
Challengers, as the name implies, are the major focus of the bank since they could be a huge source of commissions and interest rates that are currently being given to other banks. For these companies the bank could invest in acquisition campaigns with lower commissions or competitive rates to inactive customers that transfer their daily services to the bank.
Believers, since they are young companies, it would be interesting to bet on them through offering special conditions on loans or work on an association with a crowdfunding platform in order to improve the company’s productions and thus its value. These customers are recent to the bank, and depending on the marketing strategy applied, if they find their necessities fulfilled and acquire all the core products in the bank, they are probably becoming Loyals in the future.
27
Outlier Inclusion
Having the cluster analysis completed and the best model chosen, the only process left is to insert the 1785 outliers that were removed in the clusters so they can be targeted in the marketing campaigns as well.
In order to cluster these outliers, it is used SAS Enterprise Miner to build a predictive model based on a decision tree that distributes the outliers into the most suitable cluster. This decision tree uses the clusters as target variable and the six base factors as input variables for the prediction.
Figure 13 – Decision Tree to segment outliers Figure 12 – Outliers’ inclusion process
28 The first step is to partition the data into train, validation and test set. For this partition it is used a 60% of the data set for the train set, 30% of the data set for the validation set and 10% of the data set as test set.
After the partition, a decision tree node is added and run several times with different parameters. The best results come from a tree with Variance interval splitting rule (there are no ordinal or nominal variables in the input variables), maximum branch of 2 and maximum depth of 5 levels. Adding a Model Comparison node to the diagram, it was chosen to use the Roc and Gini indexes to evaluate the model’s quality as reported in the table 9.
Table 11 – Decision Tree evaluation indexes
Set Roc Gini
Train 0.89 0.77
Validation 0.89 0.76
Test 0.89 0.77
Ready to include the outliers, there is added the score node and the outliers were inserted into the previously created clusters.
29
CONCLUSIONS
Since there are very few studies that test the application of non-hierarchical algorithms after hierarchical algorithms on a dataset, it is difficult to compare the results of this study with the results of previous ones. Therefore, this project aims to help filling that gap and present scientific results of this comparison.
According to the results of the Wilcoxon test, the K-means algorithm with random seeds shows better results than the K-means algorithm run with seeds predefined by the hierarchical clustering algorithms.
Although the random seeds model presents better results, the results presented by the model with the seeds predefined by the Ward’s algorithm are substantially better than the results presented by the other hierarchical algorithms not being too much lower than the best model (random seeds).
Regarding to the cluster profiling results, Loyals which have 12% of the customer’s base are defined by a high banking activity, with high transactional values, loans, products and utilities. This cluster is also defined by a high share of wallet in both credit and treasury, which concludes that these customers use the bank as the first bank in their daily routine.
Minglers on the other hand, having 14% of the customer’s base are a cluster that contains medium size and large corporations and due to that reason, their banking utilization is scattered across several banks. This is actually beneficial for the bank and for these companies since it is not of the bank interest to be the only bank of these companies in order to split the risk and exposure. Minglers are also defined by a medium share of wallet in both credit and treasury, concluding that for these customers there is probably not a first bank, because by splitting their assets and loans, they also split the risk and increase their bargaining power.
Challengers which have 46% of the customer’s base are defined by low transaction values and quantity, low products’ acquisition and for being recent customers. Also, these customers show a low share of wallet in both credit and treasury and are extremely volatile, being customers that are new to the bank or customers that closed their accounts and returned recently but with low activity. This
30 concludes that the bank is clearly not the first bank for these customers and that this cluster is an opportunity to search deeper into their characteristics and develop a marketing strategy in order to improve this relationship.
Believers contain 28% of the customers’ base and are defined by high transactional values and loans, low quantity of transactions and moderate products’ acquisition. These customers are young and recent to the bank and they are still implementing themselves on their target market. Regarding to their share of wallet, both credit and treasury are high which leads to the conclusion that the bank is the first bank of these customers and since they are young companies, it is important to present them accurate products to improve their growth and thus maintaining the bank as their first bank.
To conclude:
• For Loyals and Believers the bank is the customers’ first bank.
• For Minglers there is no first bank because their banking activity is scattered.
• For Challengers the bank is not their first choice, which is an opportunity to new marketing approaches.
Being this an internship report, it is utterly important to discuss the practical implementations of its results. This clustering project brought to the bank a whole new vision when speaking of CRM because it turned possible to look at these customers as groups with similar behavior instead of just looking at their assets and loans.
This clustering algorithm is being run weekly and providing segmentation results for the business marketing direction. These results are being used to launch more customer centric CRM approaches where instead of being based on the traditional product driven marketing campaigns, these approaches are now based on the customer needs being customer driven marketing campaigns. For instance, before the segmentation, the bank launched campaigns for all business customers without any specific rule, but now each cluster is targeted by specific campaigns (eg. Loyals and Believers are being targeted for ongoing retention campaigns, Minglers for
31 service acquiring campaigns and Challengers are the main focus to the bank, being targeted for discount, offer and acquisition campaigns with competitive prices in order to improve the engagement of these companies with the bank).
32
LIMITATIONS AND RECOMMENDATIONS FOR FUTURE WORKS
L
IMITATIONSAlthough this project had several limitations, none of them was a major impeditive to its development. However, being a business segmentation revealed itself more challenging because the understanding of the data and the state of art is harder than when dealing with personal customers.
The major technical limitation of this work was the lack of computation power, which limited the study to three hierarchical methods, since Single-Linkage and Complete-Linkage methods were abandoned due to this reason.
Another limitation was due to bank secrecy, which turned impossible to directly share information about variables and how the results fit the business model in this project. It is important to state that some of these are legal limitations that are imposed by law and not by the bank.
The only limitations imposed by the bank were that the results must be all standardized, the business model must not be exposed, and the marketing strategy must not be shared along with the clustering results. This last limitation was the only that really limited the sharing of results in this project because it was impossible to explain the cluster’s profile as well as its practical application on the bank.
F
UTUREW
ORKSFor future work, there are interesting topics that can be developed which would be a great improvement for this study:
• There are very few studies that test the application of non-hierarchical algorithms after hierarchical algorithms on a dataset, which can be an opportunity to reach deeper results in this theme.
• Since in this project only three hierarchical algorithms were tested, it would be important to test more hierarchical methods for seed generation with a better computation power.
33 • In fact, another interesting alternative is to test these hierarchical methods but with a different non-hierarchical method to test if the results are similar to their merging with the K-means method.
• To conclude, there is not much good quality information about companies as it is about personal banking customers, so it would be a major improvement to gather more information about these customers such as social benefit projects, employees ages, average salaries.
34
BIBLIOGRAPHY
Adolfsson, A., Ackerman, M., & Brownstein, N. C. (2018). To Cluster, or Not to Cluster: An Analysis of Clusterability Methods. Pattern Recognition, 88, 13–26. https://doi.org/10.1016/j.patcog.2018.10.026
Agarwal, S., Chomsisengphet, S., Liu, C., Song, C., & Souleles, N. S. (2018). Benefits of relationship banking: Evidence from consumer credit markets. Journal of Monetary Economics, 96, 16–32.
https://doi.org/10.1016/j.jmoneco.2018.02.005
Arai, K., & Ridho Barakbah, A. (2007). Hierarchical K-means: an algorithm for centroids initialization for K-means. In Rep. Fac. Sci. Engrg. Reports of the Faculty of Science and Engineering.
Athanassopoulos, A. D. (2000). Customer satisfaction cues to support market segmentation and explain switching behavior. Journal of Business Research. https://doi.org/10.1016/S0148-2963(98)00060-5
Bação, F, Lobo, V., & Painho, M. (2004). Clustering census data: comparing the performance of self-organising maps and k-means algorithms. … : Knowledge-Based Services for the Public …, (December 2015). Retrieved from
http://www.isegi.unl.pt/labnt/geosom/Public/o8-2_11_lobo04_som_kmeans_kdnet.pdf
Bação, Fernando, Lobo, V., & Painho, M. (2005). Self-organizing Maps as Substitutes for K-Means Clustering. 476–483.
https://doi.org/10.1007/11428862_65
Dias, J. G., & Ramos, S. B. (2014). The aftermath of the subprime crisis: A clustering analysis of world banking sector. Review of Quantitative Finance and
Accounting, 42(2), 293–308. https://doi.org/10.1007/s11156-013-0342-3 Ercan, H., & Sayaseng, S. (2016). The cluster analysis of the banking sector in
Europe. 111–127.
Gelbard, R., Goldman, O., & Spiegler, I. (2007). Investigating diversity of clustering methods: An empirical comparison. Data and Knowledge Engineering.
35 https://doi.org/10.1016/j.datak.2007.01.002
Hamerly, G., & Elkan, C. (2002). Alternatives to the k-means algorithm that find better clusterings. Proceedings of the Eleventh International Conference on Information and Knowledge Management - CIKM ’02, 600.
https://doi.org/10.1145/584887.584890
Han, J., Cheng, H., Xin, D., & Yan, X. (2007). Frequent pattern mining: Current status and future directions. Data Mining and Knowledge Discovery.
https://doi.org/10.1007/s10618-006-0059-1
Hunt, S. D., & Arnett, D. B. (2004). Market segmentation strategy, competitive advantage, and public policy: Grounding segmentation strategy in resource-advantage theory. Australasian Marketing Journal, 12(1), 7–25.
https://doi.org/10.1016/S1441-3582(04)70083-X
Ismkhan, H. (2018). I-k-means−+: An iterative clustering algorithm based on an enhanced version of the k-means. Pattern Recognition, 79, 402–413. https://doi.org/10.1016/j.patcog.2018.02.015
Karahan, M., & Kuzu, Ö. H. (2014). Evaluating of CRM in Banking Sector: A Case Study on Employees of Banks in Konya. Procedia - Social and Behavioral Sciences, 109, 6–10. https://doi.org/10.1016/j.sbspro.2013.12.412
Kotler, P., Wong, V., Saunders, J., & Armstrong, G. (2005). Principles of Marketing (4th edition). In Long Range Planning.
https://doi.org/10.1017/CBO9781107415324.004
Leverin, A., & Liljander, V. (2006). Does relationship marketing improve customer relationship satisfaction and loyalty? International Journal of Bank Marketing. https://doi.org/10.1108/02652320610671333
Lu, J. F., Tang, J. B., Tang, Z. M., & Yang, J. Y. (2008). Hierarchical initialization approach for K-Means clustering. Pattern Recognition Letters.
https://doi.org/10.1016/j.patrec.2007.12.009
Martins, A. C. B. (2012). Understanding the Internet Banking Adoption by Portuguese Customers: a Unified Theory of Acceptance and Use of Technology and
Perceived Risk Application.
36 for lifestyle segmentation. Expert Systems with Applications.
https://doi.org/10.1016/j.eswa.2012.02.133
Moro, S., Cortez, P., & Rita, P. (2015). Business intelligence in banking: A literature analysis from 2002 to 2013 using text mining and latent Dirichlet allocation. Expert Systems with Applications, 42(3), 1314–1324.
https://doi.org/10.1016/j.eswa.2014.09.024
Murtagh, F., & Contreras, P. (2017). Algorithms for hierarchical clustering: an overview, II. WIREs: Data Mining & Knowledge Discovery.
Murtagh, F., & Legendre, P. (2014). Ward’s Hierarchical Agglomerative Clustering Method: Which Algorithms Implement Ward’s Criterion? Journal of Classification. https://doi.org/10.1007/s00357-014-9161-z
Negnevitsky, M. (2017). Identification of failing banks using Clustering with self-organising neural networks. Procedia Computer Science, 108(June), 1327– 1333. https://doi.org/10.1016/j.procs.2017.05.125
Pavlopoulos, G. A., Secrier, M., Moschopoulos, C. N., Soldatos, T. G., Kossida, S., Aerts, J., … Bagos, P. G. (2011). Using graph theory to analyze biological networks. BioData Mining. https://doi.org/10.1186/1756-0381-4-10
Puri, M., Rocholl, J., & Steffen, S. (2017). What do a million observations have to say about loan defaults? Opening the black box of relationships. Journal of Financial Intermediation, 31, 1–15. https://doi.org/10.1016/j.jfi.2017.02.001
Railienė, G. (2014). The use of IT in relationship banking. Procedia - Social and Behavioral Sciences, 156(April), 569–574.
https://doi.org/10.1016/j.sbspro.2014.11.242
Rajalingam, N. (2011). Hierarchical Clustering Algorithm - A Comparative Study. International Journal of Computer Applications, 19(3), 42–46.
Santouridis, I., & Tsachtani, E. (2015). Investigating the Impact of CRM Resources on CRM Processes: A Customer Life-cycle Based Approach in the Case of a Greek Bank. Procedia Economics and Finance, 19(15), 304–313.
https://doi.org/10.1016/S2212-5671(15)00031-3
SAS Institute Inc. (2013). Data Mining Using SAS ® Enterprise Miner TM : A Case Study Approach, Third Edition. In Development.
37 Shmueli, G., & Koppius, O. (2011). Predictive Analytics in Information Systems
Research. MIS Quarterly, 35(3), 553–572. https://doi.org/10.2139/ssrn.1606674 Smith, W. R. (1956). Product Differentiation and Market Segmentation as Alternative
Marketing Strategies. Journal of Marketing. https://doi.org/10.2307/1247695 Soukal, I., & Hedvicaková, M. (2011). Retail core banking services e-banking client
cluster identification. Procedia Computer Science, 3, 1205–1210. https://doi.org/10.1016/j.procs.2010.12.195
Sousa, M. J., & Rocha, Á. (2018). Digital learning: Developing skills for digital
transformation of organizations. Future Generation Computer Systems, 91, 327– 334. https://doi.org/10.1016/j.future.2018.08.048
Yin, X., & Zhang, Y. (2013). Equally contributory privacy-preserving k-means clustering over vertically partitioned data. Information Systems, 38(1), 97–107. https://doi.org/10.1016/j.is.2012.06.001
Yu, S. S., Chu, S. W., Wang, C. M., Chan, Y. K., & Chang, T. C. (2018). Two improved k-means algorithms. Applied Soft Computing Journal, 68, 747–755. https://doi.org/10.1016/j.asoc.2017.08.032
Zeithaml, V. A., Rust, R. T., & Lemon, K. N. (2001). The customer pyramid: Creating and serving profitable customers. California Management Review.
https://doi.org/10.2307/41166104
Zhang, G., Preacher, K. J., Hattori, M., Jiang, G., & Trichtinger, L. A. (2019). A Sandwich Standard Error Estimator for Exploratory Factor Analysis With Nonnormal Data and Imperfect Models. Applied Psychological Measurement, 43(5), 360–373. https://doi.org/10.1177/0146621618798669
38
APPENDIX
A
PPENDIX1
-
I
NTERVAL VARIABLES’
STATISTICS(
STANDARDIZED)
Variable Median Mode Minimum Maximum 1st Pctl 99th Pctl Number of products 0.16 0.76 -1.36 76.55 -1.06 3.15 Assets 0.01 0.01 0.01 298.98 0.01 0.03 Investments 0.01 0.01 0.01 292.22 0.01 0.01 Savings 0.02 0.02 0.02 210.85 0.02 0.17 Products’ commissions 0.05 0.06 -4.26 205.92 0.06 0.63 Rentability 0.01 0.02 -80.33 242.58 0.02 0.14 Account solutions 0.53 0.53 0.89 61.71 0.89 1.95 Value of insurances 0.20 0.20 0.20 92.14 0.20 3.08 Number of insurances 0.11 0.11 0.11 249.05 0.11 1.09 Utilities (Value) 0.06 0.06 0.06 162.72 0.06 0.67 Utilities (quantity) 0.16 0.16 0.16 179.41 0.16 1.22 Logins on the app and site 0.28 0.36 0.36 62.35 0.36 3.80 Credit card ceiling 0.18 0.18 0.29 208.55 0.18 2.00 Credit cards transactions 0.07 0.07 -1.45 249.95 0.07 1.02 Quantity of account debits 0.10 0.21 0.21 161.27 0.21 1.10 Value of account debits 0.02 0.02 0.02 200.83 0.02 0.14 Value of account credits 0.06 0.08 0.08 164.00 0.08 0.76 Quantity of account credits 0.02 0.02 0.02 200.57 0.02 0.14 Payment of salaries (Quantity) 0.05 0.05 0.05 182.83 0.05 0.65 Payment of salaries (Value) 0.03 0.03 0.03 277.95 0.03 0.37 Account’s average balance 0.04 0.04 -30.21 177.63 0.04 0.54 Social capital 0.03 0.03 0.03 180.27 0.03 0.26 Number of employees 0.07 0.09 0.09 129.13 0.09 1.00 Sales amount 0.05 0.05 0.05 178.77 0.05 0.61 Overall liabilities 0.03 0.03 0.04 194.89 0.03 0.28 Overall assets 0.05 0.05 0.07 179.25 0.05 0.61 Loans 0.02 0.02 0.02 299.10 0.02 0.25 Overall loans in Portugal 0.05 0.05 0.05 232.87 0.05 0.77 Company’s age 0.23 0.96 -1.02 12.37 -1.02 3.75 Years as client 0.18 -1.11 -1.20 9.86 -1.20 2.70
39
A
PPENDIX2
-
O
RDINAL VARIABLES’
FREQUENCYClient’s risk level Frequency Percent Cumulative Frequency Cumulative Percent 1 8 0.01 8 0.01 2 1,464 1.06 1,472 1.07 3 11,904 8.63 13,376 9.70 4 18,522 13.43 31,898 23.13 5 18,991 13.77 50,889 36.89 6 15,630 11.33 66,519 48.22 7 12,881 9.34 79,400 57.56 8 12,173 8.83 91,573 66.39 9 10,800 7.83 102,373 74.22 10 5,426 3.93 107,799 78.15 11 2,724 1.97 110,523 80.13 12 23,555 17.08 134,078 97.20 13 57 0.04 134,135 97.24 14 675 0.49 134,810 97.73 15 958 0.69 135,768 98.43 16 320 0.23 136,088 98.66 17 15 0.01 136,103 98.67 18 71 0.05 136,174 98.72 19 1,763 1.28 137,937 100.00