UNIVERSITY OF LJUBLJANA FACULTY OF ECONOMICS
MASTER’S THESIS
BUSINESS CUSTOMERS SEGMENTATION WITH THE USE OF K-MEANS AND SELF-ORGANIZING MAPS: AN EXPLORATORY STUDY IN THE CASE
OF A SLOVENIAN BANK
AUTHORSHIP STATEMENT
The undersigned Slaviša Simić, a student at the University of Ljubljana, Faculty of Economics, (hereafter: FELU), declare that I am the author of the master’s thesis entitled Business customers segmentation with the use of k-means and Self-Organizing Maps: an exploratory study within a Slovenian bank, written under supervision of PhD Aleš Popovič and co-supervision of PhD Roberto Henriques.
In accordance with the Copyright and Related Rights Act (Official Gazette of the Republic of Slovenia, Nr. 21/1995 with changes and amendments) I do not allow the text of my master’s thesis to be published on the FELU website.
I further declare
the text of my master’s thesis to be based on the results of my own research;
the text of my master’s thesis to be language-edited and technically in adherence with the FELU’s Technical Guidelines for Written Works which means that I
o cited and/or quoted works and opinions of other authors in my master’s in
accordance with the FELU’s Technical Guidelines for Written Works and
o obtained (and referred to in my master’s thesis) all the necessary permits to use the works of other authors which are entirely (in written or graphical form) used in my text;
to be aware of the fact that plagiarism (in written or graphical form) is a criminal offence and can be prosecuted in accordance with the Criminal Code (Official Gazette of the Republic of Slovenia, Nr. 55/2008 with changes and amendments);
TABLE OF CONTENTS
INTRODUCTION ... 1
1 THEORETICAL BACKGROUND ... 2
1.1 CRM ... 2
1.1.1 CRM building blocks ... 3
1.1.2 The process of the CRM ... 5
1.1.3 CRM success factors ... 5
1.1.4 CRM system implementation issues ... 7
1.1.5 The benefits of the CRM ... 8
1.2 Client segmentation ... 8
1.2.1 The significance of the client segmentation field ... 10
1.2.2 The reasons for the client segmentation ... 11
1.2.3 The process of the client segmentation... 12
1.2.4 Consumer versus industrial client segmentation ... 13
1.2.5 Segmentation bases and variables ... 14
1.2.5.1 Consumer market segmentation variables ... 15
1.2.5.2 Business-to-business market segmentation variables ... 16
1.3 Client segmentation in the banking industry ... 20
1.3.1 Banking industry characteristics ... 21
1.3.2 Products versus services ... 22
2 BUSINESS CUSTOMERS SEGMENTATION WITH THE USE OF K-MEANS AND SELF-ORGANIZING MAPS: AN EXPLORATORY STUDY IN THE CASE OF A SLOVENIAN BANK ... 23
2.1 Business case presentation ... 23
2.1.1 Introduction of Bank S ... 23
2.1.2 Bank’s business needs identification ... 24
2.2 Analysis design ... 25
2.2.1 Data collection ... 25
2.2.2 Methods selection ... 31
2.2.3 Data pre-processing and variables selection ... 37
2.3 Analysis ... 41
2.3.1 Determining the number of clusters ... 41
2.3.3 Clusters profiling and interpretation ... 46
2.3.3.1 Cluster 1 ... 47
2.3.3.2 Cluster 2 ... 48
2.3.3.3 Cluster 3 ... 48
2.3.3.4 Cluster 4 ... 48
2.3.3.5 Cluster 5 ... 49
2.3.3.6 Cluster 6 ... 49
3 DISCUSSION ... 50
3.1 Practical implications ... 50
3.2 Limitations of the master’s thesis ... 52
3.3 Future work... 53
CONCLUSION ... 53
REFERENCE LIST ... 55
LIST OF FIGURES
Figure 1. Building blocks of CRM ... 3Figure 2. Number of items published over the last 20 years ... 10
Figure 3. Marketing strategy process ... 12
Figure 4. Segmentation process ... 13
Figure 5. Influences on buyer’s personal characteristics ... 20
Figure 6. Individual customer segments in % ... 24
Figure 7. SOMs – a rough graphical representation... 35
Figure 8. Relationship Duration histogram ... 38
Figure 9. Product Coverage histogram ... 38
Figure 10. Client Value histogram ... 39
Figure 11. Cubic Clustering Criterion ... 41
Figure 12. Pseudo F ... 42
Figure 13. R-squared ... 43
Figure 14. Sum of the distances ... 43
Figure 15. 30x20 SOM U-matrix ... 44
LIST OF TABLES
Table 1. Company size categories by three criteria ... 18Table 2. Consumer versus business demographics ... 18
INTRODUCTION
Many companies of the contemporary economy have a large number of customers, and each of these represents almost as many different sets of needs and expectations which have become more and more complex, demanding and sophisticated over time. As it is impossible to treat every customer completely individually, let alone to provide them with fully customized products and services, it is clearly evident that they should be divided into a few groups in a reasonable manner, of course.
Even though client segmentation has been present for many years, companies still struggle to use it correctly. They are trying to implement it properly as well as to integrate it into marketing strategy (Dibb & Simkin, 2009, p. 219). Instead of helping in more important, strategic areas, such as products and services innovation, pricing, and distribution channel selection, market segmentation has often been narrowly used for the needs of advertising (Yankelovich & Meer, 2006, p. 1).
While the consumer market segmentation has been a challenging task for marketers, it has been an even more difficult job for those of industrial markets, or as Kukulas (2012, p. 2) had neatly illustrated with an example; whereas consumer marketers go fishing, business-to-business marketers have to fish for sharks. The business market segmentation is known to be much less developed in comparison to the consumer segmentation. However, some techniques of the latter can be also applied to the industrial markets. Yet, unless they want to be led into the wrong direction, practitioners have to be very careful about choosing and refining the appropriate variables on which to segment (Zimmerman & Blythe, 2013, p. 121).
The purpose of this master’s thesis is to examine approaches to the industrial market segmentation through a review of the scientific literature on the respective topic. The objective of the master’s thesis is to find out whether the use of contemporary, non -traditional methods can help business marketers to classify their customers more completely, thoroughly, and to a greater degree. With my own findings and the concise insights from other researchers, I would like to contribute to a better understanding of the business customers segmentation, especially in reference to the banking industry. Based on the real customer data acquired from one of the major Slovenian banks, I will identify the corporate customers segments that would eventually serve as the fundamentals for appropriate addressing and customized marketing campaigns development, reflecting later on in higher profit rates of that particular bank.
The first part of the thesis consists of a comprehensive theoretical-analytical review of the academic literature, articles, studies, and research papers on the discussed topic. Here, I used the descriptive method, as well as the compilation method, that helped me unify the
theoretical observations to a real-life business case. In order for the bank to develop appropriate marketing strategies, adjusted to the characteristics of each segment, I tried to divide somewhat less than 18,000 business clients of a major Slovenian bank into a few reasonable segments by using the combination of two clustering methods: k-means and Self-Organizing Maps.
The outline of the thesis is as follows. The next section introduces concepts of the customer relationship management, contemporary approaches to the customer segmentation, methods of the latter that have currently been in use in the banking field, and previous studies on this subject. The second part of the thesis encompasses business case presentation, research setup, and data collection and analysis. The results are reviewed in the third section. The final part presents the conclusions based on the main findings, together with some potential future research directions.
1
THEORETICAL BACKGROUND
It has been almost a century since Henry Ford’s famous statement: “Any customer can have a car painted any colour that he wants so long as it is black.” These words were his remark on the Model T, a car that was produced from October 1908 to May 1927 (Alizon, Shooter, & Simpson, 2009, p. 590), and they defined the beginning of the so-called “one size fits all” approach to production. Ford’s objective was to build cars for the multitudes; he wanted cars to be both durable and cheap. In order to achieve that, he cut out most of the extravagances and options, including the colour of the paint (Goss, n.d.).
However, this kind of thinking about production and marketing has not been prevalent for quite some time. In an effort to satisfy the diverse desires of each and every one of them, companies nowadays attempt to provide more one-on-one-oriented services to their customers. To be able to do this, they have to understand their clients very well. A modern approach that helps them attain this is the customer relationship management (hereinafter: CRM), which is presented in more detail in the following chapter.
1.1
CRM
Nevertheless, I would agree with Payne and Frow’s (2005, p. 168) definition of the CRM and describe it as a strategic approach that is concerned with creating improved shareholder value through the development of appropriate relationships with key customers and customer segments. It unites the potential of relationship marketing strategies and IT to create profitable, long-term relationships with customers and other key stakeholders. CRM provides enhanced opportunities to use data and information to both understand customers and co-create value with them. This requires a cross-functional integration of processes, people, operations, and marketing capabilities that is enabled through information, technology, and applications.
1.1.1 CRM building blocks
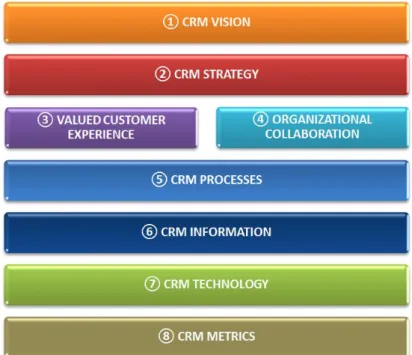
Very similar to the definition given above, Radcliffe, Kirkby and Thompson (2001, p. 2) define eight principal CRM components, touching a wide range of business aspects: information technology, its applications throughout the organization in processes, and the resulting customer experience, as well as the organization, the strategy, and the vision of the company (Peelen, Beltman, Van Montfort, & Klerkx, 2006, p. 5). Figure 1 displays the eight CRM components.
Figure 1. Building blocks of CRM
Source: Adapted from J. Radcliffe et al., The eight building blocks of CRM, 2001.
CRM vision answers the questions on “what” and “why” the company is going to do, the second component, CRM strategy, answers the question on “how” it is going to be done – it describes the way the organization wants to realize its vision (Peelen et al., 2006, p. 6).
To be able to build up a fruitful customer experience, which is the third component of the CRM, the company has to meet or even surpass the expectations of its customers, wherein the product and the service, the price, and the communication form have to be properly set (Plakoyiannaki & Tzokas, 2002, p. 230). In order to do this, the organization has to transform its model from the traditional to the client-oriented business model that will allow it to better understand its customers and, consequently, to better react to their needs. Organizational culture – the fourth building block, however, plays here a significant role since it settles the norms for appropriate behaviour of all employees (Jayachandran, Sharma, Kaufman, & Raman, 2005, p. 179).
To act as a customer-centric organization that develops products and services that fit customer needs, first, the company has to define and understand its processes, analyse them, and, if necessary, redesign its core business processes starting from the customer point of view (Chen & Popovich, 2003, p. 682). Thus, CRM processes are the fifth component of the CRM.
Customer information or customer knowledge, the sixth element of the CRM, is one of the major assets to the organization (Peelen et al., 2006, p. 7); the more the company knows about its customers, the better it can respond to their needs in terms of offer customization and consumption experience improvement, both of which can then lead to a higher customer satisfaction and customer loyalty (Mithas, Krishnan, & Fornell, 2005, p. 202). Collection, accumulation, storage, maintenance, and distribution of the customer knowledge throughout the organization are the domain of the penultimate CRM component – CRM technology (Chen & Popovich, 2003, p. 677).
The last and also the most challenging component of the CRM is performance management. As any other metrics, the CRM metrics can also be used to control, learn and collaborate; yet, it seems to be extremely difficult to identify which metrics are critical in driving CRM benefits. Instead of being dissociated from each other, the financial performance and the CRM performance have to be linked in order to pursue the enterprise-wide benefits (Kirkby, Thompson, & Buytendijk, 2001).
1.1.2 The process of the CRM
While the components of the CRM reveal what are the important aspects when talking about CRM, the process of the CRM tells us how things need to be done for the CRM system to be implemented successfully (Kim, 2004, p. 22). A number of recommendations on how CRM should take place has been published, still, Roberts, Liu, and Hazard (2005, pp. 317–322) present their six-step CRM process model which is further described below.
Since not all customers are equally profitable, hence unequally attractive, profitable customers or customers with a high customer lifetime value (CLTV) have to be identified in order to develop strategies to retain them or to make them even more profitable. Thus, a customer strategy development is the first step in the CRM process. The second step – customer objectives settlement – involves the CLTV analysis where both actual value and potential value have to be distinguished. Here, a suitable customer database is of essential value (Roberts et al., 2005, pp. 318–319).
The third step in the CRM process is organizational readiness accessing. In order to organize company around the customer needs, instead of the products, changes (e.g., process reengineering, organizational culture transformation, personnel adjustment and training, etc.) throughout the organization are inevitable; this requires close collaboration of all employees, especially the managers at all levels (Roberts et al., 2005, p. 320). An enterprise-wide program of change management, which – inter alia – includes powerful guiding and vision construction and communication (Kotter, 1995, p. 61), is a matter of the fourth step – enterprise alignment.
CRM programs execution is the next step in the CRM process, and it requires programmatic CRM activities identification. Those activities have to be well designed, carefully executed, and judiciously measured. Program effectiveness measurement, thus, represents the last step in the CRM process. It covers rigorous metrics identification as well as some new eventual metrics development (Roberts et al., 2005, p. 322).
1.1.3 CRM success factors
Despite the fact that CRM has been one of the fastest growing businesses of the new millennium and a myriad of instructive researches on how to undertake it, critics still imply the high failure rate of the CRM projects (Foss, Stone, & Ekinci, 2008, p. 68). It is because companies keep forgetting some crucial points that have to be addressed when dealing with CRM embracement.
causes criteria, Almotairi (2009, p. 6) offers a summarized list of ten elements for success never to be forgotten when adopting a CRM system; they are briefly described below.
Top management commitment is considered to be a key success factor for the CRM implementation and performance; it is needed in order for the CRM initiative to even get off the ground, as well as to provide sufficient and necessary resources needed. Without it, even the most brilliant CRM undertaking is doomed to failure (Kale, 2004, p. 45).
A clearly designed and stated business strategy is also important because it sets sales and profitability objectives, helps making segmentation and targeting decisions, determines the level of the desired offer customization, and so on (Dimitriadis & Stevens, 2008, p. 499).
According to Chalmeta (2006, p. 1017), data management is the next essential element; it concentrates on collecting, processing, and distributing customer information of just a right amount and quality.
Culture change is by far the most delicate factor for the CRM success; conforming to Horne (2003, p. 53), who compares corporate culture changing to “steering a battleship with an oar”, people’s inability to change and adapt is the main reason for the CRM programs failure. Harding, Cheifetz, DeAnglo, and Ziegler (2004, p. 31) claim that end-users involvement at all stages tends to help in overpassing the “soft” obstacles, such as technology deployment and utilization refusal.
Redesign of business processes and organizational structure is often needed in order to align the organization to the customers. Instead of being traditionally organized around their business functions, companies have to arrange their operations around cross-functional processes. This, however, requires an engagement from the entire organization beyond just a marketing department, which is an area of yet another success factor – inter-departmental integration (Ryals & Knox, 2001, p. 540).
Information technology factor is critical since it leverages the CRM-related activities and by that helps improving the company performance. It comprises systems and processes integration, data integration, distribution channels and customer touch-points integration, and so forth (Dimitriadis & Stevens, 2008, p. 501).
Motivated and empowered employees seem to collect, disseminate, and use the customer information better. They respond to customer needs faster, and customize the service to fit the expectations more easily. Usually, they interact with customers with greater hospitality and passion, thus strengthening the relationship almost at a personal level, which allows them to involve a customer to a higher degree (Plakoyiannaki, Tzokas, Dimitratos, & Saren, 2008, p. 273). All of this is the domain of the customer consultation success factor.
Last but not least, monitoring, controlling, measuring, and feedback factor is also an important element. It occupies formation and employment of the measures of the CRM implementation and the CRM impact to company performance (Almotairi, 2009, p. 8). Authors have proposed a variety of approaches to measure the CRM success; market share, increased lifetime value, cross-sell ratios, and balanced scorecard are just some of them (Sear, Hartland, Abdel-Wahab, & Miller, 2007, p. 5).
1.1.4 CRM system implementation issues
Langerak and Verhoef (2003, pp. 79–80) stress the following directions that can serve managers when implementing the CRM system:
Direct CRM implementation by business strategy
Implementation should be in line with the chosen strategy, thus the type of the CRM application has to depend on it.
Level of embedment
Usually, the CRM systems are successful when they are strategically installed; still, it is not always that straightforward, tactical implementation can also be a good choice.
The nature of change
Even though the CRM implementation considers changes in the organizational structure, this kind of changes is not always hard; it depends on the CRM approach.
Make a cost-benefit analysis
Unless companies want to make vast investments in CRM that eventually do not pay off, they have to make a cost-benefit analysis. It can confirm not so vague CRM application already covers their needs.
“Develop-Buy-Outsource” choice
If companies lack appropriate resources to develop the CRM software in-house, they should consider outsourcing the development or buying a CRM solution.
Do not focus on software
Although a significant part of the CRM budget is assigned to software, companies must not fall into the trap of looking at it as the key to success.
CRM provider choice
1.1.5 The benefits of the CRM
As we have seen above, CRM as a concept is quite a sophisticated process that calls for changes, improvements and transformations all over the organization, demanding a tight participation of all members, and emphasizing a top management commitment. Yet, companies still swear by it and invest a great deal of effort to incorporate it into their businesses. Why is that so? They are highly aware of the benefits that CRM can provide to them.
In the past, it had been guesstimated that the benefits of the CRM differed from industry to industry (Lemon, Rust, & Zeithaml, 2001, p. 2); newer studies, however, demonstrate exactly the opposite; benefits of the CRM are not too different across industries (Reinartz, Krafft, & Hoyer, 2004, p. 301). Therefore, Richards and Jones (2008, p. 123) state the following, commonly known core benefits of the CRM:
improved ability to target profitable customers;
integrated offerings across channels;
improved sales force efficiency and effectiveness;
individualized marketing messages;
customized products and services; and
improved customer service efficiency and effectiveness.
In addition, Ko, Kim, Kim, and Woo (2008, p. 66) highlight even more advantages of the CRM identified in the literature:
increased profits;
accurate customer information collected;
enhanced customer loyalty;
effect of word-of-mouth;
reduced costs of new customer acquisitions;
greater ease in developing new products;
increased sales by additional purchases;
increased brand loyalty;
increased customer lifetime value; and so forth.
1.2
Client segmentation
base of how to maximize that value is the customer segmentation, which is further described below.
As already mentioned, customers are very different and have disparate needs and desires. However, customers that share common characteristics are prone to choose the same products or services (McKechnie, 2006, p. 119). Still, it often happens that similar people buy quite different products while dissimilar people can purchase products that are unexpectedly very much alike.
Companies have to be able to distinguish among their customers. A company that “tars all of its clients with the same brush” is addressing everybody, yet still nobody. Furthermore, client distinction has to be done with a great deal of prudence, involving some state-of-the-art strategies and approaches; namely, bear averages and statistics are not sufficient and can be misleading.
For example, an average able-to-purchase member of a Slovenian household happens to be three quarters a woman and one quarter a man, has a high-school degree plus a first year of a college completed, and earns approximately 500 euros every first day of each month. Together with their family, this person drives around in a car and a half, and has to feed one third of their cat and one third of their dog in their suburban appartment. The person prefers a heavy, saturated food which is low in calories at the same time. Their favourite painting is the one that shows the nature, or a little girl, or an abstract smudge of colour. The person has no opinion about most of the stuff, and their most common answer is “I don’t know” (Valicon, 2013).
To sum up, there is no “average” consumer neither exactly the same people. Even if the company can afford to target the whole market, it is more successful when it adjusts its products and communication to individual segments. However, a company has to be capable to group its customers together along the common variables they hold as closely as possible. The process of dividing customers into distinct, meaningful, and homogeneous subgroups based on various attributes and characteristics is – according to Tsiptisis and Chorianopoulos (2009, p. 189) – known as client segmentation, also referred to as customer or market segmentation. It is used as a differentiation marketing tool which enables organizations to understand their customers and build differentiated strategies, tailored to their characteristics.
1.2.1 The significance of the client segmentation field
While reading the literature, I have noticed that client segmentation was a broadly attractive topic for researchers and writers. To make sure whether it is really important and how important it is, I visited Thomson Reuters’ website. Thomson Reuters is the world’s leading source of intelligent information for businesses and professionals that serves customers within four areas: financial and risk, legal, tax and accounting, and intellectual property and science (Thomson Reuters, n.d.).
Their citation index tool, Web of Science™, provides researchers, administrators, faculty, and students a quick, powerful access to the world’s leading citation databases. An authoritative, multidisciplinary content covers over 12,000 of the highest impact journals worldwide, including Open Access journals and over 150,000 conference proceedings (Thomson Reuters, n.d.).
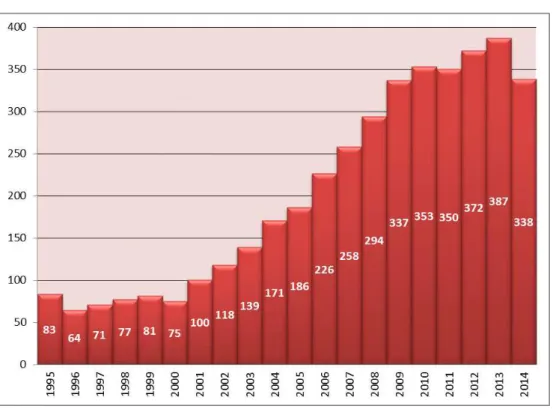
Thus, it made me wonder how many articles from the field of market segmentation have been published over the past years. Since Wendell Smith first proposed market segmentation as an alternative market development technique to product differentiation back in 1956 (Bailey, Baines, Wilson, and Clark, 2009, p. 229), more than four thousand and eight hundred papers have been published. As we can see in Figure 2, more and more articles were published each year. Thus, market segmentation attracts the attention of the researchers increasingly; therefore, I believe it to be quite an important issue.
As a contrast, I took a look at the business market segmentation field. Similar to the market segmentation in general, the number of published articles was increasing progressively throughout the years, but to a much lesser extent, which confirms my statement in the beginning of the master’s thesis that the industrial market segmentation is underdeveloped compared to the consumer market segmentation.
1.2.2 The reasons for the client segmentation
The client segmentation has been considered to be a key concept in the field of marketing, which promises some great benefits that would sooner or later result in higher revenues. Therefore, it is not surprising the fact that companies are trying hard to employ it within their operations, since it enables them to understand their customers better and focus on the ones that bring them (more) profit.
Hutt and Speh (2013, pp. 91–92) listed the following benefits of the segmentation that can accrue to the firm if the necessary requirements are met:
adjustment to the unique needs of customer segments;
efficient and effective business marketing strategies generation;
focus on the product-development efforts;
profitable pricing strategies development;
appropriate distribution channels selection;
advertising messages development and targeting;
sales force training and deployment; and so forth.
Even though McKechnie (2006, p. 119) claims that benefits of the client segmentation have to be weighed up against higher costs incurred in identifying and responding to the needs of specific segments (e.g., research and development, manufacturing, marketing and inventory costs), she believes segmentation offers many benefits. She argues that market segmentation provides better opportunities to:
identify growth segments;
create more customer value;
increase customer satisfaction;
charge premium prices;
reduce competitive pressures; and so forth.
1.2.3 The process of the client segmentation
In order to conquer in today’s marketplace, a company has to put its customers in the centre. To do that, it has to develop such marketing strategy that will allow it to create customer value and consequently achieve profitable customer relationships (Kotler & Armstrong, 2012, p. 72). The process of the marketing strategy, which answers the questions “which customers to serve” and “how a value can be created for them”, is depicted in Figure 3.
Figure 3. Marketing strategy process
Source: P. Kotler & G. Armstrong, Principles of Marketing, 2012, p. 72.
The first step is the market segmentation; companies divide their markets into smaller groups of customers who respond to a given marketing effort in a similar way. This enables them to determine which segments are the most attractive, offering them the best opportunities, so they can select one or more segments to concentrate their struggles to (Kotler & Armstrong, 2012, p. 73). Finally, there come the market differentiation and positioning, which involve choosing how to present the offer to the market in a way that will take advantage of and advertise the company’s competitive advantage (McKechnie, 2006, p. 119).
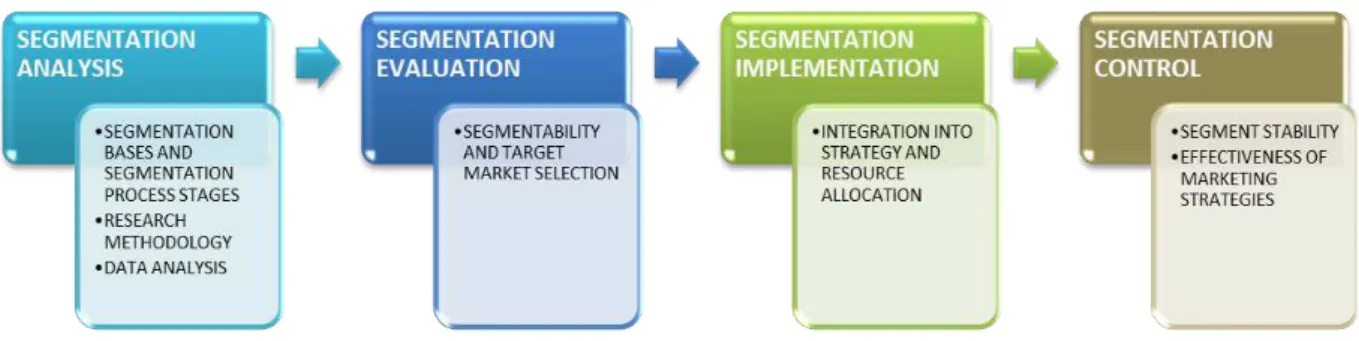
However, the process of the client segmentation itself is – in more detail – demonstrated in Figure 4 on the next page. As it can be seen, it is composed of four phases: segmentation analysis, segmentation evaluation, segmentation implementation, and segmentation control. Furthermore, the process of the market segmentation is described – step by step.
Figure 4. Segmentation process
Source: S. Goller et al., A new research agenda for business segmentation, 2002, p. 254.
The second step, segmentation evaluation, includes “segmentability” assessment and target market selection. Among all segments identified, the acceptable segments are the ones that are miscellaneous in-between and similar within each other. Based on several additional factors, such as segment size and growth, and expected market shares, the ultimate segments are then selected to be targeted (Goller et al., 2002, p. 261).
The segmentation process continues with its implementation; segmentation has to be integrated into all three levels of corporate decision making: strategic, tactic, and operational. Segments choice has to be done at a corporate level, and then translated into the tactical and operational levels through resources allocation (Goller et al., 2002, p. 263).
The last part of the segmentation process is its control. It involves the monitoring of the segment stability in terms of segments to remain homogeneous, and a potential re-segmenting of the market in case of changes in stability detection. Moreover, it relates to the effectiveness, or should I say the efficiency (i.e. segment profitability, customer retention and customer attrition rates, etc.) of the strategies implemented supervision. Those measurements enable possible gaps between the planned and the actualized strategies identification, and serve as a foundation for some corrective actions construction (Goller et al., 2002, pp. 264–265).
1.2.4 Consumer versus industrial client segmentation
The first difference is the complexity of the decision-making process; a decision-making unit in the business market is far more complicated. Rather than to be limited to a very small family unit, as it is the case with household purchases, a purchase at an enterprise level may involve experts from assorted business functions, each of whom favouring the interests of their own function. Thus, a company may have to segment not only the organizations in which those decision-makers work, but also the decision-makers themselves (B2B International, n.d.).
Second, the difference between the two markets is also the B2B buyers to be much more rational. Instead of buying “what they want” (without placing the price in the first place), the industrial buyers typically buy “what they need”; therefore, the segmentation of business audiences should be easier, since their needs can be easier to determine than their desires (B2B International, n.d.).
Products bought by organizations are, as the decision-making process, more complex compared to consumer products. Whereas the latter are often standardized, products for companies are usually custom-made. The next difference is that the business target audiences are smaller than the consumer target audiences, but consume far more products or services (B2B International, n.d.).
Furthermore, relationships in business-to-business markets are more important. The smallness of the customer base makes it easier to give more attention to each customer, which enables a more personal interaction, resulting in relationship and trust development. It is not surprising that many companies have clients that have been loyal to them for many years (B2B International, n.d.).
The sixth difference is B2B purchases to be of a long-term essence, which is not the case with consumer buyers. Long-term purchases or purchases that are expected to be repeated over a longer extent of time are relatively rare in consumer markets. Onwards, the business-to-business markets drive innovation less than the consumer markets because, usually, the innovation is a response to a novelty that has happened further upstream (B2B International, n.d.).
Lastly, behavioural and needs-based segments are by far fewer in industrial markets, while it is not unusual for a consumer market to boast more than ten segments, an average B2B study normally produces three to four segments (B2B International, n.d.).
1.2.5 Segmentation bases and variables
authors outline four major market segmentation bases: geographic, demographic, psychographic, and behavioural. Each of these bases is further described below.
1.2.5.1 Consumer market segmentation variables
Geographic segmentation consists of breaking the market down into smaller units, based on different geographical criteria; companies can use more sloppy classifications to divide their customers by nations, regions, states, or they can segregate their markets in a bit more profound way into counties, cities, or even neighbourhoods. It depends on an individual enterprise whether it is going to operate within just a few geographical areas, or it will cover all areas; however, local variations in needs and wants should always stick in their heads (Kotler & Keller, 2006, pp. 247–249).
Demographic segmentation is the most popular and widely used basis for segmenting the market. Demographic variables, such as age, gender, family size, income, occupation, education, religion, nationality, and so on, are very attractive groundwork for customer classification since they often reflect consumer needs, wants and expectations almost directly. Another reason for their recognition is that they are easier to measure compared to most of the other types of segmentation variables (Kotler & Armstrong, 2012, p. 215).
Another way for companies to distinguish their customer groups is by means of psychographic characteristics. According to Cambridge online dictionary (n.d.), psychographics is the science of studying and measuring customers in relation to their opinions, interests, emotions, values and lifestyles, using psychology and demographics. Therefore, knowing their customers’ lifestyles, personalities and beliefs, companies can determine various customer profiles, and – later on – provide them with such products, services or brands that will match their own personality (Kotler & Armstrong, 2012, pp. 168–174).
In conformance to many marketers, behavioural segmentation can be the best cornerstone for setting up customer segments. Customers can be grouped under several behavioural characteristics, such as the time of purchase, the reasons for purchase, product usage, and so on. Below, some of the main behavioural variables, stated by Kotler and Keller (2006, pp. 255–257), are explained:
buying occasions; which can be delimited in terms of time of day, week, month, year, or in terms of some important lifecycle events of a customer. Customers can be grouped correspondently to the occasions when they develop a need, actually make a purchase of a product, or use the bought;
user status; customers can be divided by the status they hold to the product. Markets can be segmented into nonusers, ex-users, potential users, new users, or regular users, and so addressed differently, correspondingly to the status they possess;
usage rate; a good way of grouping customers can be the rate of product usage, thus a company can identify light, medium, and heavy users;
loyalty status; company can group its customers by the degree of their loyalty. Some buyers are absolutely loyal and buy one brand all the time, others are partially loyal and choose between two or three favourite brands, still other buyers show no loyalty to any brand.
Combining different behavioural bases tends to provide a more comprehensive and cohesive view of the market and its segments (Kotler & Keller, 2006, p. 257). However, a combination of multiple segmentation bases in general has proven to be the best decision for marketers when they want to identify smaller and better-defined target groups (Kotler & Armstrong, 2012, p. 222).
1.2.5.2 Business-to-business market segmentation variables
Segmenting business-to-business markets, however, is not that different from the consumer market segmentation. Many authors, including Anderson and Narus (2004, p. 90), are certain that organizations should consider their corporate clients (companies) as individuals. According to Zimmermann and Blythe (2013, p. 121), many variables from consumer market segmentation can be used by business marketers as well. They say business buyers can be divided geographically, demographically and behaviourally, while psychographic variables are unadaptable in business markets, as they claim. Some other researchers, on the other hand, including Barry and Weinstein (2009, p. 315), argue just the opposite and advocate the usefulness of B2B psychographics, as we shall see later on. But now, let us take a look at how each consumer market segmentation basis can be placed in the context of the industrial client segmentation.
Similar as with dividing a consumer market, where customers have been distinguished based on several variables, such as age, status, education, and the like, the industrial customers can be also categorized under a set of demographic factors, known as the “demographics of the firm” or firmographics.
As consumer desires and needs change with age, and thus serve as an excellent cornerstone for appropriate products and services offerings build-up, so can the age of a company, that is, the length of time a firm has been in business, be a useful segmentation dimension. For instance, a new company can be an attractive target for accounting or legal services providers since it does not have many relationships established with vendors (yet); marketing services agencies can focus on growing companies which are prone to some major investments; while trying to start a cooperation with mature companies that typically already have well-entrenched relationships with their sellers can be a waste of time (Weinstein, 2004, p. 72).
Customer distinction by means of financial factors is possible within industrial markets as well. In fact, the following type of segmentation is a long-standing practice for both the consumer and business market separations (Kotler & Keller, 2006, p. 251). While the qualification and the profession of an individual imply his or her earnings (the higher the education and the better the position, the greater the amount of the income), and allow marketers to distinguish among affluent and non-affluent customers, it is the amount of the profit, the share of the market, and the volume of the sales that come useful in the context of industrial segmentation by financial situation (Weinstein, 2004, pp. 72–73).
However, the volume of sales not only reveals the financial strength of a company, it also says a lot about its size; usually, the greater the sales, the bigger the company, and vice versa. According to Anderson and Narus (2004, p. 46), the size of a company can also be delimited by some other specific measures like number of employees or number of establishments, which usually come from secondary sources.
Table 1. Company size categories by three criteria
Enterprise category
Headcount: Annual Work
Unit (AWU)
Annual turnover (in
million)
or
Annual balance sheet
total (in million)
Medium-sized < 250 ≤ €50 or ≤ €43
Small < 50 ≤ €10 or ≤ €10
Micro < 10 ≤ €2 or ≤ €2
Source: European Commission, The new SME definition. User guide and model declaration, 2005, p. 14.
Another way of grouping industrial customers together is by industries in which they operate. Namely, the industry factor has been a very powerful unit of analysis for years as the industrial marketing doctrine consensually assumes that firms within a particular industry share several common characteristics (Mauri & Michaels, 1998, p. 212).
In order to help businesses, financial institutions, governments and other operators in the market by providing them with reliable and comparable statistics, countries have developed generalized business classification systems. These systems represent a framework for collecting and presenting a large range of statistical data in accordance with the economic activity. Statistical classification of economic activities, used within a European Union, is called NACE (acronym derives from the French name Nomenclature
générale des Activités économiques dans les Communautés Européennes), and – at the
highest level – consists of 21 different items or sections (Eurostat, 2008, pp. 5–44).
The comparison between consumer and business demographics is briefly summarized in Table 2.
Table 2. Consumer versus business demographics
Demographic Category Consumer Demographics Business Demographics
Age Age distribution Number of years firm has
been in business
Financial factors Income; occupation;
Continued
Demographic Category Consumer Demographics Business Demographics
Market size Population; number of households; household size
Number of potential customers; number of establishments, stores,
plants; number of employees
Industry structure/social class
Lower-lower to upper-upper class; lifestyle clusters
Industry position; goods versus services; economic
activities classification
Source: Adapted from A. Weinstein, Handbook of market segmentation: strategic targeting for business and technology firms, 2004, p. 72.
However, segmenting customers based on demographics, geography or NACE codes often seems to fall short of answering the needs of industrial marketers, and can be – according to Neal (2002, p. 37) – suboptimal at best, and devastating at worse. That is why many authors, with Barry and Weinstein (2009, p. 315) at the forefront, believe that B2B psychographics can be a great alternative or complement to firmographics.
They describe organizational psychographics as the segmentation of organizational buyers into homogenous clusters of mind-sets and behaviours that are distinguished by motives, risk perceptions and social interaction styles in order to identify prospects as well as predict the predispositions of the firm’s decision-makers for the sake of adapting products, marketing messages and relational selling behaviours.
Figure 5 on the next page illustrates the above definition. As we can see, industrial customer’s buying mentality is much more complicated than it is the case of the consumer sector. By analysing purchase motives, marketers can better understand why buyers act the way they do in the marketplace; knowing a purchasing manager’s risk tendency can help in understanding and segmenting the purchasing situation; an analysis of buyer’s social interaction, temperament, and cultural relationship styles can assist in designing effective product strategies and promotional campaigns (Barry & Weinstein, 2009, pp. 320–335).
Nevertheless, the psychographic segmentation can help sales management devote the optimal amount of resources for communicating with and servicing their customers by understanding buyer’s predispositions. Knowing and understanding the motivations, risk management behaviour and relationship styles are vital for adaptive selling, account prioritization and resource allocation (Barry & Weinstein, 2009, p. 332).
Figure 5. Influences on buyer’s personal characteristics
Source: J. Barry & A. Weinstein, Business psychographics revisited: from segmentation theory to successful marketing practice, 2009, p. 319.
1.3
Client segmentation in the banking industry
Banking as well as other financial services, such as insurance or credit cards, was among the first industries where the idea of addressing different customer groups with differentiated products or services was approved (Bull, 2003, p. 594). Since Wendell Smith first proposed the market segmentation as an alternative strategy to the product differentiation back in 1956, and up until now, there have been used miscellaneous variables as a basis to segment customers within the financial services industry; from well-established segmentation bases, such as geographic and demographic, to more contemporary approaches, such as psychological or benefit segmentation (Machauer & Morgner, 2001, p. 6). However, the degree of knowledge about the corporate and the private bank customers remains in favour of the latter.
1.3.1 Banking industry characteristics
Like every other, the financial services industry has its own characteristics that make it unique. The banking industry itself, however, is considered to be evidently different from other industries; conformable to a large body of research, the development of a financial system is crucial for growth, development, and stability of the entire economy (Barth, Caprio, & Nolle, 2004, p. 2).
Therefore, it is important to know the aspects which beneficially affect the progress of the banking system, and consequently, the economy as a whole. Key characteristic of banking systems, pointed out by Barth, Caprio and Nolle (2004, pp. 2–39), are discussed below.
The first feature of a banking system covers the matter of the ownership of banks; indeed, we can distinguish between the private-versus-government and the foreign-versus-domestic ownership. Based on their 55-country-wide research, Barth, Caprio, and Nolle (2004, p. 8) found a negative correlation between the degree of government ownership and the amount of national income. In other words, the higher the degree to which the government is involved in the banking system, the lower the overall performance of the economy.
However, things are not that straightforward when it comes to foreign and domestic ownership comparison; the performance of foreign banks may differ among countries with different income levels, and so may their influence on the economic development. As a confirmation, Claessens, Demirgüç-Kunt, and Huizinga (2001, p. 908) found foreign banks to exceed home-country banks in developing countries, though fall behind domestic banks in already developed countries.
The second characteristic relates to the competitiveness in the banking industry, measured by concentration ratios, which are the percentages of market shares, deposits or assets, held by the largest banks in the industry. As Laeven and Claessens (2003, pp. 563-583) argue, the higher the degree of concentration, the greater is the banks’ tendency to invest in gathering and processing the information about borrowers. Therefore, a high market power leads to a greater access to external finance for firms, resulting in an enhanced economic growth.
In addition, based on their research with the data from nearly 80 countries, Beck, Demirgüç-Kunt, and Levine (2006) determined the positive correlation between the concentration and the stability of a banking system; concentrated banking systems foster more stability since they are less vulnerable to banking crises.
been regulated in every country. What is more, the banking industry may be the most regulated and supervised of all industries. However, approaches and measures vary across countries (Barth, Caprio, & Nolle, 2004, p. 17): still – according to findings of Barth, Caprio and Levine (2003, p. 234) – a more stringent control is negatively associated with bank performance.
The last, yet evenly important characteristic of a banking system encompasses the corporate governance of the banks. When the goals of the owners diverge considerably from the ones of the managers, we talk about the so-called “principal-agent” problem. Namely, managers, who were hired to “do the job” for the owners in the first place, may become egoistic, start to pursue their own interests over the goals of the owners whose motive is to maximize the value of the share. Given the special connection between banks’ performance and the overall performance of the economy as a whole, banks’ capability to overcome the aforementioned issue is of crucial importance. According to Caprio and Levine (2002, p. 19), an effective corporate governance of banks will eventually lead to a more efficient capital allocation, subsequently resulting in greater economic development.
1.3.2 Products versus services
Even though many have argued that there are almost no companies that are being completely product- or service-based (Araujo & Spring, 2006, p. 802), nor are many products that are being pure goods (Johnson & Weinstein, 2004, p. 65), it is wise to know the differences between products and services, and, particularly, the marketing approaches of the both.
For many years, products and services have been distinguished based on four specific features, first ratified by Zeithaml, Parasuraman, and Barry back in 1985 (p. 43): intangibility, heterogeneity, inseparability, and perishability, also known as IHIP characteristics. The intangibility means the service cannot be seen, tasted, felt, heard or smelled before it is bought. The heterogeneity implies on the dependence of who provides it as well as when, where, and how it is provided. The inseparability refers to the fact the service is produced and consumed at the same time, thus cannot be separated from its provider. Finally, the perishability means the service cannot be stored for later use or sale (Kotler & Keller, 2006, pp. 405–408).
services marketing and goods marketing to be reunited under a service banner. Another way they see marketing could be undertaken is based on the differences among services themselves, rather than just between products and services.
Anyway, given that the question on how to identify and take into account the differences between products and services in their marketing obviously calls for some more research, it is reasonable to check the significance of services for the economy.
2
BUSINESS CUSTOMERS SEGMENTATION WITH THE USE OF
K-MEANS AND SELF-ORGANIZING MAPS: AN
EXPLORATORY STUDY IN THE CASE OF A SLOVENIAN
BANK
Before we move to the business case examination, let us see the importance of the services sector for the Slovenian economy. Similar to the European Union, where tertiary sector holds about 75 percent of the Europe’s GDP, offering more than three-quarters of all job opportunities (European Commission, 2014), in Slovenia as well, the services sector dominates the economy. In 2014, services providers contributed to 55.7 percent of the Slovenia’s GDP (Statistical Office of the Republic of Slovenia, 2014a), and employed more than 62.4 percent of the whole working population (Statistical Office of the Republic of Slovenia, 2014b).
The banking industry itself, on the other hand, did not play a significant role in contributing to GDP growth in 2014; as a matter of fact, it accounted to as low as 2.3 percent of the Slovenia’s GDP (Statistical Office of the Republic of Slovenia, 2014a), and was one of those industries that disseminated effects of the global economic crisis on the domestic economy.
2.1
Business case presentation
The analysis, carried out in this master’s thesis, is based on a real-life business case – an industrial customers dataset of one of the major Slovenian banks, which – due to data sensitivity and confidentiality – preferred its name to remain undisclosed. Therefore, in order to ensure better coherency, we will call it “Bank S”. Below, there is a brief description of the bank and its operations.
2.1.1 Introduction of Bank S
them), it enables its customers to use their services via several contemporary banking channels such as widespread ATM network, electronic banking, telephone banking, and mobile banking. Through the branch network, together with its sales agents, it also offers all leasing products to both individuals and companies.
Bank S looks out to building extensive, long-term relationships with its customers. It constantly seeks to enhance the quality of its services by quick responsiveness to its clients’ needs, and constant improvements of the offices in its network; it tries to satisfy the needs of its existing clients while attracting new ones. Bank S gives a special focus on individuals, sole proprietors and SMEs. For each segment, it looks for specific strategies with dedicated sales approaches and corresponding managerial support lines. At all stages of the sales process, it tries to develop a comprehensive and a standardized approach.
The range of its banking services meets all financing needs of its clients. With respect to the savings products, Bank S offers its customers a wide scope of investment opportunities as well – it is developing a wide variety of insurance and investment products in cooperation with selected insurance companies.
2.1.2 Bank’s business needs identification
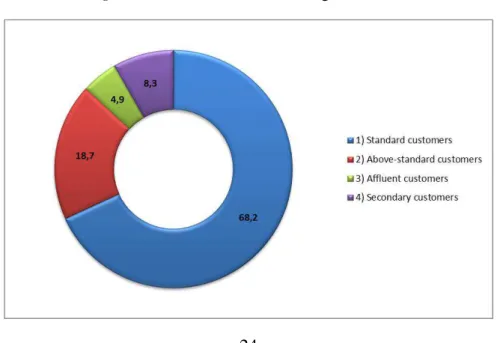
As many other companies, Bank S is also aware of the great importance of the customer segmentation at present. Therefore, it already has in place its individual-customers segmentation; based on the data about customers and the products that those customers possess, they classify them into few smaller groups. Having done so, they identified the following segments: “Standard” customers, “Above-standard” customers, “Affluent” customers, and “Secondary” customers. The structure of individual customer segments is demonstrated in Figure 6.
However, what they still miss is the corporate customer segmentation. They want to prepare the segmentation for sole proprietors, and SMEs, and eventually, extend it across their entire business customers portfolio. As in the European Union, where SMEs play a central role in the economy by providing more than 75 million jobs and representing 99 percent of all enterprises (European Commission, 2005, p. 5), in Slovenia as well, SMEs run the economy, they represented 99.82 percent of all companies in 2014, producing together about 70 percent of the whole Slovenian income (Statistical Office of the Republic of Slovenia, 2014c).
How about the Bank S? The entire corporate customer portfolio brings about one half of their net banking income. SMEs, however, contribute to about 40 percent of the income, made by companies, which represent 20 percent of the entire net banking income.
2.2
Analysis design
Operations of today’s companies have been a very broad concept. Since businesses have been so expansive, the number of different transactions has become endless. Banks, however, are among the companies who operate with the greatest number of transactions every day. Thus, to be able to collect all the data and store it for later use, they need to build a data warehouse. Still, in order for different departments to work most efficiently, an enterprise-wide data warehouse needs to be further sliced into several smaller subsets, that is, data marts. The case of the Bank S is the same; all of their data has been organized into a few departmental data marts, and the source for the analysis, carried out in this master’s thesis, was the data mart of the Marketing Department.
2.2.1 Data collection
To collect all data needed to perform the analysis, the use of the two Business intelligence tools – Oracle Discoverer 10g and MicroStrategy 9 – was required. Therefore, I was gathering the data for almost two months since the beginning of 2015. With the help of the Marketing Department, I was able to gather some client-related data, as well as specific data on each product that those clients held, from their data mart. One part of the data, more precisely a balance sheet data, was obtained from an external data source – Agency of the Republic of Slovenia for Public Legal Records and Related Services. The entire data acquisition process is described in the following paragraphs.
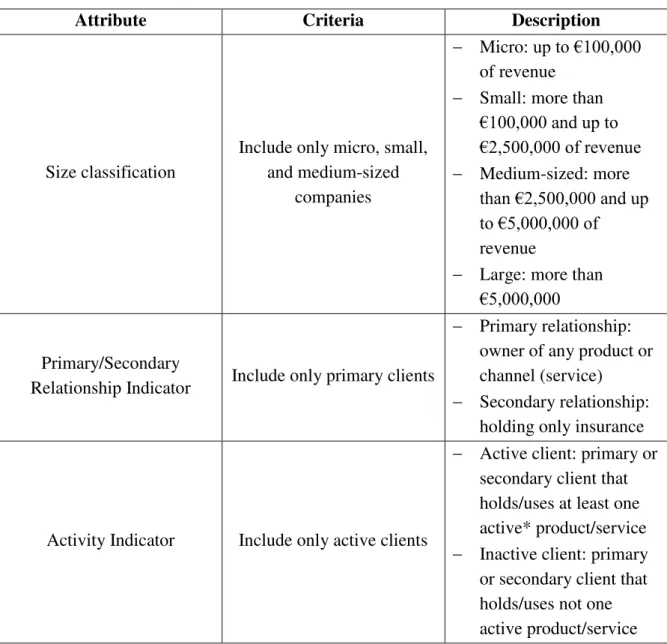
Table 3. The initial customer list exportation criteria
Attribute Criteria Description
Size classification
Include only micro, small, and medium-sized
companies
Micro: up to €100,000 of revenue
Small: more than €100,000 and up to €2,500,000 of revenue
Medium-sized: more than €2,500,000 and up to €5,000,000 of
revenue
Large: more than €5,000,000
Primary/Secondary
Relationship Indicator Include only primary clients
Primary relationship: owner of any product or channel (service)
Secondary relationship: holding only insurance
Activity Indicator Include only active clients
Active client: primary or secondary client that holds/uses at least one active* product/service
Inactive client: primary or secondary client that holds/uses not one active product/service
Note. * The definition of an active product/service is explained in the next table.
In regard to the above criteria, the original dataset consisted of 17,855 records, arranged in a tabular form. Each of the rows represented a single customer, while the columns included different client-related data. Besides some of the key data, such as Client Number, ID Number, and Tax File Number, there were also some contact details, such as Company Name, Address, Post Code and Name, Telephone Number, and Email Address. Moreover, the initial file included several data on bank-client relationship: Relationship Starting Date, Relationship Officer Code and Name, Business Unit Code and Name, and Branch Code and Name.
earnings from each customer, and how much has each customer cost them from the beginning and to the present day.
The next information I got was Double Relationship Indicator, which suggested whether there had been a connection between a corporate client and an individual customer. For the ones, where that connection had been detected, I also received the data on Individual Customer Value and Individual Customer Segment (according to the outcomes of the individual-customers segmentation).
Finally, the results of the first query included information on the status of each product the original set of clients held. As already mentioned above, Bank S offers its clients an extensive assortment of banking products – apart from basic banking products, such as transaction accounts, payment cards, and electronic banking, it also provides its customers several business financing services such as overdrafts, loans, leasing products, and guarantees. Last but not least, various insurance products as well as plenty of investment opportunities have been enabled to their customers.
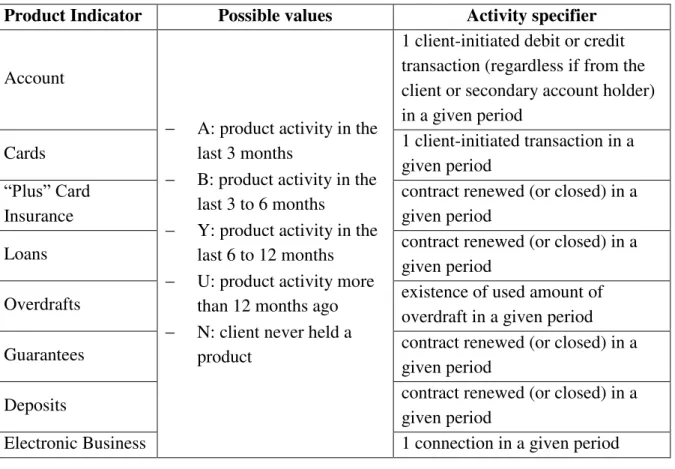
For most of their products, they have system-generated indicators, which suggest the usage of each product intensity, while for some of them, they need to calculate indicators by themselves based on other departments’ data-mart information. Table 4 explains particular values of each product indicator.
Table 4. Product indicator description
Product Indicator Possible values Activity specifier
Account
A: product activity in the last 3 months
B: product activity in the last 3 to 6 months
Y: product activity in the last 6 to 12 months
U: product activity more than 12 months ago
N: client never held a product
1 client-initiated debit or credit transaction (regardless if from the client or secondary account holder) in a given period
Cards 1 client-initiated transaction in a
given period “Plus” Card
Insurance
contract renewed (or closed) in a given period
Loans contract renewed (or closed) in a
given period
Overdrafts existence of used amount of
overdraft in a given period
Guarantees contract renewed (or closed) in a
given period
Deposits contract renewed (or closed) in a
given period
After gaining the above-mentioned client-related information, I had to obtain all product-pertinent data. For that reason, the Marketing Department conducted several different inquiries, one for each product. All the variables as well as the criteria used to export each product data are described below.
All account-related data was the first to be collect; considering all active, that is, non-closed, corporate accounts, I was able to get information on the following variables for the period of three months retrospectively:
Contract Signature Date (the date when a client opened the account);
Amount of Inflows (amount of all client initiated credit transactions, without fees and interest);
Number of Inflows (number of all client initiated credit transactions, without fees and interest);
Amount of Outflows (amount of all client initiated debit transactions, without fees and interest);
Number of Outflows (number of all client initiated debit transactions, without fees and interest);
Amount of Credit Operations (amount of all credit transactions, both client and bank initiated);
Number of Credit Operations (number of all credit transactions, both client and bank initiated);
Amount of Debit Operations (amount of all debit transactions, both client and bank initiated);
Number of Debit Operations (number of all debit transactions, both client and bank initiated);
Average Monthly Balance (average of each day in a month balance);
End of Month Balance (the last day in a month balance);
Average Not Allowed Balance (average of all balances that were lower than allowed negative balance); and
Number of Not Allowed Balance Days (number of days when client was in not-allowed negative balance).
The next set to export was the data about payment cards, more precisely about credit cards transactions. Taking into consideration all non-closed and non-blocked cards, the second file included following corporate-customer credit cards information:
Monthly Purchase Amount (sum of all client initiated transactions);
Number of Purchases per Month (number of all client initiated transactions);
Fees (system-generated transaction, i.e. amount, automatically charged to every client that holds credit card – besides company analogous monthly membership fee, it also includes commissions for each credit card holder within the company); and
Interest (system-generated transaction, i.e. proportion of all ATM cash withdrawal amounts).
Information on overdrafts was the next that the Marketing Department queried for. After setting the currencies of all accounts to convert to euro, and including only those overdraft holders whose product contract expiration date was greater than date of data exportation, they were able to provide me the following variables:
Total Authorized Amount (amount of allowed negative balance, agreed in the contract);
Start Date (the date when a client can start drawing an overdraft amount);
End Date (the date when drawing of an overdraft amount is disabled);
Average Drawn Amount (average of all allowed negative balances); and
Debit Interest Amount (amount, charged to a client for being in allowed negative balance – it is automatically calculated based on contractually specified debit interest rate, and drawn overdraft amount).
We continued with data on loans exportation; even though short-term and long-term loans were exported separately, exactly the same parameters were used for both datasets, and so were identical variables utilized. Thus, limiting data to only active, corporate loans for the course of three months retrospectively, I was provided the following information:
Contract Signature Date (the date from when a client can start to draw on loan);
Contract Amount (amount of a principal to be remunerated);
Number of all Loans (number of all active contracts);
Total Drawn Amount (amount of funds that are drawn down by a client);
Total Outstanding Amount (a principle balance that needs to be paid off); and
Expiry Date (the date when a client must repay all of its liabilities, including both principal and interest).
The Marketing Department provided the data about another financing product, the guarantees. Actually, the only variable I got in this regard was Contract Amount, which represents a sum for which bank gives a warranty that a client is going to pay off its liabilities.