2017
FACULDADE DE CIÊNCIAS
Different approaches to the development and use of carbon
materials for water treatment purposes
Doutoramento em Química
Especialidade em Química Tecnológica
Susana Cristina Roque Marques
Tese orientada por:
Professora Doutora Ana Paula Carvalho
Doutor Ricardo Dias
2017
UNIVERSIDADE DE LISBOA FACULDADE DE CIÊNCIAS
Different approaches to the development and use of carbon
materials for water treatment purposes
Doutoramento em Química
Especialidade em Química Tecnológica
Susana Cristina Roque Marques
Tese orientada por:
Professora Doutora Ana Paula Carvalho
Doutor Ricardo Dias
Júri: Presidente:
● Doutora Ana Maria Jara Ponces da Costa Freire, Professora catedrática da Faculdade de Ciências da Universidade de Lisboa
Vogais:
● Doutor Alain Celzard, Enseignant-chercheur, Laboratoire de Recherche en Science des Matériaux do
Institut Jean Lamour da Université de Lorraine (França)
● Doutora Ângela Maria Pereira Martins Nunes, Professora adjunta do Instituto Superior de Engenharia de Lisboa do Instituto Politécnico de Lisboa
● Doutora Ana Paula Baptista de Carvalho, Professora auxiliar da Faculdade de Ciências da Universidade de Lisboa (orientadora)
● Doutora Ana Sofia Dias Mestre Homem, Professora auxiliar convidada da Faculdade de Ciências da Universidade de Lisboa
● Doutora Carla Maria Duarte Nunes, Investigadora FCT “nível desenvolvimento”, equiparação a Investigador Principal da carreira de investigação científica da Faculdade de Ciências da Universidade de Lisboa
Documento especialmente elaborado para a obtenção do grau de doutor
Fundação para a Ciência e Tecnologia (FTC) no âmbito de Bolsa individual de doutoramento (SFRH/BD/91767/2012)
“Tudo o que é bom dura o tempo necessário para ser inesquecível” Fernando Pessoa
To my family and to all the people that passed through my life and
v
As I end my PhD thesis I would like to acknowledge Fundação para a Ciência e Tecnologia for their financial support through a PhD grant (SFRH/BD/91767/2012) that allowed me to develop my research, and to participate in several scientific meetings where I presented part of the work reported in this thesis. I also thank Faculdade de Ciências da Universidade de Lisboa (FCUL) and Biosystems & Integrative Sciences Institute (BioISI) where the majority of my work was developed, more specifically to Centro de Química e Bioquímica (CQB) for providing the installations and technical resources necessary to my thesis.
I greatly acknowledge my coordinator Ana Paula Carvalho for completely raising me in this scientific field, and for guiding me throughout this thesis. Her dedication was completely unvaluable to the development of this research, and I am truly grateful for her faith and trust. On a personal level, our “living together”, eight hours per day for almost five years, made me feel completely “at home” during this period of my life. Thank you so much.
I thank my co-coordinator Ricardo Dias for having accepted to orientate, and share his expertise with me throughout the biological experiments of my thesis.
A warming thank you to Institute Jean Lamour (Université de Lorraine, CNRS7198) for receiving me in internship, and personnaly to Professors Vanessa Fierro and Alain Celzard for accepting me in their research group during this period, and for all their support when I was in Epinal, and later in Portugal. I also thank Philippe Gadonneix, Clara Delgado, and Angela Sánchez for helping me during my work at the institute, and for their friendship.
I acknowledge Doctor Miguel Machuqueiro for carrying out the molecular modelling studies that contributed so much to the discussion of the adsorption results
I thank Professors Andreja Žgajnar and Marjan Marinsek for their partnership, and for providing the precursor materials for activated carbons preparation and reagent tiamulin. I also thank to Doctors Jossano Marcuzzo and Mauricio Baldan for providing the activated carbon cloth and for all their knowledge and work during my thesis.
I am very grateful to all my colleagues at Grupo de Adsorção e Materiais Adsorventes for being a part of my life everyday, for these last five years. I thank especially Doctor Ana Sofia Mestre, my office roommate, for her support and counceling during the writing of this thesis.
A big thank you to my family who believed in me, and supported me unconditionally throughout this thesis, with a lot of patience.
To everybody in Institute Jean Lamour a great thank you for receiving me so well, for all your work and personal support, and your friendship (and French classes on Sundays). You made my stay in Epinal unforgettable.
To my friend Teresa thank you for your friendship, and for always believing in me, professionally and personally. I will never forget when you printed my scholarship contract and came to me with it rolled in a pink ribbon and a congratulations card. For me that was the beginning of my PhD.
vi
To Rosana, Tiago and Fadhil for their friendship, support, and company in our night and weekend shifts at the laboratory, thank you so much.
A thank you to all the people I met in this period of my life, in the French, dance, and programming classes, for your friendship and for teaching me so much.
At last, I am very grateful to my Seb for showing me the meaning of partnership, love and friendship.
vii
O trabalho que se apresenta nesta tese consistiu na preparação de materiais porosos e na sua aplicação em processos de adsorção de compostos orgânicos em fase aquosa e adesão bacteriana.
Após a introdução teórica (Capítulos II a VI), os resultados que se apresentam no Capítulo VII correspondem ao estudo centrado na preparação de carvões activados a partir de um carbonizado de casca de macieira por activação química com carbonato e hidróxido de potássio, sob diferentes condições experimentais. A metodologia empregue permitiu obter materiais com um elevado rendimento global de preparação e reduzir o conteúdo em compostos voláteis do precursor. Os carvões activados sintetizados com carbonato e hidróxido de potássio apresentam uma porosidade bastante desenvolvida, com volumes microporosos e áreas superficiais específicas elevadas (valores até 1920 m2 g-1 e 2445 m2 g-1, respectivamente). O impacto da
activação na morfologia dos carvões foi avaliada por microscopia electrónica de varrimento e verificou-se que a activação mais severa com KOH levou a um maior consumo da matriz carbonácea e homogeneização de tamanho de partícula comparativamente com a activação com carbonato. No que se refere ao estudo do desempenho destes materiais na adsorção dos compostos farmacêuticos atenolol e hidrogenofumarato de tiamulina foi comparável ao das amostras comerciais testadas. Os carvões com maior capacidade de adsorção foram as amostras activadas com KOH, que permitiram capacidades de adsorção de 556 mg g-1 de atenolol e aproximadamente
250 mg g-1 de tiamulina. O volume de supermicroporos revelou ser importante para a
adsorção do atenolol e algum impacto da química superficial dos carvões no processo foi observado. A adsorção do antibiótico tiamulina decorreu também nos supermicroporos dos sólidos e o volume mesoporoso do carvão NS facilitou a sua difusão.
No Capítulo VIII investigou-se o desempenho de carvões activados de diferentes morfologias na adsorção de dois poluentes orgânicos, e avaliou-se a influência da morfologia em processos de regeneração por tratamento térmico.
O feltro de carvão activado foi caracterizado em termos de textura, morfologia e química superficial, juntamente com amostras comerciais nas formas granular e em pó. O feltro de carvão apresenta uma estrutura aberta composta por fibras de largo diâmetro. A porosidade deste sólido mostrou ser composta maioritariamente por supermicroporos facilmente acessíveis à superfície das fibras do material.
Os carvões foram testados em ensaios de adsorção em fase líquida para remoção de paracetamol e de ácido clofíbrico. A difusão destas espécies foi facilitada no feltro por os seus microporos estarem à superfície da matriz, e no carvão NS devido ao elevado volume de mesoporos. Ambos os poluentes foram eficientemente adsorvidos pelos sólidos até quantidades máximas adsorvidas de 323 mg g-1 e 568 mg g-1 de
paracetamol e ácido clofíbrico, respectivamente.
Foram efectuados estudos de regeneração por tratamento térmico em ensaios cíclicos de saturação-regeneração. As condições de regeneração mais moderadas (aquecimento a 400 ºC durante 1 h) foram mais eficazes na recuperação da porosidade das amostras. O tratamento de regeneração foi mais eficaz no caso do feltro e carvão granular, que retiveram alguma porosidade e aproximadamente 50 % da capacidade inicial de adsorção após o seu segundo reuso.
viii
No que refere ao estudo da adesão bacteriana de células Escherichia coli em carvões activados, os resultados do Capítulo IX revelam que o carvão em pó teve claramente um melhor desempenho removendo até 4log de células por cm3 de suspensão após
48 h de contacto. O mecanismo de adesão neste sólido parece ocorrer em duas etapas: uma adesão inicial favorecida por interacções electrostáticas atractivas, e imobilização de células bacterianas devido à formação de aglomerados carvão-célula-célula-carvão. Não ocorreu adesão de microorganismos na amostra oxidada, o que sugere que o estabelecimento de interacções iniciais repulsivas foi o suficiente para evitar colonização da amostra. A formação das estruturas célula + carvão mostrou-se mais difícil quando as partículas de carvão se encontravam saturadas com cafeína.
Por último, no estudo apresentado no Capítulo X, caracterizaram-se polímeros de tanino obtidos a partir de casca de árvore mimosa, tendo sido também avaliadas as potencialidades dos materiais como adsorventes de diversos compostos orgânicos em fase aquosa.
O uso de maiores quantidades de surfactante promoveu a formação de mesoporos mais largos e menor conteúdo fenólico. Uma das amostras foi lavada com uma solução de ácido clorídrico, e o tratamento causou um ligeiro alargamento dos mesoporos com alguma perda de volume poroso, e sem perda de conteúdo fenólico.
Foi realizado um estudo detalhado da adsorção do corante azul de metileno em fase aquosa, e seguidamente os materiais foram testados relativamente à remoção de um conjunto de compostos farmacêuticos e um plasticizante, muito consumidos a nível mundial. As duas amostras testadas mostram propriedades adsorventes removendo até uma quantidade máxima de 152 mg g-1 de poluente, em condições de equilíbrio. O bom
desempenho dos polímeros foi atribuído em grande extensão ao carácter aromático dos materiais. As espécies moleculares de menor volume molar, e com menor espessura foram adsorvidas em maiores quantidades sugerindo um empacotamento das espécies nos mesoporos dos polímeros.
ix
The work presented in this thesis consisted in the preparation of porous materials and in their application in adsorption processes of organic compounds in aqueous phase, and bacteria adhesion.
After the theoretical introduction (Chapters II to VI), the results presented in Chapter VII correspond to the study centred in the preparation of activated carbons from an apple tree branches char by chemical activation with potassium carbonate and hydroxide, under different experimental conditions. The employed methodology allowed to obtain materials with a high global preparation yield and to reduce the volatile content of the precursor. The activated carbons synthesized with potassium carbonate and hydroxide present a highly developed porosity, with high micropore volumes and specific surface areas (values up to 1920 cm3 g-1 and 2445 cm3 g-1, respectively). The impact of activation
on the morphology of the carbons was evaluated by scanning electron microscopy and it was observed that the more severe activation with KOH led to a higher consumption of the carbonaceous matrix and an homogenization of the particle size, in comparison to the activation with carbonate. The performance of the materials in the adsorption of the pharmaceutical compounds atenolol and tiamulin hydrogen fumarate was comparable and better than that of the commercial samples tested. The carbons with higher adsorption capacity were the KOH activated samples, which allowed for the removal of 556 mg g-1 of atenolol and of approximately 250 mg g-1 of tiamulin, in equilibrium
conditions. The supermicropores volume was important for atenolol adsorption and some impact of the carbons’s surface chemistry on the process was observed. The adsorption of the antibiotic tiamulin also occurred on the supermicropores of the solids and the mesopore volume of carbon NS facilitated its diffusion.
In Chapter VIII the performance of activated carbons with different morphologies in the adsorption of two organic pollutants was assessed, and the role of morphology in thermal treatment regeneration processes was evaluated.
The activated carbon cloth was characterized in terms of texture, morphology and surface chemistry, together with commercial samples in the granular and powdered forms. The carbon felt presents an open structure composed by fibres of high diameter. The porosity of this solid revealed to be mostly composed by supermicropores easily accessible at the surface of the material fibres.
The carbons were tested in liquid phase adsorption experiments for the removal of paracetamol and clofibric acid. The diffusion of these species was facilitated in the cloth because the micropores are at the matrix surface, and in carbon NS due to the high mesopore volume. Both pollutants were efficiently adsorbed by the solids up to maximum adsorbed quantities of 323 mg g-1 and 568 mg g-1 of paracetamol and clofibric acid,
respectively.
Regeneration by thermal treatment was studied in cyclic saturation-regeneration assays. The more moderate conditions of regeneration (heating at 400 ºC during 1 h) were more efficient in recovering the porosity of the samples. The regeneration treatment was more efficient in the case of the cloth and granular carbon that retained some porosity and approximately 50 % of the initial adsorption capacity up to the third reuse.
x
In regards to the study of bacteria adhesion of Escherichia coli cells in activated carbons, the results in Chapter IX reveal that the powdered carbon had a clear better performance removing up to 4log of cells per cm3 of suspension after 48 h of contact
time. The adhesion mechanism in this solid seems to occur in two stages: an initial adhesion favoured by attractive electrostatic interactions, and immobilization of bacteria cells due to the formation of carbon-cell-cell-carbon agglomerates. No adhesion of microorganisms occurred on the oxidized sample, suggesting that the establishment of initial repulsive interactions was sufficient to avoid colonization of the sample. The formation of cell + carbon structures was more difficult when the carbon particles were saturated with caffeine.
At last, in the study reported in Chapter X, tannin polymers obtained from Mimosa tree bark were characterized, and the potential of the materials as adsorbents of several organic compounds in aqueous phase was evaluated.
The use of higher surfactant amounts promoted the formation of wider mesopores and lower phenolic content. One of the samples was washed with a hydrochloric acid solution, and the treatment caused a slight widening of the mesopores with some porous volume loss, and without loss in phenolic content.
A detailed study of methylene blue adsorption in aqueous phase was performed, and then the materials were tested for the removal of a set of pharmaceutical compounds and a plasticizer, highly consumed worldwide. The two tested samples showed adsorbent properties removing up to a maximum amount of 152 mg g-1 of pollutant, in
equilibrium conditions. The good performance of the polymers was attributed at a great extent to the aromatic character of the materials. The molecular species with smaller molar volume, and with lower width were adsorbed in higher amounts suggesting a packing of the species in the polymers mesopores.
xiii
Acknowledgments……….………...v
Resumo………...………..vii
Abstract………..………ix
Index………...……….xi
Tables índex………….….………..……….xix
Figures índex………..…………...xxv
Abbreviations glossary………xxxiii
Symbols glossary……….………….xxxvii
Chapter I – Contextualization……….1
Chapter II – Objectives……….……5
Chapter III – Porous materials………8
III.1. Activated carbons………...……….10
III.1.1. Historical perspective………..………..……….10
III.1.2. Activated carbons structure………..…………...………..11
III.1.2.1. Physical structure…………..………11
III.1.2.2. Chemical structure………..………..12
III.1.3. Types of activated carbons………….………...…14
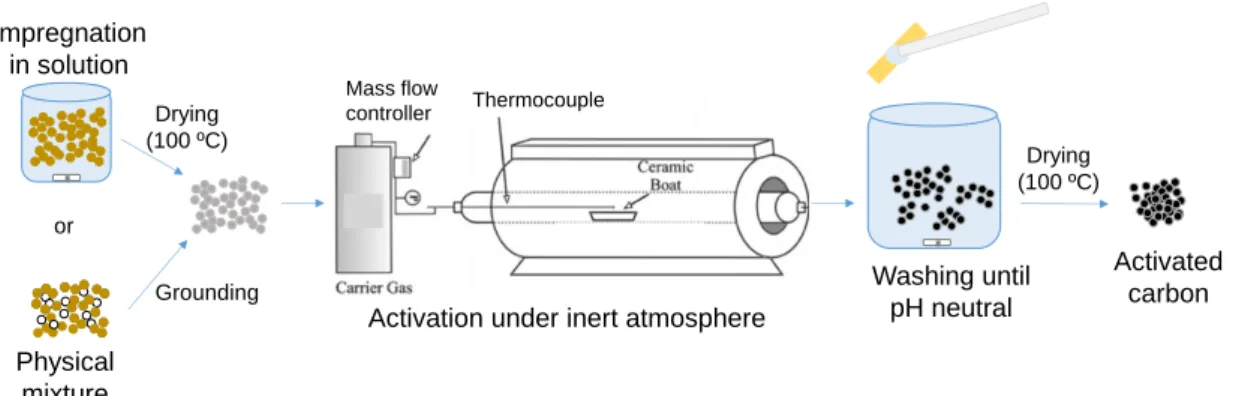
III.1.4. Preparation of activated carbons……….………...16
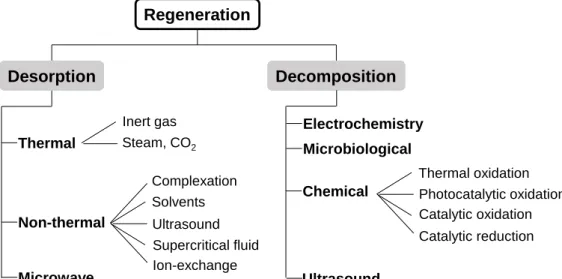
III.1.5. Regeneration………...20
III.1.6. Applications of activated carbons…….…………...…….………...24
III.2. Tannins………...………...………...25
III.2.1. Definitions and extraction……….………..25
III.2.2. Structure, classification and polymerization……….……...25
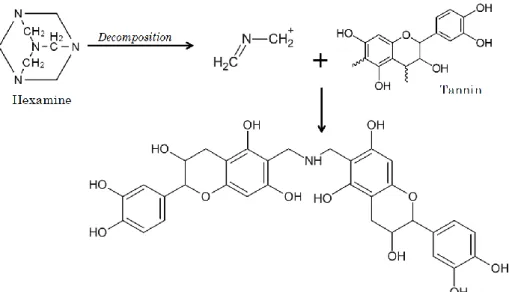
III.2.3. High Internal Phase Emulsion (HIPE).……….28 III.2.3.1. Polymer synthesis by High Internal Phase Emulsion (polyHIPE)….…29
| Index
To assess each index topic press CONTROL and click on the link
xiv
Chapter IV – Techniques for porous materials characterization………....…………31
IV.1. Characterization of porous structure………….…...……….33
IV.1.1. Adsorption of gases and vapors…………..………...…..33
IV.1.1.1. Types of adsorption……….……….………34
IV.1.1.2. Adsorption isotherms classification………..………..34
IV.1.1.3. Methods for adsorption isotherms analysis……….……….39
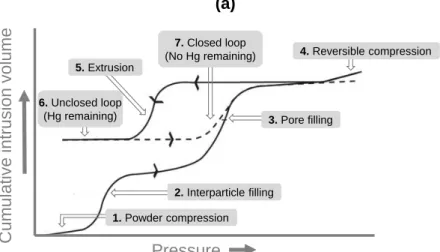
IV.1.2. Mercury intrusion porosimetry (MIP).………..……….44
IV.1.3. Density ……….47
IV.2. Chemical characterization ………...………….………48
IV.2.1. Elemental analysis and ash content……….48
IV.2.2. pH at the point of zero charge (pHPZC) and at the isoelectric point (pHIEP)……….49
IV.2.3. Fourier Transform Infrared Spectroscopy (FTIR)………...51
IV.2.4. Thermogravimetric Analysis (TGA)………...……...53
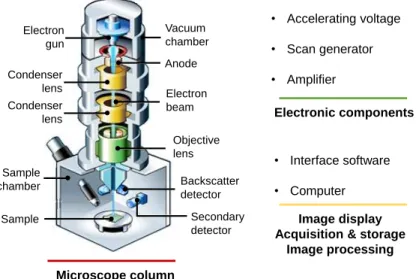
IV.2.5. Scanning Electron Microscopy (SEM)...………..54
IV.2.6. X-ray Diffraction (XRD)…...………...56
IV.2.7. X-ray Photoelectron Spectroscopy (XPS)………...…57
IV.2.8. Contact angle measurements………...58
Chapter V – Liquid phase adsorption……….60
V.1. Adsorption kinetics………...………64
V.1.1. Pseudo-first order kinetic model……….65
V.1.2. Pseudo-second order kinetic model………..66
V.2. Equilibrium adsorption………...………..67
V.2.1. Langmuir isotherm………...………68
V.2.2. Freundlich isotherm…...………..69
xv
V.3.1. Aquatic environment contamination by pharmaceutical compounds……...73
V.3.2. Pollutant compounds studied……….74
V.3.2.1. Analgesics/anti-inflammatories………74 V.3.2.2. Antibiotics………76 V.3.2.3. β-blockers………76 V.3.2.4. Cholesterol regulators………...76 V.3.2.5. Blood-lipid regulators……….77 V.3.2.6. Anti-acid medication………..77 V.3.2.7. Stimulant………….………...……….77 V.3.2.8. Plasticizers……….……….78
Chapter VI – Adhesion of faecal coliform bacteria on activated carbons……….………..………..79
VI.1. Faecal coliform bacteria in the environment………....81
VI.2. Escherichia coli……...………...……….82
VI.2.1. Escherichia coli, a biological drinking water indicator………82
VI.3. Bacteria adhesion…...………....83
VI.3.1. E coli cell and role of surface structures in adhesion to abiotic surfaces...85
Chapter VII – Wood-based activated carbons for adsorption of pharmaceuticals from aqueous solution……….…...………..87
VII.1. Experimental procedure………..………..89
VII.1.1. Preparation and characterization of activated carbons…………..……….89
VII.1.2. Material’s characterization techniques, liquid phase adsorption, molecular modelling and desorption experiments……….……….89
VII.2. Results and discussion………..………90
VII.2.1. Optimization of the activation conditions...….………90
VII.2.2. Characterization of the adsorbents………….…...……….92
| Index
To assess each index topic press CONTROL and click on the link
xvi
VII.2.4. Atenolol thermal desorption……….………...……...102
VII.2.5.Adsorption of tiamulin hydrogen fumarate…………...…..………..107
VII.3. Partial conclusions………..……….113
Chapter VIII – Pharmaceuticals removal by activated carbons: Role of morphology on cyclic thermal regeneration ……….………..……….115
VIII.1. Experimental procedure………….………….………..117
VIII.1.1. Materials……….………...………..117
VIII1.2. Material’s characterization techniques, and liquid phase adsorption and thermal regeneration experiments……….………..…117
VIII.2. Results and discussion………..………118
VIII.2.1. Characterization of the adsorbents………..………....118
VIII.2.2. Adsorption of paracetamol and clofibric acid…………..………124
VIII.2.3. Role of morphology on thermal cyclic regeneration of paracetamol- -exhausted carbons………129
VIII.3. Partial conclusions………..………134
Chapter IX – Escherichia coli immobilization on activated carbons: Impact of immobilization conditions and role of morphology……….135
IX.1. Experimental procedure…………..……….137
IX.1.1. Preparation and characterization of activated carbons………..137
IX.1.2. Immobilization experiments………138
IX.2. Results and discussion……….………...139
IX.3. Partial conclusions……….…………..……….………...146
Chapter X – Tannin-based materials for water remediation: Adsorption mechanism and removal of Pharmaceutical and Personal Care Products (PPCPs) from aqueous phase………148
X.1. Experimental procedure………..………..150
X.1.1. Preparation of the tannin-based powders……….…….150
xvii
X.2. Results and discussion……..………151
X.2.1. Characterization of the adsorbents……….…151
X.2.2. Adsorption of methylene blue………..156
X.2.3. Adsorption of Pharmaceutical Compounds and Personal Care Products (PPCPs)………...158
X.3. Partial conclusions………..……...………163
Chapter XI. Final conclusions………..………….………...164
Chapter XII. Bibliographic references..…………..………...168 Appendix A. Experimental procedures..…………..………...I A.1. Development of porous materials………III A.1.1. Preparation of the apple tree branches biochar...……….III A.1.2. Preparation of wood biochar derived activated carbons by chemical activation……….III A.1.3. Preparation of the activated carbon cloth (ACC)………..IV A.1.4. Preparation of of tannin-based monoliths powders………..IV A.2. Characterization techniques……..………..V A.2.1. N2 adsorption at -196 ºC....………..………V
A2.2. CO2 adsorption at 0 °C ……….V
A.2.3. Water vapor adsorption at 20 ºC…..……….………….VI A.2.4. Mercury intrusion…...…………...………VI A.2.5. Scanning Electron Microscopy (SEM)…..……….VI A.2.6. X-ray Photoelectron Spectroscopy (XPS)...…..………VI A.2.7. X-ray Powder Diffraction (XRD)…………..……….……….VII A.2.8. pH at the point of zero charge (pHPZC)………. .VII
A.2.9. Contact angle measurements..………VIII A.2.10. Phenolic groups content determination………..………..VIII A.2.11. Elemental analysis..………...………...IX
| Index
To assess each index topic press CONTROL and click on the link
xviii
A.2.12. Determination of volatile matter content……..………IX A.2.13. Determination of ash content……….…...………IX A.2.14. Density measurements………..……….………...X A.2.15. Fourier transform infrared spectroscopy (FTIR).……….X A.2.16. Thermogravimetric analysis (TGA)………...…………X A.2.17. Cyclic thermal regeneration treatments………...………...XI A.3. Liquid phase experiments..……...………..XI A.3.1. Pollutants studied………..………...XI A.3.2. Aqueous phase adsorption………..…….XIII A.3.3. Bacteria immobilization assays………...……..XV A.3.3.1. Strain and culture conditions……….……..XV A.3.3.2. Immobilization of E. coli onto the carbon materials……….….…XV A.3.3.3. Quantification of E. coli and caffeine……….……..XV A.3.3.4. Optical and phase-contrast microscopy……….……..XVI A.4. Appendix A references………..XVI Appendix B. Experimental results..…………..………...XVIII B.1. N2 adsorption at -196 °C……….………XX
B.2. CO2 adsorption at 0 °C………..………XXVIII
B.3. Mercury porosimetry………XXXI B.4. Liquid phase adsorption..……….XXXV Appendix C. National and international scientific conferences...XXXVII Appendix D. Publications in international journals with scientific arbitrage………...LXXIV
xxi Table III.1. Examples of industrial application of activated carbons, in liquid and gaseous phases………... 24 Table IV.1. Different properties of physical and chemical adsorption………..34 Table IV.2. Examples of IR absorption bands and corresponding assignments………53 Table V.1. Parameters affecting the extension of adsorption in solution……..………….63 Table VII.1. Materials prepared and commercial adsorbents studied in Chapter VII and detailed information regarding their preparation and/or provenance…….…89 Table VII.2. Experimental procedures of the characterization techniques employed in Chapter VII, liquid phase adsorption, molecular modelling and desorption experiments………..……….90 Table VII.3. Lab-made samples, corresponding preparation yield, and volatile
content……….………..91 Table VII.4. Nanotextural properties of the lab-made carbons and corresponding pHPZC
values…..……….………..95 Table VII.5. Pseudo-second order parameters for atenolol adsorption onto the studied samples at 30 °C.……..……….100 Table VII.6. Fitting parameters of atenolol equilibrium data to the Langmuir and Freundlich models, coefficient of correlation, and chi-square test analysis………...……..………...101 Table VII.7. Percentage of final weight of atenolol and pristine carbons………104 Table VII.8. Percentage of final weight of atenolol-exhausted carbons and corresponding DTG peaks………...106 Table VII.9. Activation energy of desorption, pre-exponential factor, and correspondent correlation coefficients…..……….………107 Table VII.10. Pseudo-second order parameters for fumaric acid and tiamulin hydrogen fumarate adsorption onto the studied samples at 30 °C………...…….108 Table VIII.1. Activated carbons studied in Chapter VIII and information regarding their preparation and/or provenance…...………..117 Table VIII.2. Experimental procedures of the characterization techniques employed in Chapter VIII, and liquid phase adsorption and regeneration experiments performed..……….……….118 Table VIII.3. Nanotextural properties of the lab-made carbons………119 Table VIII.4. XPS atomic percentages for samples ACC, NS and GAC………122 Table VIII.5. Pseudo-second order pharmaceutical compounds adsorption parameters for the studied carbon samples at 30 °C……….…..………..125 Table VIII.6. Molecular struture, chemical properties, and dimensions of the pollutants paracetamol and clofibric acid………...………...126
Tables index |
To assess each index topic press CONTROL and click on the link
xxii
Table VIII.7. Fitting parameters of paracetamol and clofibric acid equilibrium data to the Langmuir and Freundlich models, coefficient of correlation, and chi-square test analysis………...………..……128 Table VIII.8. Nanotextural properties of the fresh activated carbons, samples heated at 400 ºC and 600 ºC and obtained after the 3rd re-use……..……….……….133 Table IX.1. Activated carbons studied in Chapter IX and information regarding their preparation and/or provenance………..………..137 Table IX.2. Parameters studied in the E. coli’s removal by activated carbons assays, and the corresponding experimental conditions used………….………..138 Table X.1. Experimental procedures of the characterization techniques employed in Chapter X………....……….150 Table X.2. Experimental procedures of the liquid phase adsorption experiments…….151 Table X.3. Elemental analysis and pHPZC values of Mimosa bark of the tannin-based
powders………...………....152 Table X.4. Total phenol content of the materials, obtained by the Folin-Ciocalteu method..………...153 Table X.5. Pseudo-second order parameters for the methylene blue adsorption onto the studied adsorbents, at 30 ºC………...…..157 Table A.1. Experimental conditions used for the calibration plot of tannic acid…………IX Table A.2. Compounds studied, their abbreviation, reagents brand, solution preparation information and solution pH………..XI Table A.3. Chemical properties of the pharmaceutical compounds studied………XII Table A.4. Wavelengths used for the quantification of thecompounds by UV-Vis spectroscopy………...XIV Table B.1. N2 adsorption and desorption data, at– 196 °C, of carbon CA(1:3/700/2)….XX Table B.2. N2 adsorption and desorption data, at– 196 °C, of carbon CA(1:3/800/1)….XX Table B.3. N2 adsorption and desorption data, at– 196 °C, of carbon CA(1:3/800/2)….XX Table B.4. N2 adsorption and desorption data, at– 196 °C, of carbon CA(1:3/800/3)…XXI Table B.5. N2 adsorption and desorption data, at– 196 °C, of carbon CA(1:3/800/4)…XXI Table B.6. N2 adsorption and desorption data, at– 196 °C, of carbon CA(1:4/800/1)…XXI Table B.7. N2 adsorption and desorption data, at– 196 °C, of carbon CA(1:4/800/2)..XXII Table B.8. N2 adsorption and desorption data, at– 196 °C, of carbon CA(1:4/800/4)..XXII Table B.9. N2 adsorption and desorption data, at– 196 °C, of carbon HA(1:3/800/1)..XXII Table B.10. N2 adsorption and desorption data, at– 196 °C, of carbon
HA(1:3/800/2)………XXIII Table B.11. N2 adsorption and desorption data, at– 196 °C, of carbon
xxiii Table B.12. N2 adsorption and desorption data, at– 196 °C, of carbon
HA(1:3/800/4)………XXIII Table B.13. N2 adsorption and desorption data, at– 196 °C, of carbon NS…………..XXIV Table B.14. N2 adsorption and desorption data, at– 196 °C, of carbon CP…………..XXIV Table B.15. N2 adsorption and desorption data, at– 196 °C, of carbon ACC…………XXIV Table B.16. N2 adsorption and desorption data, at– 196 °C, of carbon VP…………..XXV Table B.17. N2 adsorption and desorption data, at– 196 °C, of carbon GAC830……..XXV Table B.18. N2 adsorption and desorption data, at– 196 °C, of carbon GACm………XXV Table B.19. N2 adsorption and desorption data, at– 196 °C, of carbon NSox……….XXVI Table B.20. N2 adsorption and desorption data, at– 196 °C, of carbon
ACCsat/600………..XXVI Table B.21. N2 adsorption and desorption data, at– 196 °C, of carbon ACC/400……XXVI Table B.22. N2 adsorption and desorption data, at– 196 °C, of carbon GAC/400…..XXVII Table B.23. N2 adsorption and desorption data, at– 196 °C, of carbon GAC/600…..XXVII Table B.24. N2 adsorption and desorption data, at– 196 °C, of carbon
GACsat/400……….XXVII Table B.25. N2 adsorption and desorption data, at– 196 °C, of carbon
GACsat/600……… XXVIII Table B.26. CO2 adsorption data, at 0 ºC, of carbon CA(1:3/700/2)………..XXVIII Table B.27. CO2 adsorption data, at 0 ºC, of carbon CA(1:3/800/1)………..XXVIII Table B.28. CO2 adsorption data, at 0 ºC, of carbon CA(1:3/800/2)………XXIX Table B.29. CO2 adsorption data, at 0 ºC, of carbon CA(1:3/800/4)……….XXIX Table B.30. CO2 adsorption data, at 0 ºC, of carbon CA(1:4/800/1)……….XXIX Table B.31. CO2 adsorption data, at 0 ºC, of carbon HA(1:3/800/1)...XXX Table B.32. CO2 adsorption data, at 0 ºC, of carbon HA(1:3/800/2)………..XXX Table B.33. Mercury porosimetry data of 2M sample………..XXXI Table B.34. Mercury porosimetry data of 5M sample……….XXXII Table B.35. Mercury porosimetry data of 8M sample………XXXIII Table B.36. Mercury porosimetry data of 5AM sample……….XXXIV Table B.37. Kinetic data of paracetamol adsorption, at 30 °C, on the carbons…….XXXV Table B.38. Kinetic data of clofibric acid adsorption, at 30 °C, on the carbons…….XXXV Table B.39. Kinetic data of atenolol adsorption, at 30 °C, on the commercial carbons..………..XXXV Table B.40. Kinetic data of atenolol adsorption, at 30 °C, on the lab-made
carbons…….………...XXXV Table B.41. Kinetic data of tiamulin hydrogen fumarate adsorption, at 30 °C, on the
Tables index |
To assess each index topic press CONTROL and click on the link
xxiv
Table B.42. Kinetic data of tiamulin hydrogen fumarate adsorption, at 30 °C, on the lab- -made carbons………...XXXVI Table B.43. Kinetic data of methylene blue, at 30 °C, on the tannin-based powders………..XXXVI Table B.44. Equilibrium data of paracetamol adsorption, at 30 °C, on the commercial
carbons………..………...…..XXXVI Table B.45. Equilibrium data of clofibric acid adsorption, at 30 °C, on the carbons………..XXXVII Table B.46. Equilibrium data of tiamulin hydrogen fumarate adsorption, at 30 °C, on the
commercial carbons……….XXXVII Table B.47. Equilibrium data of tiamulin hydrogen fumarate adsorption, at 30 °C, on the lab-made carbons……….XXXVII
xxvii Figure III.1. Illustration of charcoal and activated carbons uses and manufacture, throughout history………...………10 Figure III.2. Schematic representation of activated carbon microstructure and porous structure……….11 Figure III.3. Examples of oxygen and nitrogen functional groups possibly present
at the surface of the activated carbons……….….13 Figure III.4. Increase of activated carbon hydrophilic character (introduction of oxygenated groups) can cause blockage of the micropores due to water adsorption……….13 Figure III.5. Different morphologies of activated carbon………15 Figure III.6. Scheme of the porosity location in a granular activated carbon and an activated carbon fibre………...16 Figure III.7. General procedure for the production of activated carbons…………16 Figure III.8. General experimental procedure for preparing activated carbons by chemical activation………19 Figure III.9. Schematic representation of the basic regeneration techniques available for the recovery of spent adsorbents………21 Figure III.10. Tannin classification and examples of structures……….26 Figure III.11. Possible monoflavonoids structures, depending on the number of hydroxyl groups of A and B rings……….26 Figure III.12. Possible linkages between catechin units, in condensed tannins………..27 Figure III.13. Example of reaction between a tannin and an intermediate species formed by hexamine decomposition………28 Figure III.14. Illustration of tannin-based polymers preparation procedures………29 Figure IV.1. Illustration of adsorption process………..33 Figure IV.2. IUPAC classification of physical adsorption isotherms………..35 Figure IV.3. Types of isotherms usually obtained with activated carbons………36 Figure IV.4 Illustration of capillary condensation phenomenon in slit-shaped pores…..37 Figure IV.5. Illustration of adsorption and desorption in bottle-shaped pores………….38 Figure IV.6. IUPAC classification of the different types of hysteresis cycles………38 Figure IV.7. Representations of t or αS curves for different types of adsorbents………43 Figure IV.8. Adsorption isotherms of microporous adsorbents and correspondent αS
theoretical curves……….……….44 Figure IV.9. Illustration of mercury entering a cylindrical pore under increasing pressure and mercury powder penetrometer………45
Figures index |
To assess each index topic press CONTROL and click on the link
xxviii
Figure IV.10. Illustration of intrusion-extrusion mercury cycles and description of the different mechanism stages……….46 Figure IV.11. Representation of the intrusion volume derivative as function of pore diameter……….47 Figure IV.12. Representation of the volumes considered for the absolute, apparent and
global densities………..47 Figure IV.13. Macroscopic representation of the amphoteric behaviour of an activated carbon surface chemistry……….49 Figure IV.14. Energy levels and possible energy absorption transitions and infrared spectra divided in constituent regions………51 Figure IV.15. Schematic illustration of TG and DTG curves profile………54 Figure IV.16. Schematic illustration of a scanning electron microscope and its several components………...55 Figure IV.17. Representation of Bragg’s law………57 Figure IV.18. Schematic representation of an X-ray photoelectron spectrometer……..58 Figure IV.19. Contact angle measurement: goniometer and sessile drop measurement schematics……….59 Figure V.1. Illustration of the several stages of adsorption process in liquid phase…..65 Figure V.2. Adsorption isotherms more frequently obtained for the adsorption of diluted aqueous solutions in carbonaceous materials………..67 Figure V.3. Schematic layout of a WWTP from Huntsville, Unites States………70 Figure V.4. Schematic diagrams of WWTPs where activated carbon are used………..71 Figure V.5. Schematic representation of the main methodologies employed in drinking water treatment plants and indication of the stages where activated carbon can be employed………...72 Figure VI.1. Conceptual diagram of bacteria spreading throughout the environment…81 Figure VI.2. Example of Escherichia coli cells………..82 Figure VI.3. Development stages of biofilm formation……….83 Figure VI.4. Simplified interaction model between activated carbon, microorganism and
contaminant, in a water treatment scenario………..84 Figure VI.5. Escherichia coli cellular structures………85 Figure VII.1. Comparison graphics to evaluate the impact of activation temperature and that of biochar fraction on K2CO3 activated samples preparation yield and
xxix Figure VII.2. Comparison graphics to evaluate the impact of the impregnation proportion and of the activating agent used on the preparation yield and volatile content of the carbons………92 Figure VII.3. Nitrogen adsorption-desorption isotherms at -196 °C of the carbons activated with K2CO3 and KOH, as well as the commercial samples
studied………....93 Figure VII.4. CO2 adsorption isotherms, at 0 °C, of the lab-made samples and
commercial carbons……… ……….96 Figure VII.5. Micropore size distribution, obtained from the CO2 adsorption data, of the
K2CO3 activated carbons and KOH activated and commercial carbons…...97 Figure VII.6. SEM micrographs of the lab-made carbons………98 Figure VII.7. Kinetic results for the adsorption of atenolol in the activated carbons, at
30 °C………...…………99 Figure VII.8. Molecular structure of atenolol species and corresponding dimensions, and
pKa value. Illustration of atenolol access to the micropores……….100 Figure VII.9. Atenolol adsorption isotherms of the mentioned carbons, at 30 °C……..101 Figure VII.10. Thermogram of atenolol and corresponding DTG curve………..103 Figure VII.11. Thermograms of the pristine adsorbents and corresponding DTG curves…..……….103 Figure VII.12. Thermograms of the atenolol-exhausted adsorbents, at 5, 10 and
20/K min..……….104 Figure VII.13. DTG profiles of the pristine and atenolol-exhausted carbons at heating rates of 5, 10 and 20 K min-1..………105 Figure VII.14. Kinetic results for the adsorption of fumaric acid and tiamulin hydrogen fumarate in the mentioned carbons, at 30 °C……….108 Figure VII.15. Correlation between the initial adsorption velocity, and the sum of the meso and supermicropores volumes of the mentioned carbons……....….109 Figure VII.16. Molecular structure of tiamulin and corresponding dimensions, and pKa
value. Illustration of tiamulin access to the micropores……….109 Figure VII.17. Kinetic results for the adsorption of atenolol and tiamulin hydrogen
fumarate in the mentioned carbons, at 30 °C………..110 Figure VII.18. Equilibrium adsorption isotherms of fumaric acid and tiamulin hydrogen
fumarate, on the lab-made carbons, at 30 °C……….111 Figure VII.19.Correlation between the difference in maximum uptake values obtained for FA and THF adsorption, and the volume of meso and supermicropore of the materials………113
Figures index |
To assess each index topic press CONTROL and click on the link
xxx
Figure VIII.1. Nitrogen adsorption-desorption isotherms at -196 °C of the mentioned samples………118 Figure VIII.2. CO2 adsorption isotherms at 0 °C of the mentioned carbons…………..120 Figure VIII.3. Micropore size distributions of the mentioned samples obtained from the CO2 adsorption data, at 0 ºC……….120 Figure VIII.4. SEM micrographs of the ACC surface and a cross-section and longitudinal surfaces………121 Figure VIII.5. XPS survey spectra for the mentioned samples………122 Figure VIII.6. Deconvoluted high-resolution C 1s and O 1s XPS spectra for the
mentioned samples………123 Figure VIII.7. X-ray diffraction patterns of the ashes of the carbons GAC and NS…..124 Figure VIII.8. Kinetic results of paracetamol and clofibric acid adsorption, at 30 ºC for the carbon samples………124 Figure VIII.9. Correlation between the critical dimensions of the pollutants species in solution and the micropore size distribution of the carbons, previously presented in Figure VIII.3………..127 Figure VIII.10. Adsorption isotherms of paracetamol and clofibric acid onto the mentioned carbons, at 30 °C……….127 Figure VIII.11. Thermograms of the raw and exhausted carbons and corresponding DTG curves………...130 Figure VIII.12. Thermogram of paracetamol………..130 Figure VIII.13. Nitrogen adsorption-desorption isotherms at -196 ºC of samples heated in the absence of adsorbate, and samples obtained after the 3rd regeneration
cycle at the temperature indicated………132 Figure VIII.14. Regeneration efficiency of samples ACC, NS and GAC, for consecutive re-uses after regeneration by thermal treatment at 400 ºC and 600 ºC for 1 h……….133 Figure IX.1. E. coli removal, in STD water, by the mentioned carbons, after 24 and
48 h….. ………139 Figure IX.2. E. coli removal, in STD water, by the mentioned carbons………..139 Figure IX.3. E.coli removal after 24 and 48 h, by the powder, cloth and granular carbons, in STD water………140 Figure IX.4. Impact of solution chemical composition on E. coli removal from solution by 10 mg, 50 mg and 150 mg of NS……….141 Figure IX.5. Effect of presence of caffeine on E. coli cells removal……….143 Figure IX.6. Effect of carbon dosage on cellular suspensions of approximately 8log cells/ml solution; 6log cells/ml solutionand 5log cells/ml solution………..144
xxxi Figure IX.7. Comparison of the removal efficiencies achieved by each carbon amount in the cellular suspensions……….144 Figure IX.8. Optical microscopy of NS carbon in cellular suspensions standardized at 8log cells cm-3, viewed with amplifications of 40, 400 and 1000×…………145 Figure IX.9. Frames obtained with an amplification of 1000x of a carbon aggregate formed after 30 min of contact between cellular suspension and carbon. .146 Figure X.1. Mercury porosimetry: intrusion isotherms and pore diameter distributions of the tannin-based powders……….151 Figure X.2. Sorption isotherms of water on the mentioned samples………..153 Figure X.3. Water contact angle measurements at the surface of the dried monoliths pellets………...………153 Figure X.4. FTIR spectra of the tannin powders…..………..154 Figure X.5. Thermogravimetric analysis of the tannin powders……….….155 Figure X.6. Comparison of TG of activated carbons studied in Chapter VII and VIII with the tannin-based polymers………155 Figure X.7. Kinetic data of MB adsorption………..156 Figure X.8. Correlation between the phenolic group content of the samples and the initial adsorption rate and MB amount adsorbed after 4 h of contact time…..….157 Figure X.9. Equilibrium isotherms of MB adsorption……….158 Figure X.10. Uptake results for the mentioned PPCPs by samples 5M and 5AM, at
30 ºC after 8 h of contact time………..….159 Figure X.11. Correlation between molar volume of the PPCPs species and 5M uptakes and the thickness of the pollutants and 5AM results…………..……….159 Figure X.12. FTIR spectra of the studied compounds, and of the pristine and spent 5M samples………..…. 160 Figure X.13. Atenolol, paracetamol and ibuprofen uptake values for the mentioned samples………..….162 Figure A.1. Preparation of the biochar……….…..III Figure A.2. Representation of the activated carbons preparation stages…...…….…….III Figure A.3. Scheme of the automatic apparatus ASAP 2010……..……….……..V Figure A.4. Conventional volumetric installation used to perform the CO2 adsorption
experiments……….V Figure A.5. Schematic representation of pHPZC measurement procedures……..…….VIII Figure A.6. Heating regime for ash content determination………..X Figure A.7. Representation of the experimental procedure adopted for liquid phase adsorption experiments……….….XIV
Figures index |
To assess each index topic press CONTROL and click on the link
xxxii
Figure A.8. Representation of the experimental procedure adopted for the bacteria immobilization experiments……….……...XV Figure A.9. Representation of the experimental procedure adopted for the quantification of cell concentration remaining in solution……….……..XVI
Abbreviations
glossary
xxxv
AC Activated Carbon ACC Activated Carbon Cloth ACF Activated Carbon Fibre ACM Activated Carbon Monolith ACS Activated Carbon Sheet AT Atenolol
ATORV Atorvastatin
BAC Biological Activated Carbon
BDDT Brunauer, Deming, Deming and Teller BET Brunauer, Emmet and Teller
BPA Bisphenol A CAF Caffeine
CFU Colony-forming units CLOF Clofibric acid
DCF Diclofenac
DTG Thermogram derivative DR Dubinin-Radushkevich
E. coli Escherichia coli
EDS Energy-dispersive Spectroscopy EPA Environmental Protection Agency
ESVAC European Surveillance of Veterinary Antimicrobial Consumption ETA Equivalents of Tannic Acid
F Freundlich
FA Fumaric acid
FDA Food and Drug Administration FT Fourier Transform
FTIR Fourier Transform Infrared spectroscopy GAC Granular Activated Carbon
H High-affinity
HIPE High Internal Phase Emulsion IBP Ibuprofen
IEP Isoelectric Point IR Infrared
ISO Internation Organization for Standardization
IUPAC International Union for Pure and Applied Chemistry
Abbreviations glossary |
xxxvi
LPS Lipopolysaccharides MB Methylene Blue MBR Membrane filtration NOM Natural Organic Matter
NSAID Nonsteroidal anti-inflammatory PAC Powder Activated Carbon PARA Paracetamol
PolyHIPE Polymerized High Internal Phase Emulsion PPCPs Pharmaceutical and Personal Care Products PZC Point of Zero Charge
RAN Ranitidine
S Sigmoid
SEM Scanning Electron Microscopy SOC Synthetic Organic Chemical TC Tetracycline hydrochloride
TG Thermogram
TGA Thermogravimetric Analysis THF Tiamulin hydrogen fumarate T&O Taste and odour
VC Volatile content
WHO World Health Organization WWI World War I
WWTP Wastewater treatment plant XPS X-ray Photoelectron Spectroscopy XRD X-ray Diffraction
Symbols
glossary
xxxix
A Adsorption potential 42
A Pre-exponential Arrhenius factor 106
ABET Specific surface area determined by the BET method 39
am(N2)
Average area occupied by nitrogen (adsorbate) molecule in the monolayer
40
b Interception at the plot origin 40
B Constant independent of the temperature and characteristic of the adsorbent porous structure, obtained by the DR equation
41
C0 Initial solute concentration 107
CBET BET constant 40
Ce Solute concentration at equilibrium 68
Ct Solute concentration at time t 107
D Pore diameter 46
d Interplanar spacing of a crystal, according to Bragg’s law 56
E0 Characteristic energy of adsorption, determined by the DR equation 41
Edes Activation energy of desorption 106
ΔG Variation of Gibbs free energy 33
h Initial adsorption rate, determined by the pseudo-second order kinetic
equation
66
ΔH Variation of enthalpy 33
k1 Pseudo-first order rate constant 66
k2 Pseudo-second order rate constant 66
KF Freundlich constant 69
KL Langmuir constant 68
L0 Mean pore width 41
m Plot slope 40
MW Molecular weight 126
N Avogadro constant 40
n Order of reflection, according to Bragg’s law 56
n Freundlich exponent 69
nads Adsorbed amount at pressure p 33
nm Amount adsorbed on the monolayer 40
P Applied pressure 33
p Equilibrium pressure of the adsorptive at the experiment temperature 40
p0 Saturation pressure of the adsorptive at the experiment temperature 33
Symbols glossary |
xl
pHPZC pH at the point of zero charge 49
pKa Acidic constant 63
p/p0 Relative pressure of the adsorptive at the experiment temperature 33
qe Amount of solute adsorbed in equilibrium 66
qe, calc Amount of solute adsorbed calculated by the pseudo-second order
kinetic model
99
qe, exp Amount of solute adsorbed experimentally obtained 99
qm Monolayer adsorption capacity 68
qt Amount of solute adsorbed at time t 66
R Ideal gas constant 37
r Meniscus radius formed in capillary condensation 37
R2 Determination coefficient 101
RE Regeneration efficiency 133
rK Kelvin radius 37
ΔS Variation of entropy 33
t1/2 Half-life time obtained by the pseudo-second order kinetic equation 66
T Temperature 33
TA Temperature value close to room temperature in TGA 54
TB Temperature at which weight loss starts to occur in TGA 54
TC Temperature after which the sample mass remains constant in TGA 54
TD Temperature at which a higher weight change occurs in TGA 54
V Molar volume in Kelvin equation 37
Vmeso Mesopore volume 94
Vmol Molar volume 159
Vα super Total supermicropore volume determined by the αS method 94
Vtotal Total pore volume (volume adsorbed at p/p0 = 0.95) 94
Vα total Total micropore volume determined by the αS method 94
Vα ultra Total ultramicropore volume determined by the αS method 94
W0, VDR Micropore volume determined by DR equation 41
Wads Volume occupied by the adsorbed phase 41
Wfinal Final sample height in TGA 104
Β Affinity coefficient 41
Β TGA heating rate 106
ɣ Liquid-vapour interfacial surface tension 37
σt Average thickness of a single monolayer, determined by the t method 43
xli
θ1 Angle formed by the intersection of the liquid-solid interface and the
liquid-vapour interface
59
λ Radiation wavelength 56
η Global preparation yield 90
Chapter I
Contextualization
3
Activated carbons are adsorbent materials with a versatile field of applications, due to their structural, surface chemistry properties, and also because they are easily adapted to the requirements of their application. One of the activated carbons most common applications is in water remediation. However, the high production costs of these materials constitute a barrier to their broad application. One solution for this limitation is the use of low-cost precursor materials. In this context, the use of biomass wastes, namely of agricultural and industrial origin have shown great potential as precursors for the preparation of activated carbons, with a developed porosity, and advantageous from an economic point of view (Pap et al., 2017; Kopac et al., 2016; Moloukhia et al., 2016; Yu et al., 2016; Dias et al., 2007; Ioannidou and Zabaniotou, 2007; Menéndez‐Diaz and Martín‐Gullón, 2006)
Considering aquatic pollution, in the last decades, the detection of numerous compounds belonging to the class of pollutants designated Pharmaceutical and Personal Care Products (PPCPs) has raised a special concern among the scientific community. The reason for this is the fact that the development of medical care, for humans and animals, has led to the production of increasingly more effective pharmaceutical active ingredients such as lipid-regulating drugs, analgesics, antibiotics, antiseptics, hormones, and chemotherapy and beta-blocking heart drugs. Even though regulation rules have been enforced by Food and Drug Administration (FDA) to minimize PPCPs consumption (Aminoshariae and Khan, 2015), in 2014, the worldwide consumption of medicines containing these active ingredients reached around 15 g values per capita and, in industrialized countries the value increased to 50-150 g (Yang et al., 2017; Daughton, 2002). After administration, a large amount of these compounds is excreted by the human body partially or completely un-metabolized, resulting in the continuous release of a wide variety of pharmaceutical active ingredients, their metabolites and transformation products into the sanitation systems (Zwiener et al., 2001). Moreover, the detection of PPCPs in sub-therapeutical concentrations in surface and subterranean waters has also raised concerns about the efficiency of the conventional treatments used in wastewater treatment plants (WWTPs). In the particular case of pharmaceutical compounds, their presence has been detected in influents and effluents of WWTPs García et al., 2014; Afonso-Olivares et al., 2012). Consequently these pollutants are continuously released to the aquatic environment, being detected in lakes and rivers (Azuma et al., 2017; Mandaric et al., 2017; Yang et al., 2017; Lin et al., 2016; Oliveira et
al., 2015; Carmona et al., 2014), and reaching drinking water treatment plants (Yang et al., 2017).
Several studies have demonstrated the efficiency of the use of lab-made and commercial activated carbons for the removal of pharmaceutical compounds in aqueous phase, namely the studies developed in the research facility where this PhD thesis was developed (Batista et al., 2016; Galhetas et al., 2015, 2014a, and 2014b; Mestre et al., 2016, 2015, 2014a, 2014b, 2012, 2011). Taking into account the production costs of activated carbons, the use of adsorbents prepared from low-cost materials, such as wood bark, that allow to obtain activated carbons with adequate properties to adsorption, is a fundamental and important theme of investigation for their sustainable application in water treatment.
Bacteria adhesion is deeply considered in the scenario of water treatment where activated carbons are applied in the granular (in columns) and powder (in a batch reactor) forms, in several stages of the water treatment process. This phenomenon can have positive and/or negative impact on water treatment depending of the purpose the
Chapter I | Contextualization
4
solids application. One example is the so-called biological activated carbon (BAC) that is prepared by controlled colonization of activated carbons, usually in the granular morphology. The use of BAC allows for an increase of the carbon life time, in comparison to the use of pristine material, by converting a portion of the recalcitrant organics into biodegradable matter (Korotta-Gamage SM and Sathasivan, 2017 Westphalen et al., 2016; Bautista-Toledo et al., 2014; Rivera-Utrilla et al., 2013). The microorganisms adhered at the carbon surface can also change the surface charge of the material, for example, to a more negative global charge enhancing the adsorption capacity towards positively charged species, such as, heavy metals.
On the other hand, spontaneous and long-term colonization of activated carbon during water treatment can prevent the adsorbent from removing the targeted pollutants from water, enabling its effectiveness.
Bacteria colonization of activated carbons has been reported in the literature, but the studies published are focused almost exclusively on granular solids (Qin et al., 2016; Borges, et al., 2016; Islam et al., 2016). In this context, besides evaluating the carbons adsorptive properties, an understanding of the material behaviour in a biologic environment is crucial prior to application for water remediation.
Tannins are polyphenolic biomolecules that occur naturally in vegetable tissues of many species of the Plant Kingdom, where their biological role is related to protection against fungi infections, insects predation, animal herbivory and perhaps even regulation of plant growth (Gross et al., 2012; Khanbabaee and van Ree, 2001).
Tannin-based polymer materials prepared by high internal phase emulsions, designated PolyHIPEs (Polymerized High Internal Phase Emulsions) are nowadays applied in numerous fields of material science, for example, for thermal insulation (Kovačič et al., 2012), molecular storage applications (Cooper et al., 2009), and for solid phase synthesis (Sadeghi and Moghbeli, 2012). These materials have also been used in biological and biomedical applications, namely as potential substrates for tissue engineering (Wang et al., 2016), and in other fields, such as, electrochemical sensing (Zhao et al., 2007).
The textural and chemical properties of these materials also make them good candidates as adsorbent materials. Their application in water decontamination is furthermore supported from an economic point of view given the easiness and cost efficiency of the PolyHIPEs materials preparation. However, in the literature few studies have been reported exploring this thematic, and even fewer have investigated the underlying mechanism of the pollutants retention in the polymers (Sieniawska and Baj, 2017; Sánchez-Martín et al., 2013a and 2013b).
Chapter II
Objectives
7
The research developed in this PhD thesis has as main objective a deep insight into the adsorption mechanism of several pharmaceutical and personal care compounds onto porous materials, which is of paramount importance to improve, water treatment purposes technologies. This process was approached from different perspectives, namely the preparation of activated carbons from a biochar from apple tree branches. The prepared solids proved to have potential to be used as adsorbents for atenolol adsorption and good results were also obtained in competitive adsorption conditions, in the case of tiamulin hydrogen fumarate medicine. The mechanism of atenolol thermal desorption from the solids was assessed and the chemical nature of the carbons revealed to be of great importance. The role of morphology on the adsorption of paracetamol and clofibric acid compounds, and cyclic thermal regeneration of paracetamol-exhausted samples were also evaluated. Other innovative perspective considered was the potential of ACs to immobilize/remove bacteria cells from solution and a complete study on the key role parameters and mechanism of immobilizations was performed. Results demonstrated a novel mechanism of immobilization onto the powder carbon consisting in the formation of agglomerates carbon-cell-cell-carbon. Finally, the adsorption mechanism of methylene blue onto tannin-based polymers was studied and screening adsorption experiments were carried out with a set of pharmaceutical compounds and personal care products, chosen by their high consumption and frequent detection in water decontamination.
Chapter III
Porous materials
Chapter III| Porous materials
10
III. 1. Activated carbons
III.1.1. Historical perspective
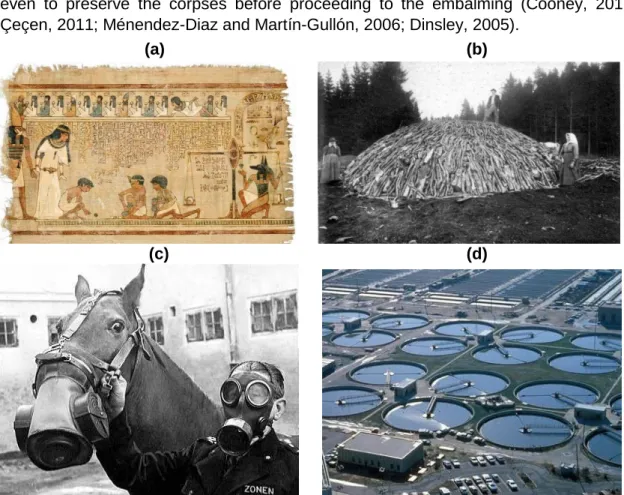
The exact first use of charcoal is not known, however, one of the oldest references to the use of charcoal for medicinal purposes was found in an Egyptian papyrus dating from 1550 B.C., where curiously the black pigment used to draw the illustration was also charcoal (see Figure III.1 (a)). The Egyptians also used it to fabricate bronze, adsorb odours, cure intestinal problems, fabricate beer, as pigment for makeup purposes, and even to preserve the corpses before proceeding to the embalming (Cooney, 2016; Çeçen, 2011; Ménendez-Diaz and Martín-Gullón, 2006; Dinsley, 2005).
Figure III.1. Illustration of charcoal and activated carbons uses and manufacture, throughout history: (a) Egyptian papyrus; (b) Charcoal kiln; (c) Gas mask in WWI; (d) water treatment plant.
Another interesting fact about charcoal, is the method by which it has been produced. For example, in the 19th century, the charcoal production was made in a conical pile of
logs with a fire shaft inside where the fire was set using, typically, wood chips. These structures, called kilns, were then covered with grass, moss and earth to reduce the flow of oxygen to a minimum (Figure III.1 (b)).
The first application of activated carbon in the industrial sector took place in England in 1794, when it was used as a decolorizing agent in the sugar production industry
(Ménendez-Diaz and Martín-Gullón, 2006). In the early 1900s, as the potential of these materials was becoming known, the first patent concerning activated carbons
production was granted to Raphael von Ostrejko (
http://speicyte.wixsite.com/raphael-von-ostrejko). At this time, the first plant to produce activated carbons (ACs) industrially
was built in Ratibor in the German Empire, now Raciborz (Poland) (Bandosz, 2016).
(a) (b)
11
Many other plants then emerged to produce activated carbons primarily for decoulorization.
During World War I (WWI), activated carbon was used in gas masks for protection against hazardous gases and vapours (see Figure III.1 (c)), which boosted the application of these adsorbents in several fields.
Nowadays, activated carbons are applied in an enormous variety of fields, such as water (see Figure III.1 (d)) and air treatment industry (Sulyman et al., 2017; Shammay
et al., 2016; Westphalen et al., 2016), petrochemical industry (Przepiórski, 2006; Lin et al., 2001), chemicals and gas purification (Brea et al., 2017), and even food and
beverage industries (Martínez-Romero et al., 2007). Activated carbons have for a long time been used in filters for protection equipment, namely gas masks, and even at present they have a key role in this field. ACs are also employed in other areas, such as, the metallurgy industry, for the recovery of metals, and in medicine, for wound care and in the maintenance of several medicinal products and consumables (Przepiórski, 2006).
III.1.2. Activated carbons structure
The high performance of the activated carbons in adsorption applications can be attributed to its physical and chemical properties, so the characterization of these materials is of paramount importance to understand their behaviour as adsorbents.
Activated carbons are characterized by an extensive pore network, formed essentially by graphitic layers interconnected in a complex and disorganized structure. Besides their highly developed porosity, these materials also present, at their surface, various functional groups resulting in a very rich surface chemistry, determinant to their interaction with the surrounding environment.
III.1.2.1. Physical structure
In terms of structure, activated carbons are composed by carbon atoms linked in condensed hexagonal aromatic rings, which constitute the so-called graphitic layers (see Figure III.2 (a)). These layers are interconnected by van der Waals forces and are disposed in a disorganized way, highly more disorganized than the graphite structure (Biscoe and Warren, 1964). Due to this randomised disposition of the graphitic layers, a high amount of interstices appear on the structure of the activated carbons (see Figure III.2 (a)), which may be occupied by disorganized carbonaceous matter, and also by inorganic matter (ash) originated from the starting material used as precursor.
(a) (b)
Figure III.2. Schematic representation of activated carbon (a) microstructure (adapted from