M
ASTER OF
S
CIENCE IN
FINANCE
M
ASTERS
F
INAL
W
ORK
DISSERTATION
D
IVERSIFICATION IN MULTI
-
ASSET PORTFOLIOS IN THE CONTEXT OF
THE
C
HINESE
R
EAL
E
STATE AND
S
TOCK
M
ARKET
DI
TANG
S
UPERVISOR(
S):
J
OÃOC
ARVALHO DASN
EVESACKNOWLEDGEMENT
Special thanks are due to Professor João Neves and Professor Inês Pinto for their great guidance during my study. Without their help, I could not possibly have completed this thesis.
I also want to express my gratitude to my family, especially my husband Xueqian Zhou, for their understanding, constant support, and endless care throughout the entire process of my study at Instituto Superior de Economia e Gestão, Universidade de Lisboa.
ABSTRACT
This study uses a single index model to examine the correlation between Chinese real estate and the stock market. The real estate market is reflected by 3 years’ monthly data of 13 listed real estate companies and the stock market is represented by Shanghai Composite index and Shenzhen Component index. According to the analysis, it is found that the correlation between the real estate and the stock market is in fact very low, and thus real estate is a good option for diversification is a multi-asset portfolio.
Contents
1. INTRODUCTION ... 4
1.1 Introduction to the Chinese real estate market and background of this study ... 4
1.2 Objectives of present study ... 6
2. LITERATURE REVIEW ... 8
2.1 The Modern Portfolio Theory and its evolution ... 8
2.2 Traditional methods for real estate investment portfolios ... 10
2.3 Foreign studies of Modern Portfolio Theory applied to real estate field ... 12
2.4 Applying the Modern Portfolio Theory to the Chinese real estate industry ... 15
2.5 Correlation between the real estate and the stock market ... 17
3 METHODOLOGY ... 21
3.1 Modern Portfolio Theory and single index model ... 21
3.2 Sampling interval and risk-free rate ... 23
3.3 Calculation of the variables ... 24
4 DATA ANALYSIS ... 26
4.1 Brief description of each stock ... 26
4.2 Calculation results ... 30
4.3 Analysis of the results ... 30
5 DIVERSIFICATION EFFECTS OF REAL ESTATE IN A MIXED ASSET PORTFOLIO FOR INSTITUTIONAL INVESTORS ... 36
5.1 Diversification effects ... 37
5.2 Diversification of property type and business model ... 38
5.3 Geographic diversification ... 39
5 CONCLUSION ... 42
REFERENCES ... 43
APPENDIX I: TABLES ... 48
Diversification in multi-asset portfolios in the context of the
Chinese real estate and stock market
1. INTRODUCTION
1.1 Introduction to the Chinese real estate market and background of this study
In the first 30 years after the foundation of China in 1949, no Chinese individual was entitled to own real estate properties as they were all state-owned, instead, the citizens only had to pay a symbolic amount of money for renting the houses. After the reformation of economic system started by the Chinese government in 1978 came along a 16-year-long initial stage of the Chinese real estate market, which was followed by a burgeoning decade
Owing to a number of sets of administrative and financial policies launched by the government in the last two decades intended to boost the real estate market to become one of the main industries contributing to the national economy, the Chinese real estate industry embraced a burgeoning period in the 90s and then a thriving era starting from the beginning of the 21st century. In 2013, according to the report of Chinese National Bureau of Statistics office, the total amount of investment in real estate reached 8.6 trillion Chinese Yuan (approximately 1.4 trillion USD), which increased 33.2% compared to 2012.
The boom of the Chinese real estate industry has made itself a major and popular option of investment for institutional and individual investors. According to a news of
National Bureau of Statistics of the People’s Republic of China, the average annual increase of real estate investment during the period of 1998 to 2013 has remained at about 20%, and in some of these this rate even reached 30% (2005, 2006, 2008, 2009 and 2010). However, besides the problems those usually come along with a fast growing real estate industry and bring both investing opportunities and risks, for instance, rapid increase of house prices and high rate of vacant houses (uninhabited apartments) in a number of places, the unevenness of real estate development across the country due mainly to the differences in local economy also adds to the uncertainty of investment returns. As a way to account for the regional unevenness of economic development across the country, The Chinese Bureau of Statistics broke down the data into 3 geographical regions by provinces (cities):
Eastern region: Beijing (city), Tianjin, Hebei, Liaoning, Shanghai (city), Jiangsu, Zhejiang, Fujian, Guangdong, and Hainan provinces
Middle region: Shanxi, Jilin, Heilong Jiang, Anhui, Jiangxi, Henan, Hubei and Hunan Provinces
Western region: the rest of China.
Table I shows that residential building investment accounted for the majority of investment in each region. It is not surprising that the eastern region has the largest investment amount since it is the most developed region of China. The western region had the smallest amount, but interestingly it had the highest rate of increase.
highest return at lowest risk is pursued by every investor. Different assets, as options for investment, can have different relationships with an economy, thus of returns and risks can also be different when the economy waxes or wanes. For this reason, real estate’s role of diversification in a multi-asset portfolio is an important issue, and an extensive amount of work has been done exploring the relationship between a country’s real estate industry and stock market for the sake of diversification and optimal allocations in a portfolio. For instance, Okuney and Wilson (1997), and Liow (2006) studied the US and Singaporean cases respectively.
Although Modern Portfolio Theory has been widely applied to the study real estate investment in Western countries, its application to the Chinese real estate market is limited. Feng and Xu (1998), and Wu and Yang (2001) are those researcher and economists who first studied the Chinese case using the theory, however, they both made the assumption that the investment funds were unlimited.
1.2 Objectives of present study
By applying Modern Portfolio Theory, this study uses the single index model to examine the correlation between real estate and the stock market in two cities of China. For which purpose, the Shanghai Composite index and Shenzhen Component index are chosen to represent the stock market as they are two of the three main stock exchanges of China (the other is in Hong Kong where the economy system is different from Mainland China), and the stock data of 13 listed real estate companies are used to reflect
businesses of real estate, however, either real estate is not their major business or their real estate business is limited to a certain region (some of them even in one city only) or to a specific property type (the criterion of selection is described in detail in Chapter 4).
2. LITERATURE REVIEW
2.1 The Modern Portfolio Theory and its evolution
Modern Portfolio Theory (MPT) was first introduced by Professor Harry Markowitz in 1952 who used expected return and risk to select the optimal scenario in a mixed asset portfolio in the stock and bond market. The mathematical formulation of the modern portfolio theory attempts to maximize expected return of portfolio for a given level of risk, or equivalently minimize the risk of portfolio for the given expected return.
The core concept of MPT is to diversify the risk of portfolio through selecting a collection of investment assets that has collectively lower risk than any individual asset. Although compared to the traditional theory Markowitz explained how to use the efficient frontier to choose the optimal scenario and diversify the risk, the weakness of the theory is also obvious because the involved calculation is so complicated that it would take quite an amount of time even for the ones with good mathematical and financial knowledge to deal the model, which makes it a less favorable choice for most of the investors.
In the wake of Markowitz’s theory, a number of other models for the same purpose have been proposed, they are: Sharpe’s Single-Index Model, Capital Asset Pricing Model and Arbitrage Pricing Model.
Portfolio Theory provided the information on the return of each stock is available for the calculation. Single Index Model is a simple asset pricing model to measure both the risk and the return of a stock, in which the performance of each stock is in relation to the performance of a market index.
Based on the work of Markoitz, Sharpe et al presented the Capital Asset Pricing Model (CAPM). In this model the security risk is divided into the non-systematic risk and the systematic risk or market risk, and the former can be diversified by selecting the collection of assets. The concept of Capital Asset Pricing Model is to determine a theoretically appropriate required rate of return of an asset, if that asset is to be added to an already well-diversified portfolio, given that assets’ non-diversifiable risk. The calculation of systematic risk also accounts for the asset’s sensitivity, which is represented by the quantity beta, the expected return of market, and the expected return of a theoretical risk free asset. The contribution of the CAPM is to simplify Modern Portfolio Theory and make it as a financial tool for investments. Despite its empirical flaws, the CAPM still remains to be a popular financial tool due to its simplicity and easy-to-use feature in many practical situations.
In 1976, Ross proposed the Arbitrage Pricing Theory, which is a general theory of asset pricing that holds that the expected return of a financial asset can be modeled as a linear function of various macro-economic factors or theoretical market indices, where the sensitivity to changes in each factor is represented by a factor-specific beta coefficient. The model-derived rate of return will be used to price the asset
correctly—the asset price should equal the expected end-of-period price discounted at the rate implied by the model. In case the price diverges, however, arbitrage should bring it back into line.
Besides the three approaches mentioned above, economists also endeavor to improve the modern investment theory trying to make it more practically applicable and useful.
2.2 Traditional methods for real estate investment portfolios
Traditional methods of real estate investment portfolio generally use qualitative methods to confirm the targets and scales of investments. By the magnitude of risks, real estate investments could be divided into two parts: defensive section and aggressive section. The defensive section refers to the real estate with stable market demand, steady price fluctuation and small changes in time and space; while the aggressive section is flexible with large changes in market demand, may bring higher profit from investment and potential depreciation as well. One of the major tasks of real estate investment portfolio is to determine the proportions of these two sections. In practice, both the fixed and variable ratio methods which were proposed by Perold in 19886 are often used.
Fixed ratio method is a strategy to reduce investment risk by fixing the proportion of defensive part and aggressive section in real estate investment. If the total amount of investment changes, the proportion between the two sections remains the same.
same in each investment. With different targets, the ratio can vary in different investments. For instance, investors that want to pursue a higher investment return would increase aggressive part and decrease the other. If the target of investment is to maintain the asset value, it is common practice to reduce the aggressive section and increase the defensive section.
Variable ratio method based on the change in the price of the corresponding property type sets a boundary to decide investment portfolio. For example, if the price of aggressive real estate increases by 10 %, then the total amount of this section should be increased by 5%. Likewise, if the price of defensive real estate decreases by 20%, the total investment amount of this type in this part will reduce by 10%.
Widely accepted and used by the investors due to the convenience and rationality though, these methods are flawed. First, a simple division of a real estate investment is not always appropriate. Traditional qualitative methods divided the target of real estate investment into defensive and aggressive sections which could not reflect situation when investing in real estate and selecting the optimal portfolio. In practice, the targets of real estate investments may include different property types, such as apartments, offices, commercial/industrial buildings etc., but also includes different business model, for instance land development. All this factors must be considered for an optimal portfolio of real estate investment.
Insufficient quantitative risk analysis is another flaw of these two methods. Traditional methods only qualitatively analyzed risk that makes the final decisions
subjective. Although the traditional methods have its rationality to some extent, they are not able to achieve a portfolio with the highest return or the lowest risk.
2.3 Foreign studies of Modern Portfolio Theory applied to the real estate field
Several decades ago, fewer investors would consider portfolio of real estates. Although the concept of diversification had been proposed, the investors in the real estate industry still thought that portfolio was a simple collection of individual projects. They thought the profit of portfolio would be maximized by investing in the most promising single transaction other than in a portfolio. Although a few investors had invested in more complicated forms than in a single transaction, none of them made their investing decisions based on the Modern Portfolio Theory. Since the pension fund participated in the investment in the real estate industry for the first time in the US in 1970's, more and more investors used Modern Portfolio Theory while investing to diversify risks. Although investing in real estate industry was only a small part of pension investment, it is still very important as it changed the conventional way of real estate investment.
Modern Portfolio Theory has been applied by Western researchers to study real estate investment. For direct real estate investment, generally studied topics include: (1) whether there is a premium in real estate investment, (2) whether real estate investment could hedge inflation, and (3) the diversification problem of real estate investment.
stocks’ returns could also affect the returns of real estates. The investigation of Liu, Hartzell al. (1990) claimed that there was risk premium in real estate investments. On the contrary, Liu and Mei (1992) concluded that risk premium did not exist in real estate investment and thus an advantage of investing in real estate was that it could partly diversify the risks in mixed-asset portfolio. However, this conclusion was disproved by Mei and Lee (1994), who found risk premium did exist in real estate investment that besides stock and bond, real estate could be an essential part in mixed-asset portfolio. Shilling (2003) analyzed the last 15 years’ data and concluded that compared to other risks, expected risk premium could be rather large. It showed that the expected return of real estate investment was higher than the annual return because it included some unexpected losses and risks, indicating that using historical data to estimate risk premium of real estate was not correct.
2.3.2 Researches on the diversification of real estate investment
Most institutional investors could benefit from diversifications of real estate investment. There exist different types of real estate properties, such as residential house, commercial building, etc. Webb (1984) reported that almost 61% of the institutional investors diversified portfolio risks by owing or holding different types of real estate. Louargand (1992) argued that this percentage could even reach 89%. These studies showed that higher levels of diversification could eliminate more unsystematic risks. Moreover it could left shift the efficient frontier in order to make more efficient portfolios.
Diversification over geographic and economic regions in real estate investment has also been studied. Miles and McCue (1984), by dividing United State of America into four regions: west, middle, north and east, and comparing a 6-year period data, concluded that property type is more effective on diversification than geographic region. Hartzell, et al (1987) continued Miles and McCue’s work and evaluated the benefits of diversification of real estate investment. By analyzing a larger amount of data of a much more extended period and including more property types, they reach a conclusion opposite to Miles and McCue’s. Mueller and Ziering (1992) concentrated on the local economic factors of individual metropolitan areas as the key determinant for more efficient diversification. The results showed that economic region plays a more effective role in diversification. The study of Mueller (1993) examined the efficiency of three models and found that the addition of economic underpinnings to a geographically constrained model created a higher risk-return efficient frontier than the purely geographic model. While diversifying along purely economic lines provides a better efficient frontier.
The concept of edge city has taken the diversification of real estate investment to a higher level. Garreau explained the concept in the book Edge City: Life on the New
Frontier that the surrounding areas of a metropolitan could play a very important role at
the later stage of diversification when investing in real estate. Although no definite conclusion could be drawn as which model is more effective, the author held the opinion that the edge city model will eventually replace the other three models.
One of the researchers that first stated combining the regional and economic factors in the study was Emil E. Malizia and Rober A. Simons (2001), who compared Salomon Brothers’ regional classification system with U.S. regions and the FRC regions using economic indicators reflecting real estate demand. The result showed that some Salomon’s regions had higher internal variability than traditional geographic regions. This indicated that regional noncontiguous diversification criteria with economic constrains should be considered.
2.4 Applying the Modern Portfolio Theory to the Chinese real estate industry
After the launch of China’s reform and opening-up policy, the Chinese real estate market has developed much faster than any other historical period. The Chinese central government has launched a series of policies to support the real estate market. Meanwhile almost every local government has also adjusted its economic structure to accelerate the development. Although the Chinese real estate market has been developing at a steady pace, it is still at the preliminary stage. Compared to western countries, application of the Modern Portfolio Theory to the study of the Chinese real estate market, one of the possible reasons for this might be the current stage of the market with many uncertainties and the immaturity of the financial market.
Feng and Xu (1998) proposed an optimal target and investment model of real estate investment by means of adjusting parameters and variables of securities investment model. Using Peterson-Langhhum method, they obtained the efficient frontier and picked m scenarios which satisfied the requirements of investment from n scenarios
(m<n). But unfortunately they did not find the optimal proportion of these m scenarios in the investment portfolio. Regarding the series of problems of investment model for the real estate optimal portfolio, such as how to analyze the function for investors’ efficiency, how to determine the level of investors’ risk averseness in order to reduce risks, etc.
Wu and Yang, et al. (2001) presented four models for real estate investment based on the risk-return concepts. They assumed that the total investment amount was unlimited and all of the investors in real estate market were risk averters and they would pursuit higher return. Based on these assumptions, they established four models for investment in the real estate market: maximize the return for a given risk, minimize the risk for a certain level of return, maximize the return in unit risk or minimize the risk in unit return when the risk and return were uncertain.
Shi (2000) built a real estate investment model aiming at minimizing the systematic risk of portfolio investment by analyzing the relationship among β, expected return and other risk coefficient of being selected eight real estate stocks in Shanghai’s stock market. The result showed that investors should invest correspondingly, 34% in Xingye real estate (600603), 26% in Lujiazui (600663), 25% in Zhongyuan Development (600641) and 15% in Zhujiang Shiye (600684). However, despite the insufficient number of samples and inadequately short sampling period (March, 1999 to September, 1999), the use of Shi’s model is quite limited because all the sample indices were all from real estate market and the results could only possibly give the proportions of
investment for different real estates other than real estates in a mixed asset portfolio. Mao (2003) found an internal link between the profit of real estate investment and house prices and vacancy rates. Changes in house prices and vacancy rates would have an immediate effect on the profit.
Despite the insights of these researches might provide into the problem, most of them made an unrealistic assumption that the investment funds were unlimited. Actually, due to the limited amount of capital it is very difficult to achieve an optimal diversification of real estate projects in geography, property type and business model. Taking the example of China’s Vanke Co., although its business has been running well in 27 cities, more than 90% of its real estate projects are apartment building which is of rare diversification. That is to say, these studies simply applied the formulae of portfolio theory to the real estate industry without considering the actual factor that there is usually a limit of funds
Generally speaking, compared to the application of the Modern Portfolio Theory in western countries, its potential hasn’t been released in the study of China’s real estate industry. Although, and to be noted, traditional methods are still being widely used by Chinese investors and developers, the Modern Portfolio Theory will become a power tool for investing analyzing and decision making in China's real estate market.
2.5 Correlation between the real estate and the stock market
The conclusions reached by researchers on the relationship between real estate and stock market are mainly of three groups: segmented, negatively correlated, and
positively integrated.
Liu et al (1990) are one of the researchers of the first group, who, based on the framework of Jorin and Schwartz (1986), investigated the relationship between the US real estate market and stock market and reached the conclusion that the two markets were segmented.
Many researchers also found that the two markets are co-integrated. Ibbotson & Siegel (1984), analyzing the U.S real estate prices and S&P 500 stock index, found a negative relationship between the US real estate and the stock market.
Okuney and Wilson (1997) used a nonlinear model to examine the integration between real estate and stock markets, and found that the two markets are fractionally integrated, however, movement of the real estate market towards the stock market is slow and divergence between the two markets can be prolonged. This correlation was again found by Okuney et al (2001) using both a linear and nonlinear causality tests, though these two tests resulted in opposite unidirectional relationships running from one to the other.
Ullah& Zhou (2003) found the existence of correlation between the U.S real estate market and stock market, and in which case the stock market played a leading role.
Quan & Titman (1999) investigated relationship between real estate prices and stock prices of 17 countries over 14 years, and concluded there was significant positive correlation in the long run. Their study also found that Real estate prices are also found to be significantly influenced by GDP growth rates and provide a good long-term
inflation hedge but a poor year-to-year hedge.
Acknowledging the economic bubble that Japan experienced in the early 90s, Stone and Ziemba (1993) examined the data of previous data of 4 decades and concluded that there existed a strong positive correlation between the Japanese real estate industry and stock market.
By using Autoregressive Distributed Lag (ARDL) co-integration procedure, Liow (2006) explored the Singaporean case, and found a positive correlation in the both short term and long run.
Since the actual real estate market appeared in less than two decades and in the first of which real estate was not generally considered as an investment option, the study of this relationship in the Chinese case just started very late compared to other countries. Shen and Lu (2008), after analyzing the data of a limited period of time, and found a positive correlation also existed in the Chinese real estate and stock market. With a relatively more complete database for January 1999 to November 2009, Gao et al (2012) found the existence of correlation between the two markets, though, the correlation varied over the three periods they subdivided based on the price indexes.
The study of Wang and Tang (1999) found that the fluctuation of the Chinese real estate market is similar to that of GNP which has the same wave peaks and troughs according to the GNP data of 1950 to 1998 and the growth of real estate investment from 1987 to 1998. By analyzing those data, they concluded that the growth rate of real estate investment has positive correlation with growth rate of GNP. They also found that
the demand for real estate development will increase when the national economy is growing, especially driven by city expansion.
3 METHODOLOGY
It has been generally accepted as a fact that real estate should be a very important part in a mixed asset portfolio, and for this reason, the Modern Portfolio Theory has been borrowed by many researchers from the securities industry to study the diversification effects. In the present work, the author will attempt to explore the diversification effects of real estate in the Chinese market also using the Modern Portfolio Theory and single index model.
3.1 Modern Portfolio Theory and single index model
The Modern portfolio theory or Markowitz model has been very successful and widely applied by many researchers since it was first proposed by H. Markowitz in
Portfolio Selection in 1952. Markowitz assumed that all the investors were rational, i.e.
all the investors were risk averse and pursuit higher profit. Based on that assumption, the Modern Portfolio Theory provided a model to maximize the expected return of a portfolio for a certain level of risk, or minimize the risk of a portfolio for a given amount of expected return. This model illustrates the process of selecting optimal scenarios through efficient frontier and lowering risks by diversifying investment. It is also stated in the theory that, instead of simple collection of assets, investors should choose different assets with lower correlation coefficients.
The formula for expected return takes the form: (1) E(RP) = ∑n wi
whereR is expected return, 𝑤𝑖 is the weight of ith asset. The variance of the portfolio is
(2) σp2 = ∑ ∑ w i n j=1 n i=1 wjσij = ∑i=1n ∑j=1n wiwjσiσjρij
Based on Markowitz’s theory, William Sharpe proposed the so-called single index model in 1963 to measure both the risk and the return of a stock. It has been widely used to examine the capital asset pricing model. Sharpe assumed that there is only one economic factor that causes the systematic risk affecting all stock returns and this factor can be represented by the rate of return on a market index. And other factors that only affect some individual stocks are unique or unsystematic ones and could be diversified. The single index model is expressed as:
(3) Ri = α + βRm+ εi
(4) Ri = ri− rf
(5) Rm = rm− rf.
Usually, the formulae are written in the following form: (6) ri− rf = α + β ∙ (rm− rf) + ϵi,
where:
𝑟𝑖 is the rate of return of ith stock 𝑟𝑓 is the risk free rate
𝛼 is the stock’s alpha, or abnormal return
𝛽 is the stock’s beta, or responsiveness to the market return 𝜖𝑖 is the residual returns
This equation shows that the stock return is influenced by the market (beta), and it has a firm-specific expected value (alpha) and firm-specific unexpected component (residual). According to this model, each stock's performance is in relation to the performance of a stock market index.
3.2 Sampling interval and risk-free rate
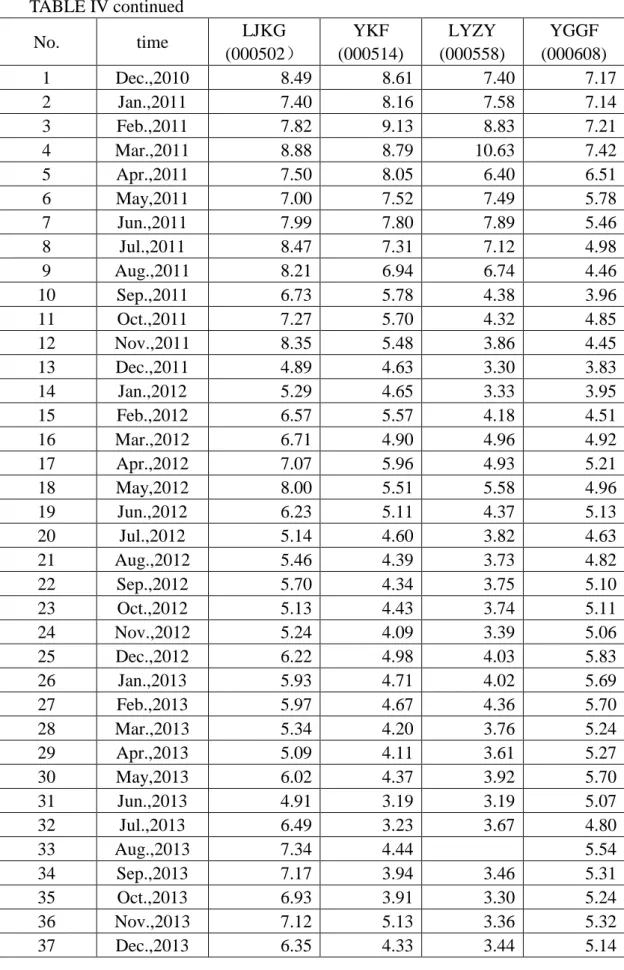
This study uses the single index model to examine the correlation between the performance of real estate stocks and market indices. In order to analyze sensitivity of the real estate industry to the market, 13 stocks in the real estate field are selected and the macroeconomic situation is represented by Shanghai Securities Composite Index and Shenzhen Component Index in which the 13 selected real estate companies are quoted.
Using monthly data, this article is planning to select December 31st 2010 to December 31st 2013 as the sample interval so that each sample has 36 data to analyze real estate companies’ performance in the macroeconomic situation.
In developed countries, the rate of one year treasury bond is widely used as the risk-free rate. While this seems inappropriate to the Chinese market due to the rate is controlled by the government. Meanwhile the Chinese treasury bonds are normally in a long run such as 5 years or 10 years. As the rates were adjusted several times during the
sampling time, thus, we decided to use the one year deposit rate of the four government controlled banks’ 3.25% as the risk-free rate.
3.3 Calculation of the variables 3.3.1 Calculation of rate of stock return
The following formula is used to calculate the rate of stock return
(7) Ri.t = (Pi.t− Pi.t−1+ Di.t) P⁄ i.t−1, where:
𝑅𝑖.𝑡 is the rate of stock return of the ith stock in the t.th period 𝑃𝑖.𝑡 is the stock price of the ith stock in the tth period
𝑃𝑖.𝑡−1 is the stock price of the ith stock in the (t-1)th period 𝐷𝑖.𝑡 represents the dividend of ith
stock in the tth period
The rate of stock return would be more accurate if the time interval were smaller and sample number were larger. However, due to inaccessibility to such data, monthly data of the Chinese stock market from December 31st 2010 to December 31st 2013 are used in this dissertation. In order to simplify procedure of calculating, monthly data are used.
3.3.2 Handling of missing data due to trading halt and suspension
Trading may be halted for a number of reasons, for instance, when a publicly traded company is going to release significant news about itself, or suspended when serious (usually abnormal) questions have been discovered about the company's assets,
operations, or other financial information. In such events, there will be no transaction prices of the stock on the specific days. In order to achieve the continuity and consistency of data, one could use of these three methods to adjust: Time Series Forecasting Method, Moving Average and Distribution-Lag Method. It is logical and reasonable to assume that there is a relation between the stock price and prices of the five preceding days. Thus, the following moving average method can be used for the data extrapolation:
(8) Pt = (Pt−1+ Pt−2+ Pt−3+ Pt−4+Pt−5) 5⁄ .
3.3.3 calculation of rate of index return
The performance of group of component can be traced by assuming that all the dividends and interests are reinvested, and it can be calculated as:
(9) Rm = (indext− indext−1) index⁄ t−1, where:
𝑅𝑚 is the rate of return at t 𝑖𝑛𝑑𝑒𝑥𝑡 is the closing index at t 𝑖𝑛𝑑𝑒𝑥𝑡−1 is closing index at t-1.
4 DATA ANALYSIS
Foreign studies showed that real estate investment has hedging inflation effect because it has little correlation with other investments and is little influenced by the economic market. However, to large extent, Chinese real estate industry is affected by different policies for instance, the policies which were seemed as the essential conduction in real estate industry published in 2003 still influence real estate market now. In this situation, the assumption of hedging inflation effect—little correlation between real estate industry and economic market- may not exist in China. In order to analyze the sensitiveness and correlation between real estate industry and the market indirectly, by selecting 13 stocks in real estate field, using single index model, this study examines the correlation between the rate of stock return and the rate of market return. These 13 selected companies with more than 75% of their profit result coming from real estate industry are from Shanghai Securities Composite Index and Shenzhen Component Index. The stock price and basic information are obtained from www.stockstar.com and http://stock.sohu.com/.
4.1 Brief description of each stock
This study selected 13 reprehensive stocks in the real estate industry from Shanghai Composite Index and Shenzhen Component Index, and for a company to be selected, more than 75% of its profit must come from the real estate industry.
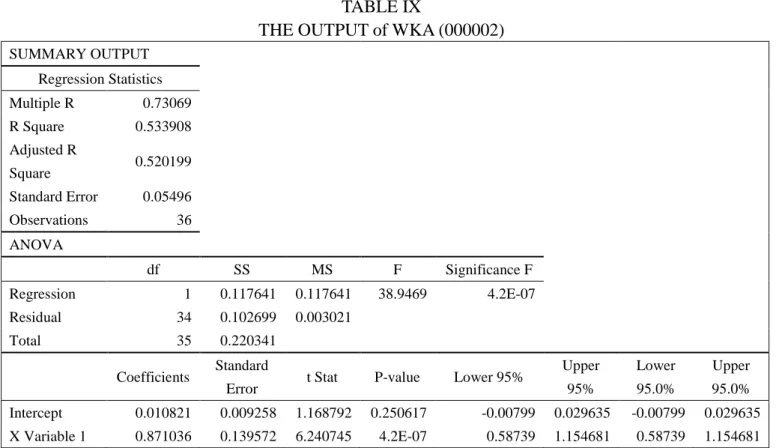
1) WKA (000002). It is a company dedicated in real estate with its core business focused on real estate development and sales. Their major property type is apartment buildings and they hold a market share of 2%. 97% of its profit comes from the real estate industry and its main business regions include Shanghai, Shenzhen, Nanjing, Chengdu, Shenyang, Nanchang, Wuhan and Beijing.
2) JRJ (000402). This company has a variety of businesses in the real estate field, such as real estate development and sales, property management, real estate renting, technical support and parking service. According to the stock field division from Shenzhen Component Index, JRJ is a real estate company as its current business is land planning, development, construction and management. By the end of 2013, the company’s real estate businesses had contributed 82% of its profit.
3) LJKG (000502). The company’s business focuses on real estate development and sales, house decoration and gardening, touring business and electronic business. 72% and 16% of its profit come from villa’s development and apartment sales, respectively
4) YKF (000514). This is a real estate company with its main business in Chongqing. Their major business includes real estate development and sales, building demolition and relocation, property management and construction material sales. And the corresponding percentage of profit from property sales,
housing demolition and relocation, and land development are 50%, 30%, and 7%, respectively.
5) LYZY (000558). The main business regions of the company include Shenyang and Jiashan. The company mainly focuses on real estate development, commercial property’s renting and sales, wholesale business of furniture and decoration material, and storage and transportation. The major profit is from real estate development and sales.
6) YGGF (000608). The company’s business concentrated in the Guangzhou area. Its major business includes real estate investment, investment in public facilities, high-tech investment, and property construction, sales, rent and consultancy. Stocks from Shanghai Composite Index
7) TFFZ (600332). The business fields of this company include real estate development, sales and rent, property management, architectural design and consulting service as well. Its main business region is in Tianjin.
8) JDJT (600383). The major business of this company includes real estate development, property management and property renting. The business regions concentrate in Guangdong, Shanghai and Beijing. 57%, 24% and 19% of its profit come from Beijing, Shanghai and Guangdong, respectively.
9) BLDC (600048). The core business of this company includes real estate investment and development, housing demolition and relocation and architecture design. In 2013, 95.96% of its profit was contributed by its
business in real estate.
10) XHP (600638). The company’s business is mainly focused on real estate development, renovation of dilapidated houses, and property management in Shanghai as well. In 2013, apartment sales made almost 65% of its total profit, while another 20% was from house renting
11) PDJQ (600639). Its main business region is the grand Shanghai area. The main business fields cover land investment and development, property sales and rent as well as intermediary agent service. The majority of its profit comes from two fields: real estate sales and commercial property rent.
12) LJZ (600663). Similar to PDJQ, the business region is in Shanghai area. Most of its profit comes from the land development which accounts for 70.20%, and the second biggest profiting business is real estate sales which is 29.8%. Besides land development and property sales, development of public facilities, housing demolition and relocation, and equipment installation are also important businesses of this company.
13) ZHQY (600675). The core business of this company is land investment and development, real estate rent, as well as property management.
Information about the 13 stocks at Shenzhen stock exchange and Shanghai stock exchange are listed in Table II and Table III, and the monthly data of Shenzhen component index and Shanghai composite index are presented in provided in Table IV and Table V, respectively.
4.2 Calculation results
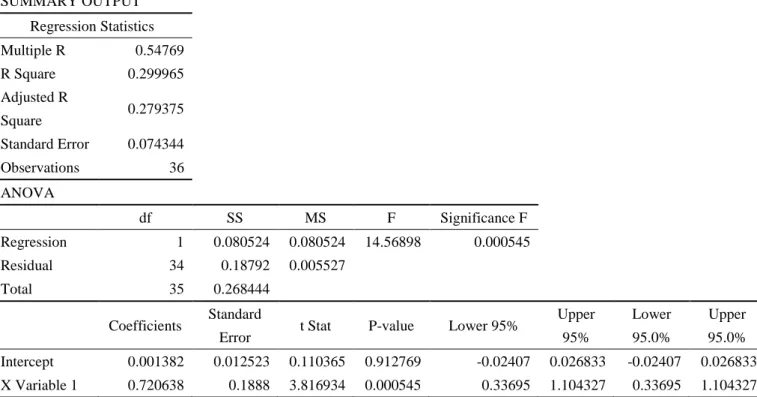
According to the monthly prices of the selected stocks, the following results were calculated in Microsoft Excel. The equation used for the calculation and the results are listed in Table VI, 𝜖𝑖 is the stochastic error with the mathematical expectation E (𝜖𝑖) equaling zero. Normally, it can be assumed that there is no relationship between 𝜖𝑖 and 𝑟𝑚 which means cov(𝜖𝑖, 𝑟𝑚)=0. This explains that this stochastic error 𝜖𝑖 is just particularly related to the operational situation of the company itself and is in no relation with the market.
4.3 Analysis of the results 4.3.1 data analysis
(1) According to the calculation results using the data above, it can be seen that ZHQY (600675) has the largest beta among these selected stocks which is 1.66. Meanwhile there are seven companies whose beta is larger than 1, correspondingly LJKG (000502), YKF (000514), TFFZ (600322), XHP (600638), PDJQ (600639) and LJZ (600663) which has beta between [1.1, 1.4]. The betas of WKA (000002), JRJ (000402), LYZY (000558) and BLDC (600048) fall in [0.9, 1], also close to 1. And then the betas of YGGF (000608) and JDJT (600383) are smaller than 1 which are in the interval of [0.7, 0.8]. In the financial market, a stock with a beta value smaller than 1 is considered as a defensive stock and this stock has a lower correlation with the stock market due
to the smaller influence by the stock market. And the stock with a beta larger than one is defined as an aggressive stock. For those with betas greater than 1.5, they are referred as high risk stocks. Based on this convention, our selected stocks spread over all the defined intervals.
(2) From the result we know that, the selected companies that have betas larger than 1 are all relatively large companies in the Chinese real estate field and their businesses are more concentrated on land development and apartment sales, the main business regions of concentration are Beijing, Shanghai, Tianjin and Chongqing. While the companies with beta close to 1 are devoted to developing businesses in Shenzhen, Shenyang and Guangdong. Based on the geographic distribution, the companies with their main businesses in the most developed cites like Shanghai and Beijing have larger beta values, while companies with business distributes in relatively less developed cities have smaller betas. (3) Wang and Tang (1999) argued that there is high positive correlation between the
Chinese real estate market and the stock market. To the opposite, the results of this study leads to an opposite conclusion—It shows the correlation between the rate of return of the company and the rate of return of market (represented by Shanghai composite index and Shenzhen component index) is actually low.
4.3.2 Correlation analysis of Chinese real estate market
In developed countries, real estate could be seen as a hedging asset due to the low correlation between the real estate market and the stock market. While a domestic study
claimed in 1999 that unlike in developed countries there was high positive correlation between the Chinese real estate industry and stock market. But according to our results, there is only a low correlation between the Chinese real estate market and the stock market, despite a few stocks that exceptionally have high betas. Although results obtained in this study are similar to those of foreign researchers, it must be noted that the validity of these results is still limited for at least two reasons: A) the number of stocks are limited, and B) the sparseness of the sampling intervals may also affect the correctness of the results. In contrast with the discovery by many foreign and domestic studies as well as this one that the correlation between the real estate industry and the stock market is in fact very low, most intuitional investors are only willing to invest a very small part of a mixed portfolio into real estate for the fears of risks, and uncertainties of the Chinese real estate market. For instance, the real estate market is one of those that the Chinese central and provincial governments have been regulating and many new policies have been launched in the last decade in order to achieve the target.
The development of Chinese real estate market, in retrospect, did show periodic characteristics in the last century. In the 1920s, Chinese real estate market experienced its first blooming period because the population increased rapidly and inflows of foreign capital. Taking the example of Shanghai, the main characters of the local real estate market in this period are abrupt increase in real estate investment and severe investment speculation. In the three decades before the foundation of the People Republic of China
in 1949, the real estate market had been stagnant due to the civil war and World War II. After that, as one of the most fundamental policies of the newly established regime of socialism stipulated that private ownership of real estate properties was not allowed by law, real estate was developed, owned, managed, and allocated to the citizens by the central government. Thus, there was no real estate market in its real sense during that period, and this situation continued until the end of the 10-year-long Cultural Revolution and the government decided to reform and open up in 1979. Thanks to the opening-up policy, a large amount of foreign investments were attracted and made especially in the coastal cities in the 10 plus years that followed. During which, the Ministry of Housing and Urban-Rural Development issued The temporary guidelines on
municipal construction and development in 1984 to encourage investing in real estate
and another series of policies during 1987 to 1990 in order to further boost the development of real estate market. Several of these government documents marked the beginning of a new stage of the Chinese real estate market. For instance, Notice of
deepening the reform of housing system in order to speed up house construction,
published by the general office of state council, was a milestone that put an official end to the old housing allocation system and since when the government started playing the role of a pure economy regulator other than a leading investor.
As individual consumers becoming the main investors of real estate, the banking business of house loans for individuals has also been thriving with steady increase in the last 10 years. In 2013, the house loans for individuals reached nine trillion Chinese Yuan
(1.5 Trillion USD) which increased by 21% compared to 2012. The encouraging crediting policies also accelerated the development of the real estate market.
A review of the Chinese real estate industry in different historical periods reveals the development of real estate market, at least in China, is subject to the country’s economy and the national policies.
During a growing period of an economy specially with city expansion , the real estate market, given its inborn nature that investing in real estate usually involves large amounts of capital and long development cycles, will lose its supply-demand balance, which will immediately result in a rapid increase in house price—booming of the real estate industry; mutually, rise in house price will attract more investments in real estate, and then in turn increase labors and sales of construction materials, spur loans from banks, and other economic activities that accelerates an economy. Vice versa, during an economically stringent period (which often follows a booming period), investment in real estate is discouraged by many factors: high interest rates of loans, high cost of construction materials, expensive labor, low expectations of sales, etc. And certainly real estate companies are reluctant to invest. This is exactly how the Chinese real estate market has behaved since 1987: a wane in the years 1987 to 1990 that followed by a 3-year-long booming then a falling period until 1999, and finally the present thriving period (if overlooking the short-termed decays as the government intended). It should also be mentioned that the current thriving period has lasted about 15 years—an unusual long time only because of the encouraging policies the government has published to
stimulate the economy.
The most obvious characteristic of the Chinese real estate industry is that it is manipulated by the central government by means of national policies such as policies on land use, financial policies and other regulations that can influence the development of the market. For instance, the state of council published in 2007 the government document no.121 that stipulates the legit process of bidding for land use, which was an example of successful regulation as it resulted in a decrease of 15.7% in the total amount of investment in real estate industry.
All these characteristics described above can by and large imply the interrelationship between the Chinese real estate industry and the stock market. However, the stock market cannot actually and instantly reflect the economy, unlike those state-owned companies, the private companies, especially the unlisted companies, are much less influenced by the stock market and can still carry on their businesses with promising odds of profiting.
Many western studies found that investing in real estate can diversify the risks in a mixed asset portfolio based on the assumption of a low correlation between real estate industry and stock market. However although the quantitative results of this data analysis shows that the correlation between Chinese real estate industry and stock market is also low, the Chinese real estate industry is regulated by the government. Considering the uncertainty and other political factors, real estate cannot play an important role in the Chinese investors’ portfolio.
5 DIVERSIFICATION EFFECTS OF REAL ESTATE IN A MIXED ASSET PORTFOLIO FOR INSTITUTIONAL INVESTORS
Other than a more comprehensive collection of real estate companies, 13 listed companies in real estate industry were selected for this study because their data are the only ones available (there are also a number of large real estate companies that are unlisted). Compared to any other kind of chattels, real estate has its unique feature as it spells: it cannot be moved and is location specific. Hence, a real estate property’s geographic location, the social and economic environments make itself very different from another. For this reason, heterogeneity is one of most pronounced characteristics of the real estate industry. Due to the heterogeneity and unavailability of information, the institutional investors can only invest a very small part of a mixed asset portfolio in real estate. According to the report of China Securities Journal about equity fund investment in industry in 2013, the top five industries were machinery equipment (12.46%), transaction and storage (9.32%), metal and nonmetal (7.94%), Information Technology (4.34%), and electricity and gas (4.06%). While the total amount of investment in real estate was only 0.32%. Although the report by China Galaxy Securities had a slightly different top 5 list, but real estate still only accounted for less than1.8% not even to mention direct investment in real estate market.
Although the analysis in previous chapter shows that there is little correlation between Chinese real estate industry and stock market, the uncertainty and risk are still high no matter investing directly in real estate or indirectly through real estate stocks or
funds due to the characteristics of the Chinese real estate market itself. This high level of risk and uncertainty result in limited investment of both institutional and individual investors.
5.1 Diversification effects
Researchers hold the thought that real estate investment can diversify the risks in a portfolio but also itself due to its heterogeneity such as different business model and various locations.
Although investing in real estate is seen as inflation-hedged investment, the risks of investing in real estate are in general substantial. Similar to other financial investments, risks of real estate investments are also divided into systematic and unsystematic risks. The systematic risks of real estate investment originate in 1) immobility of real estate properties that can only be compensated by geographic diversification, 2) expectation of business performance that requires diversification of business models, and 3) other constraints that demands other ways of investing. Although it has been generally accepted by researchers that these three diversifications must be satisfied in order to reduce the risks, no conclusion on either the best constitution of a real-estate only portfolio or the optimal proportion of real estate investment in a mixed-asset portfolio could be reached. A study in 1980s showed that in order to efficiently diversify the risk, investors should invest at least properties of 6 different locations and types. According to the data analysis of 166 real estate investments, it concluded that the unsystematic risk is decreasing inversely with the number of invested properties.(see TABLE VII)
5.2 Diversification of property type and business model
Generally speaking, real estate could be categorized into several types by the use of property, such as residential building, commercial building and industrial building, etc. By ways of business models, real estate business could be divided into design and construction and sales of new buildings, demolition and relocation of old buildings, land sales (As it is explicitly stipulated in the constitution of PRC that the ownership of any Chinese territorial land belongs to the state, thus land sales refer to the right of use of the land being transferred in this particular context) and property management, etc. Normally, a real estate company may deal with only one or more types of property and business models. According to the data of the companies described in chapter four, it can be seen that most of the companies are devoted to the design, construction and sales of new buildings expect for LJZ (600663), XHP (600638) and PDJQ (600639) whose major businesses are land transfer, demolition and relocation of houses, and house renting. By property type, residential building is the core business of WKA (000002), while LJKG (000502) is devoted to villa and apartment constructions.
It can be seen in table VIII that, different types of real estate investment have different profit and risks. Residential building could be further broken down into apartment, villa, mid-class residential building and affordable house etc. And among them, the demand for residential building is highest. New building development is the most important business model for real estate companies due to the lower risk and faster recovery of funds. According to the developers’ experience, because of the diminishing
of land resources for real estate development and completion of urbanization, the major target of real estate companies are shifting to property management. Renting as another business model could provide steady and constant cash flow and decrease the uncertainty and fluctuation of profiting, although, invested capital cannot be withdrawn as fast as with new building construction and sales.
Investors could invest in different property types and business models in order to reduce the risk and fluctuation of profiting expectation. By analyzing data of 170 properties in two regions, Grissom (1990) created 2267 portfolios with different regions and types. The result showed that investing in different types in the same region could reduce the unsystematic risk by 92.5%. And this figure could achieve 98.9% when investing in different types in different regions. From the Chinese real estate market, the vacancy rate of mid-class residences has gone up in recent years, and drawn the attention of the Chinese real estate market. The data from the state statistics office showed that the vacancy rate of has increased in 22 provinces in 2013, with the highest being 26.5%. In this situation, the investors shall consider to invest in other types and business models so as to reduce the risks.
5.3 Geographic diversification
Besides property types and business models, geography is also one of the major ways for developers to expand their businesses and reduce risks. Real estate investment is influenced by the local environment, economy and culture. If most of the investments of a portfolio are in the same region, there is a potential risk of great loss in an event of
regional problems (which is the same principle as ―Do not put all the eggs in one basket‖). In order to minimize the risk and maximize the profit, real estate investments should be reasonably geographically allocated.
The geographic diversification could be achieved in two ways: geographically and economically. Mueller and Ziering’s (1992) study showed that the regional economy is a factor more effectively influencing the profit of real estate investments compared to geography. In the Chinese real estate market, the developers try to develop their business not only in their home cities but other cities as well. There exist economic differences across the eastern, middle and western regions. Nowadays, 50% of the real estate investments are located in Beijing, Shanghai, Zhejiang, Guangdong and Jiangsu Provinces. However with the development of the western regions, both the demands for real estate industry and investment opportunities are increasing. Some developers have started to invest in western region to form a geographically diversified portfolio for its benefit as the investment opportunities in the east regions are decreasing. The purchasing ability of the local residents of a region largely depends on their income level, which largely relies on the local economy. Thus the expenses of investing in real estate and the profit margin may vary when the developers attempt to provide real estate products with specific features suitable for the local market. Taking the example of WKA (000002), the business has already expanded to more than 20 cities including Beijing, Shanghai, Shenzhen, Nanjing, Chengdu, Shenyang, Nanchang, Wuhan, etc. Some of which are more economically developed cities in the east coast. As seen in
table VI, companies with this kind of business models normally have betas close to 1, such as WKA and BLDC. Again, this result might not be ―correct‖ for the limitations of the data used in this study as previously stated.
As for diversifying the risks, an option for the developers without the capacity of expanding business to other cities is to combine different property types and business models. According to a 6 year database of United State of America, Miles, McCue (1982) explained that, compared to the geographic region, the property type is more efficient on risk diversification using. By analyzing a larger database, extended timetable and more categories of property, Hartzell, Hekman and Miles (1986) found opposite results. The status quo of the Chinese real estate market is that it is very difficult to achieve diversification, even for such renowned and competitive developers as WKA who possesses 2% of the total market share.
6 CONCLUSION
According to the analysis based on the 13 real estate company stocks and 2 stock exchange indexes that are chosen to represented the Chinese real estate industry and stock market respectively, the results of the single index model show that the correlation between the Chinese real estate industry and stock market is low, and hence real estate can be a good option for diversification in a multi-asset portfolio.
It must also be noted that there are still uncertainties that shall not be neglected during the decision making process of investment as both the national economy and real estate industry are regulated by the Central government by means of administrative and financial policies.
Due to the limited availability of data, the results of the study might not be precise as only 13 listed real estate companies were chosen and a 3-year data were used. For better results, a database with a longer duration, and higher data density (for instance, daily prices), and including more companies should be of great help.
Owing to the continuous boom of the real estate market, numerous individuals have chosen real estate as an option of investment, but they suffer the risks due to their limited financial abilities and insufficient professional knowledge. Although REIT is still very new in China, but it is believed to have a bright future as it will benefit both the investors and the industry.
REFERENCES
Anderson, R. I., Lewis, D. and Springer, T. M. (2000). Operating Efficiencies in Real Estate: A Critical Review of the Literature. Journal of Real Estate Literature 8 (1), 3-18
Capozza, D. R. and Seguin, P. J. (2000). Debt, Agency and Management Contracts in REITs: The External Advisor Puzzle. Journal of Real Estate Economics and
Finance 20 (2), 91-116
Dai, X. H. (2005). A Study on the Development of Real Estate Investment Trusts (in Chinese), EMBA Thesis.
Feng, L. and Xu, D. Y. (1998). Selecting Models for Real Estate Investment Portfolio.
Financial Research (in Chinese) 1 (1), 3-12
Fund Investment in industry in 2013 in China. National Bureau of Statistics of the People’s Republic of China [Online]. Available at:http://data.stats.gov.cn/search/keywordlist2?keyword=2013%E6%BB%A0 %E6%9A%75%E8%B5%63 [Accessed: 5/23/2014] (in Chinese)
Gao, Li, and Gu, The relationship between Chinese real estate market and stock market,
Journal of International Business Research, 2012 (in Chinese)
Garreau, J. (1991) Edge City: Life on the New Frontier, 2nd Ed. New York: Anchor. Hartzell, D., Hekman, J. S. and Miles, M. E. (1987).Real Estate Return and Inflation,
Journal of the American Real Estate and Urban Economics Association 15 (1),
Ibbotson. R. G. & L. B. Siegel (1984). Real estate returns: a comparison with other investments. Real Estate Economics, 12(3), 219-242.
Jorion P. and Schwartz E. "Integration vs. Segmentation in the Canadian Stock Market"
Journal of Finance, 1986, 41, pp.603-616
Liu, C. H., Hartzell, D., Greig, W. and Grissom, T. (1990). The Integration of The Real Estate Market and Stock Market: Some Preliminary Evidence. Journal of Real
Estate Finance and Economics 3 (3), 262-282.
Liu, C. H. and Mei, J. P. (1992). The Predictability of Returns on Equity REITs and Their co-movements with other Assets, Journal of Real Estate Finance and
Economics 5 (4), 401-418.
Liow, K. H. (2006). Dynamic relationship between stock and property markets. Applied
Financial Economics, 16(5), 371-376.
Louargand, M. A. (1992). A Survey of Pension Fund Real Estate Portfolio Risk Management Practices. Journal of Real Estate Research 7 (4), 361–373 Malizia, E. E. and Simons, R. A. (2001). Comparing Regional Classifications for Real
Estate Portfolio Diversification. The Journal of Real Estate Research 6 (1), 53-77
Mao, Y. P. (2003). The Uncertainty Analysis in Real Estate Investment, Economic
Research (in Chinese) 4 (2), 37-52
Mei, J. P. and Lee, A. (1994). Is There a Real Estate Factor Premium?. Journal of Real
Estate Finance and Economics 9 (2), 113-126.
Miles, M. and McCue, T. (1984). Diversification in the Real Estate Portfolio. Journal of
Financial Research 7 (1), 57-68
Mueller, G. R. (1993). Refining Economic Diversifications Strategies for Real Estate Portfolio. Journal of Real Estate Research 8 (1), 55-68
Mueller, G. R. and Ziering, B. A. (1992) Real Estate Portfolio Diversification Using Economic Diversification. Journal of Real Estate Research 7 (4), 375-384 Okunev, J. & P. Wilson (1997). Using nonlinear tests to examine integration between
real estate and stock markets. Real Estate Economics, 25(3), 487-503.
Okunev, J., P. Wilson & R. Zurbruegg (2001). The causal relationship between real estate and stock markets. Journal of Real Estate Finance and Economics, 18(2), 257-278.
Quan, D. C. & S. Titman (1999). Do real estate prices and stock prices move together: an international analysis. Real Estate Economics, 27(2), 183-207.
Perold, A.F. (1986) Constant Proportion Portfolio Insurance. Journal of Harvard Business School
REIT Basics (2014). REIT [Online]. Available at: http://www.reit.com/nareit [Accessed: 7/4/2014]
Ross, Stephen (1976). The arbitrage theory of capital asset pricing. Journal of Economic
Sharpe, William F. (1963). A Simplified Model for Portfolio Analysis. Management
Science 9 (2): 277–93.
Shen, Y. & W. Lu (2008). Relevance research on Chinese stock prices and real estate price. Modern Economic Science, 30(4), 87-92. (in Chinese)
Shi, J. (2000). A Study on Investment Portfolio Risk of Real Estate Companies, Journal
of Henan Institute of Financial Management (in Chinese) 3 (1), 1-12.
Shilling, J. D. (2003). Is There a Risk Premium Puzzle in Real Estate?. Real Estate
Economics 31(4), 501-525.
Stone, D. & W. T. Ziemba (1993). Land and stock prices in Japan. Journal of Economic
Perspectives, 7(3), 149-165.
The Chinese Real Estate Development and Sales in 2013. National Bureau of Statistics
of the People’s Republic of China [Online]. Available at: http://www.stats.gov.cn/tjsj/zxfb/201401/t20140120_502096.html [Accessed: 5/13/2014] (in Chinese)
The Chinese Real Estate Development and Sales in 2011. Tencent News [Online]. Available at: http://news.qq.com/a/20120117/001071.htm [Accessed: 5/13/2014] (in Chinese)
The Chinese Real Estate Investment in 2013. National Bureau of Statistics of the People’s Republic of China [Online]. Available at: sohu finance:http://business.sohu.com/20140120/n393801815.shtml [Accessed: 5/13/2014] (in Chinese)
The Increasing Rate of Real Estate Investment in China from 1998 to 2013. National Bureau of Statistics of the People’s Republic of China [Online]. Available at:http://data.stats.gov.cn/search/keywordlist2?keyword=2013%E6%88%BF %E5%9C%B0%E4%BA%A7%E6%8A%95%E8%B5%84 [Accessed: 5/20/2014] (in Chinese)
Ullah, A. & Z. G. Zhou (2003) Real estate and stock returns: a multivariate VAREC model. Journal of Forecasting, 21(1), 181-192.
Wang, M. and Tang, X. F. (1999). The Correlation between Chinese Real Estate Investment and Economic Period. Journal of Sichuan University (in Chinese) 3 (1), 2-11
Webb, J. R. (1984). Real Estate Investment Acquisition Rules for Life Insurance Companies and Pension Funds: A Survey. Journal of the American Real
Estate and Urban Economics Association 12 (4), 495–520Wu, Z.Z., Yang, Z.
Z., Cao, X. Q. and Wang, Z. M. (2001). The Optimal Models of Real Estate Investment Based on Modern Portfolio Theory. Geographic Technical
APPENDIX I: TABLES
TABLE I
REGINAL INVESTMENT SITUATION IN REAL ESTATE MARKET IN 2013 Regions Investment amount Increase than last year
(billion CNY ) Residential building (Billion CNY) (%) Residential building (%) National investment 8,601 5,895 19.8 19.4 Eastern region 4,797 3,270 18.3 18.3 Middle region 1,905 1,327 20.8 19.9 Western region 1,900 1,299 22.6 21.8 Source: http://www.stats.gov.cn/tjsj/zxfb/201401/t20140120_502096.html TABLE II
INFORMATION ABOUT STOCKS FROM SHENZHEN COMPONENT INDEX Name and code Capitalization
(ten thousand)
Circulating shares
(ten thousand) Main business regions WKA (000002) 1,101,502.64 967,624.27 Shenzhen, Shanghai
JRJ (000402) 302,707.98 302,439.31 Beijing LJKG (000502) 18,481.96 18,332.91 Guangzhou
YKF (000514) 84,377.10 84,377.10 Chongqing LYZY (000558) 63,026.92 62,975.36 Shenyang YGGF (000608) 74,991.33 74,991.33 Guangzhou