Accounting Choices: The Brazilian Case Of Real Estate Investment
Murillo José Torello Pinto
Universidade Presbiteriana Mackenzie, Centro de Ciências Sociais e Aplicadas, São Paulo, SP, Brazil.
Vinícius Aversari Martins
Universidade de São Paulo, Faculdade de Economia, Administração e Contabilidade de Ribeirão Preto, Departamento de Contabilidade, Ribeirão Preto, SP, Brazil.
Denise Mendes da Silva
Universidade Federal de Uberlândia, Faculdade de Ciências Contábeis, Uberlândia, MG, Brazil.
Received on 12.12.2013 – Desk Acceptance on 01.22.2013 – 5th version accepted on 08.31.2015
ABSTRACT
The objective in this study is to show that the business model of publicly traded real estate management companies in the Brazilian market explains their accounting choices to measure the investment properties. Therefore, the five main Brazilian investment property managers were studied, based on a method that triangulated documentary research, semistructured interviews and consistency analysis. The results of the analysis of the secondary data from the documentary research of the two main Brazilian companies in the real estate exploitation sector (one of which chose the fair value and the other the cost), together with the results of the interviews with the companies’ main internal and external agents direct or indirectly involved in the measuring choices of investment properties, indicated that the companies’ distinguished business model explains their distinct accounting choices to measure the investment properties. To enhance the consistency of these findings, next, the business models of the three consecutive largest Brazilian investment property managers were analyzed (two of which chose the fair value and one the cost), confronting them with their accounting choices; consistency was observed between the business models and the accounting choices, in accordance with earlier results. Although generalization of the results is not possible due to the small number of companies studied and the specific sector, evidence indicates that an integrated set of factors, which are considered in isolation in the literature, can explain the accounting choices. Several mutually interacting factors that explain the accounting choices, to the detriment of isolated factors, can contribute to expand the knowledge on this theme.
1 INTRODUCTION
of secondary data from five Brazilian companies from the real estate sector, obtained through documentary resear-ch; (ii) interviews with players involved in the accounting choices at two of these companies; and (iii) consistency analysis between the secondary data collected and the answers obtained in the interviews, in companies opera-ting in the same sector.
This methodological approach allows for advance-ment in knowledge regarding explanations for accoun-ting choices, despite limitations to generalization. It was found that, for companies from the real estate sector ope-rating in the Brazilian capital market, explanations for accounting choices for measuring investment properties are related to companies’ business models.
The term “business model” originated with Drucker (1954), but only gained expression and visibility during the last decade, even becoming part of business jargon (Casadesus-Masanell & Ricart, 2010). For Timmers (1998), the business model is seen as an architecture for the services, products, and information, including va-rious benefits for all the business actors (stakeholders).
For Amit and Zott (2001, p. 511), the business mo-del describes “the content, structure, and governance of transactions designed so as to create value through the exploitation of business opportunities.” This study starts with the assumption that the business model is a set of various factors, which encompass activities and strategies adopted by companies in order to stand out, meet opera-tional and economic needs, and create value for stakehol-ders. In this sense, it can be concluded that ownership structure, management model, means of funding, cliente-le etc. are factors that can be integrated into the business model and, consequently, have an impact on companies’ accounting choices. These factors involve different alter-natives for achieving competitive advantage, profitability and added value, and can thus explain managers’ accoun-ting choices.
The main contribution of this article is in adding new explanations for the implementation of accounting choices in companies, which are related to their business models. These new explanations result from research car-ried out using a different methodological approach from those traditionally used in positivist-empirical studies, which predominate in this area. This implies that room remains to increase the scope of the current accounting choice theory, by broadening it to a more comprehensive vision regarding the strategic positioning of companies and the role that accounting information plays in busi-ness models.
Questions regarding accounting choices have been the motivation for many studies since 1960. Such studies at-tempt to explain accounting choices in function of the opportunistic behavior of managers, results management, and information asymmetry, based on economic theories such as the Theory of the Firm and the Theory of Agency (Watts & Zimmerman, 1986; Holthausen & Leftwich, 1983; Holthausen, 1990; Fields, Lys & Vincent, 2001; Francis, 2001).
For example, Paulo (2007) argues that managers can make choices between valid accounting practices and norms, however warns that the literature shows that ac-counting choices can also be made from opportunistic (managers seek to maximize their own utility) and effi-ciency (in order to better reflect the economic characte-ristics of an asset or transaction, in an attempt to improve the quality of information) perspectives.
Furthermore, studies such as those by Capkun, Ca-zavan-Jeny, Jeanjean and Lawrence (2008), Lourenço and Curto (2010), Martínez, Martínez and Diazaraque (2011), and Osma and Pope (2011), relate explanations for accounting choices with the status quo. In accordance with these authors, those producing financial statements would tend to not alter the form of reporting, due to hi-gher costs and a departure from a possible “comfort zone”. Thus, in the case of the adoption of IFRS (International Financial Reporting Standards), for example, accounting choices would use procedures closer to existing local ac-counting standards.
In Brazil, studies which address this issue are still few in number. Worth highlighting are those by Costa, Silva and Laurencel (2013), Pereira (2013), and Andrade, Silva and Malaquias (2013), which studied accounting choices from the perspective of the international literature men-tioned.
In this sense, this study seeks to contribute to the evo-lution of knowledge regarding explanations for accoun-ting choices, by employing a methodological approach that is different from the methods applied in positivist--empirical studies, and focusing on a specific area of ac-tivity, in such a way that provides a deeper insight into the subject, in order to set the results against existing li-terature.
Thus, its aim is to offer explanations for accounting choices for measuring investment properties made in companies belonging to the real estate sector that ope-rate in the Brazilian capital market. To this effect, ins-tead of being based on a great quantity of data, it takes an approach which triangulates: (i) descriptive analysis
2 ACCOUNTING CHOICES FOR MEASURING INVESTMENT PROPERTIES
(In-ternational Accounting Standard 40), companies can measure their investment properties by cost or by fair value. The flexibility of the rule results in an explicit accounting choice, and companies’ unders-tanding of this choice has been the focus of studies abroad and in Brazil.
International studies regarding accounting choi-ces for measuring investment properties involve, no-tably, companies listed in Europe that adopted IFRS in 2005. Such studies use a positivist-empirical ap-proach, mainly based on statistical methods and mul-tivariate logistical regression models. Explanations for accounting choices for measuring investment properties, using this approach, are linked to factors such as: debt, information asymmetry, accounting information relevance, results management, politi-cal cost, and change of the status quo. The empirical evidence often leads to inconclusive or even contra-dictory explanations, as can be seen later. And none of them relate the choice to the subject addressed in this study, which is the business model.
Christensen and Nikolaev (2013), in a study with companies from the United Kingdom and Germany, found that debt is one factor that explains the choi-ce of fair value for measuring investment proper-ties. According to the authors, companies prefer the adoption of fair value to maintain their debt ratios at lower levels. This result differs from those found by Quagli and Avalone (2010), which showed that debt does not appear to influence in the choice of fair va-lue, for a sample of companies from seven European countries. In the view of these authors, the bigger a company’s size (a proxy for political cost), the smal-ler the probability of choosing fair value, given that cost seems more efficient from a contractual pers-pective, since it reduces agency costs, political visi-bility, taxation and legal proceedings (Watts, 2003; Qiang, 2007).
For Muller, Riedl and Sellhorn (2008), companies with greater information asymmetry are more likely to use fair value for measuring investment proper-ties, since it is investors’ demands that leads them to choose fair value, and this may be preferred to his-toric cost because it provides users with better qua-lity information (Barlev & Haddad, 2003; Ball, 2006; Whittington, 2008). If there is information asym-metry, managers may choose fair value with a view to informing the market of a company’s “true” value (Quagli & Avallone, 2010). This comparison can be made in investment property companies, since their assets are basically composed of such properties and their fair value measurement is reported, at least in explanatory notes.
Edelstein, Fortin and Tsang (2012), as well as De-valle and Rizzato (2011), believe that the fair value of investment properties has a double effect on the results, since is allows depreciation expenses to be ignored and unrealized gains or losses to be
recog-nized in the results for the financial period, which has a direct impact on various performance indica-tors. The intention to manage results would explain, therefore, the choice between fair value and cost for measuring investment properties.
Muller et al. (2008) found that European com-panies are more likely to choose fair value for me-asuring investment properties when the real estate market in which they operate has greater liquidity. Cairns, Massoudi, Taplin and Tarca (2011) showed that companies with investment properties exhibit a high adhesion to the use of fair value, which is asso-ciated to the liquidity of these properties in relation to other assets. These conclusions show that fair va-lue information is more relevant for the market and could explain it being chosen.
On the other hand, Devalle and Rizzato (2011), Martínez et al. (2011), and Capkun et al. (2008) re-ported that many European companies chose historic cost for measuring investment properties in order to minimize the impact of IFRS, thus maintaining the
status quo.
Collin, Tagesson, Andersson, Cato and Hansson (2009), among other conclusions, highlighted that ownership structure may explain accounting choi-ces. For these authors, companies with fragmented property can incur greater tracking costs, since the-re is little dithe-rect intervention by owners and a gthe-rea- grea-ter use of the accounting system for accountability. Thus, companies with fragmented ownership tend to choose accounting rules which reflect more comple-te, more detailed and less conservative information, that is, which show better results (profits), given that their performance will be compared with other com-panies in the market. In the case of concentration of ownership, the owner (or few owners) does not re-quire such detailed information and wishes to main-tain control, which may lead to more conservative accounting choices (Collin et al., 2009).
International literature covers studies carried out in various countries, with different dates for adop-ting IFRS, which may have influenced the results. Therefore, it is essential that the relevant Brazilian literature be taken into account.
companies (such as debt, level of revenue, among others) and/or related to the capital market in which they operate (information asymmetry, for example), are found that may explain accounting choices. Ho-wever, explanations that linked various characteris-tics (or various factors) to accounting choices were
not identified in the literature.
In this sense, the term business model used in this study captures various company and market charac-teristics, even some which are not envisaged in the literature, with the aim of relating them to choices for measuring investment properties.
3 METHODOLOGICAL PROCEDURES
The empirical stage of this study was guided by a triangulation of methodological approaches, composed of documentary analysis, interviews and consistency analysis of the results found. First, the two largest companies in the real estate sector, one choosing fair value and the other historic cost for measuring investment properties, were selected. In all, twelve Brazilian investment property companies were listed on the BM&FBOVESPA during the pe-riod in which this study was carried out (2012). The two largest companies in the sector together hold more than 23 billion reais in market value and re-present 45% of the total.
With the two companies with their respective financial statements and reference forms for 2012 chosen, documentary research was then carried out, based on the published financial statements and
refe-rence forms filed with the CVM (Comissão de Valores
Mobiliários), the Brazilian Securities and Exchange Commission. Following on from the documentary research, a descriptive analysis of the secondary data obtained was carried out, which allowed for an un-derstanding of the similarities and differences in the two chosen companies’ business models.
The second methodological approach consisted of interviews with players involved directly or in-directly in the entities’ accounting choices, whether they were internal or external to the companies cho-sen. Managers, internal analysts, market analysts, an accountant and an auditor were interviewed.
The interviews were carried out in 2012 and 2013, based on a semi-structured script. At the com-pany that chose fair value, the Investor Relations Department coordinator and the accountant were interviewed. At the company that chose historic cost, the coordinator and two analysts from the In-vestors Relations Department, were interviewed. It was not possible to interview the accountant. The choice of these interviewees was justified by their technical accounting abilities, their participation in company decisions and their availability to concede interviews. The auditor interviewed was, coinciden-tly, the same one that audited both companies. The choice of market analysts was based on the classifi-cation of Thomson Reuters, which ranks those with
most correct predictions for companies in the sector. Via descriptive analysis of the interviewees’ answers, it was possible to understand the arguments inhe-rent to the measurement choices for investment pro-perties.
In order to further validate the results found in the first two approaches, a third methodological ap-proach was adopted: consistency analysis of the re-sults obtained. The next three companies from the same sector of activity, which made different measu-rement choices in relation to investment properties, were identified: two chose fair value and one chose historic cost. These three companies together have almost 15 billion reais in market value and represent 29% of the total for the sector.
As in the first two cases, documentary research was carried out for the three new companies selec-ted. Descriptive analysis of the secondary data ob-tained in the documentary research revealed the characteristics of their business models, which were then set against the accounting choices regarding measuring investment properties, thus widening the results found in the interviews carried out at the first two companies.
All in all, the first two approaches allowed for the identification of the business model as an explana-tion for accounting choices, and the third approach allowed for consistency between business models and accounting choices to be verified, as a way of validating the results from the first two approaches.
None of the five companies studied adopted IFRS
and the technical pronouncements of the CPC (
Co-mitê de Pronunciamentos Contábeis), the Brazilian Accounting Board, before compulsory adoption in financial statements by the end of 2010. The first two companies studied were called “Fair Value Case” and “Historic Cost Case”, preserving their identities,
conditio sine qua non for holding the interviews. The three companies selected for the consistency analy-sis were called “Observed Fair Value 1 and 2” and “Observed Historic Cost”.
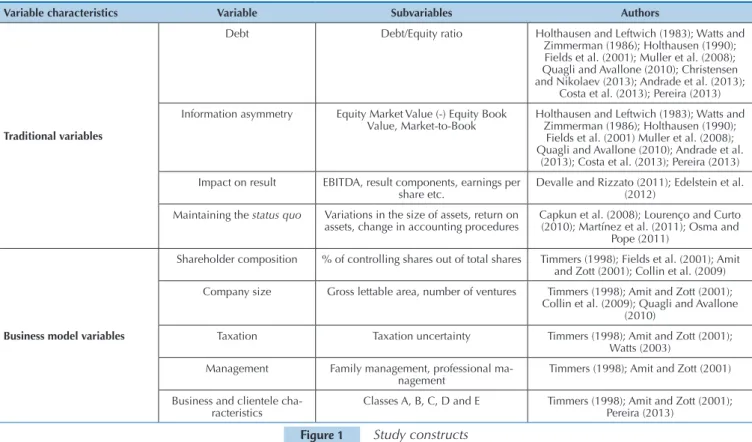
In Figure 1, “traditional variables” were considered to be those widely used in literature regarding accounting choices. hose for debt are traditionally deined as the ra-tios of third-party capital to equity. In this study, qualitative characteristics of debt were also addressed, such as origin (bank loans or securities issued on the market), guarante-es and covenants. he net debt/EBITDA indicator was also considered, due to it being a common covenant in inancial markets.
Regarding information asymmetry, the variable is tra-ditionally the market-to-book indicator (market value per share/equity book value per share) or the diference betwe-en market values and book values of shares. In this study, the “book equity” variable was adjusted to capture the com-panies’ equity book value, considering all investment pro-perties of all companies measured by cost and by fair value. he key variables normally used as measures with an impact on the result of measurements are EBITDA, earnin-gs and earninearnin-gs per share. In this study, the results (proits or losses) were readjusted by reversing the variation in the fair value of investment properties when featured in state-ments of results; the results were also estimated when fair value was relected in the result (both with the respective taxation efects).
With regard to maintaining the status quo, the traditio-nal literature captures variation in assets or even in alter-nations in rates of return on assets. he lower these rates, the more the status quo is maintained. In this study, main-taining of the status quo was captured by the alteration (or
not) in the measurement of investment properties, from historic cost to fair value. Maintaining the status quo oc-curs when historic cost is maintained as the measurement for investment properties.
he variables for business models represent activities and strategies adopted by companies in order to stand out, meet operational and economic needs and create value for stakeholders. For the purposes of this study, shareholder composition was obtained via the percentage of shares un-der main shareholun-der control in relation to the percentage of shares in free loat.
Company size was deined in function of non accoun-ting variables, such as the quantity of area of investment property generating cash low (GLA: gross lettable area), the number of ventures controlled by each company, and the fair value of these ventures.
Regarding tax, taxation uncertainty relating to the tax treatment of variations in the fair value of investment pro-perties in companies’ results was measured, in a qualitative way, without there being a speciic variable.
he type of company management was also measu-red qualitatively: family (managed by the founder or his/ her descendants) or professional (managers contracted on the market). In the same way, the businesses’ clientele was identiied via qualitative descriptions of target public (class A, B, C, D and E) in the management reports of each com-pany analyzed.
Using the variables and constructs in Figure 1 as a base, there follows a presentation and analysis of the results.
Figure 1 Study constructs
4 PRESENTATION AND ANALYSIS OF RESULTS
Variable characteristics Variable Subvariables Authors
Traditional variables
Debt Debt/Equity ratio Holthausen and Leftwich (1983); Watts and Zimmerman (1986); Holthausen (1990); Fields et al. (2001); Muller et al. (2008); Quagli and Avallone (2010); Christensen and Nikolaev (2013); Andrade et al. (2013);
Costa et al. (2013); Pereira (2013)
Information asymmetry Equity Market Value (-) Equity Book
Value, Market-to-Book
Holthausen and Leftwich (1983); Watts and Zimmerman (1986); Holthausen (1990);
Fields et al. (2001) Muller et al. (2008); Quagli and Avallone (2010); Andrade et al.
(2013); Costa et al. (2013); Pereira (2013)
Impact on result EBITDA, result components, earnings per
share etc. Devalle and Rizzato (2011); Edelstein et al. (2012) Maintaining the status quo Variations in the size of assets, return on
assets, change in accounting procedures
Capkun et al. (2008); Lourenço and Curto (2010); Martínez et al. (2011); Osma and
Pope (2011)
Business model variables
Shareholder composition % of controlling shares out of total shares Timmers (1998); Fields et al. (2001); Amit and Zott (2001); Collin et al. (2009)
Company size Gross lettable area, number of ventures Timmers (1998); Amit and Zott (2001); Collin et al. (2009); Quagli and Avallone
(2010)
Taxation Taxation uncertainty Timmers (1998); Amit and Zott (2001);
Watts (2003) Management Family management, professional
ma-nagement
Timmers (1998); Amit and Zott (2001)
Business and clientele
cha-racteristics Classes A, B, C, D and E
Timmers (1998); Amit and Zott (2001);
Pereira (2013)
that can help to explain accounting choices, as shown in Figure 1 and subsequent paragraphs. In it, accoun-ting evidence and the opinions of the interviewees are presented. In the second block, information related to the business model variables, not considered in the traditional literature, and the opinions of the inter-viewees, are presented. The variables and constructs can also be found in Figure 1 and subsequent paragra-phs. Finally, in the third block, the consistency analy-sis is presented, and widens the results obtained in the initial analyses.
4.1 Traditional Explanations from the
Literature
4.1.1 Debt.
Regarding debt/equity ratio, the market analysts’ opi-nion is that this may inluence the choice of criteria for measuring investment properties, if the index is analyzed “pure and simply”. hey argue, however, that the market is not “naive” in making this calculation, and ends up discounting fair value or even capitalizing on it, depen-ding on its “need and convenience”. For them, it would be ideal to calculate inancial leverage, which correspon-ds to net debt divided by EBITDA. he inancial leve-rage indicator estimates the necessary number of years for generating cash in order to pay companies’ liabilities with charges that, according to the analysts, is the “most used multiple” in restrictive clauses for loans (contractu-al covenants). Even though the an(contractu-alysts are not directly involved players in investment property measurement choices, depending on how relevant the capital market is to a company, the accounting choice may also aim to reduce information asymmetries regarding the values of company assets, which directly afects analyst activities.
In the opinion of the auditor, debt can be related to accounting choice since, with fair value, companies would report “higher and prettier numbers” in their ba-lance sheets.
he interviewees for the Fair Value Case argue that debt is not a factor that is related to the accounting choice for measuring investment properties. According to them, restrictive clauses in loan contracts are based on
adjus-ted EBITDA, which discounts the efect of variations in fair value. hey believe that, if fair value were used in debt covenants, this could even “break” the company, if the variation were negative, or covenants would “never” be breached with “constant positive variations”. hey ar-gue that the way of analyzing debt is the same that the analysts recommend: net debt divided by EBITDA (i-nancial leverage).
he interviewees for the Historic Cost Case do not believe in the assumption of the use of fair value for the “protection” of debt. According to them, if someone re-quires fair value in order to comply with restrictive clau-ses for loans, “they will be playing with ire”, given that, at some moments in the economy, the variation in fair value could be negative and it will be necessary to renegotiate debts. However, according to the interviewees, the com-pany does not deny that fair value is a way of “getting into more debt” with increases in the equity value; however, like the market analysts and Fair Value Case interviewe-es, the Historic Cost Case also highlights that covenants are related to multiples of net debt over EBITDA (inan-cial leverage).
Christensen and Nikolaev (2013) concluded that debt can have an impact in companies choosing fair value, whereas Quagli and Avallone (2010), Costa et al. (2013), Pereira (2013) and Andrade et al. (2013) did not veri-fy such an inluence. hese results are inconsistent with those in this study, a fact that can be explained, mainly, by the diference between the debt metrics used in the market, in companies, and in the literature, as well as the diferent practices and opinions of the agents involved in accounting choices. he variables from studies with a high number of observations provide lessons; however these studies do not allow the particularities of each case to be captured, as is presented in this study.
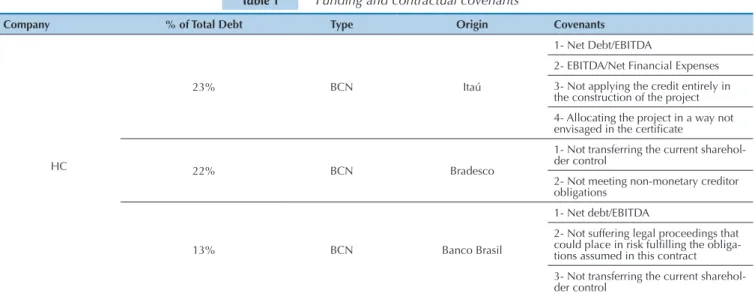
he two companies reported not having breached any contractual covenants for loans in 2012. Yet, the Histo-ric Cost Case is more transparent and indicates the con-tractual clause for each one of its loans. In Table 1, the three main means of funding and contractual covenants associated with each of the companies interviewed are presented.
Table 1 Funding and contractual covenants
Company % of Total Debt Type Origin Covenants
HC
23% BCN Itaú
1- Net Debt/EBITDA
2- EBITDA/Net Financial Expenses 3- Not applying the credit entirely in the construction of the project 4- Allocating the project in a way not
envisaged in the certiicate
22% BCN Bradesco
1- Not transferring the current sharehol-der control
2- Not meeting non-monetary creditor obligations
13% BCN Banco Brasil
1- Net debt/EBITDA
2- Not suffering legal proceedings that
Differences exist in the three main funding mecha-nisms for the two companies. While for the Historic Cost Case BCNs (bank credit notes), are the form of funding, for the Fair Value Case the funding options are international perpetual bonds issued in American dollars, RERCs (real estate receivable certificates), and Brazilian debentures. It is apparent that the funding strategies of the two companies are different: the Histo-ric Cost Case relies on financial institutions, while the Fair Value Case also relies on the credit market.
What draws attention in Table 1 is one non-financial clause, which is more related to shareholder composi-tion than to debt. This clause is present in two BCNs from the Historic Cost Case, and upholds the require-ment to maintain the same controllers, showing that banks are not only placing faith in company perfor-mance, but also in the continuity of founding and con-trolling families at companies, when providing funding. It is therefore established that debt is also a charac-teristic of companies’ business models, since compa-nies exhibit different strategies for maintaining capital structure, which do not explain on their own, however,
the fair value or cost accounting choice for measuring investment properties, in the particular view of the ca-ses studied.
4.1.2 Information asymmetry.
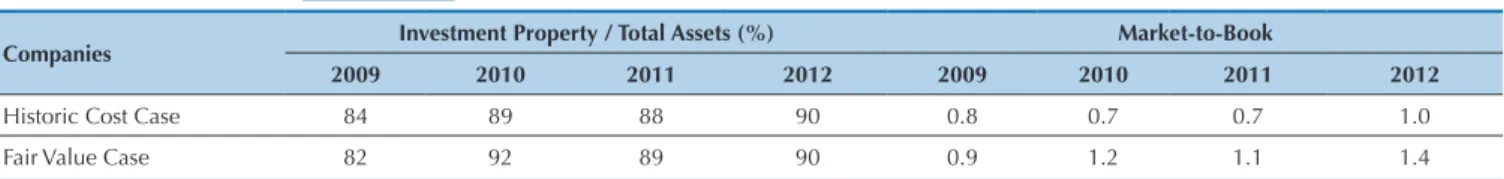
In this subsection the intention is to evaluate whe-ther information asymmetry can explain the accoun-ting choices of investment property companies. A comparison was carried out between the market value (quantity of shares multiplied by the price per share on the last day of trading of each year) and the equity va-lue (adjusted by the fair vava-lue of investment properties contained in explanatory notes, when the cost method is chosen). The aim of this comparison is to identify market-to-book, a proxy for the quality of accounting information, which shows a possible difference in ac-counting information between users within and out-side companies. It is expected that the original equity value from the Fair Value Case and the adjusted equity value from the Historic Cost Case are close to their ma-rket values, since their assets are basically composed of investment properties. The numbers are presented in Table 2.
Table 2 Ratio Investment Property / Total Assets and Market-to-Book
Companies Investment Property / Total Assets (%) Market-to-Book
2009 2010 2011 2012 2009 2010 2011 2012
Historic Cost Case 84 89 88 90 0.8 0.7 0.7 1.0 Fair Value Case 82 92 89 90 0.9 1.2 1.1 1.4
For the Historic Cost Case, adjusted equity value is greater than market value, suggesting that the ma-rket does not price assets according to the fair value information reported in explanatory notes. This may mean that the market “reads” fair value in explanatory notes with some discount, due to there being informa-tion asymmetry between managers’ judgment and the market’s judgment regarding the fair value of invest-ment properties.
When questioned about this point of view, the au-ditor mentions that there is no “rigidity” in the rule, which may “hinder” making comparisons between companies. This occurs because users do not imme-diately “visualize” the differences between companies, since some choose to measure by fair value and others choose to measure by cost.
Another factor that may have an impact on this analysis is the method for obtaining fair value. In some companies, fair value is calculated internally, and in
others, external specialists are contracted to make the evaluation. With regards to this, the auditor states that regardless of whether the evaluation is made by inter-nal of exterinter-nal specialists, the value is “tested” not only in the historic cost companies but also in the fair value ones. The internal evaluation is related to the “ability” of the professionals to carry out the job. The auditor believes that the company’s internal analysts have the “ability” to define fair value.
With respect to the differences between equity value and market value, the auditor responded that this is a “coincidence”, without providing an explanation for the fact, despite believing that the fair value of investment properties “should come close” to the company’s value, since 80% or 90% of the assets are composed of invest-ment properties.
The market analysts argue that the market “likes” having their own evaluations, independent from those reported by companies. With an “independent”
evalu-Source: Developed by the authors based on data from the study. FV
26% Perpetual Bonds (International Subsidiary) Not available
13% RERC Bradesco Not available
6% Debentures (Brazilian Market) 1- EBITDA /Financial Expenses 2- Net Debt/EBITDA
HC = Historic Cost; FV = Fair Value; BCN = Bank Credit Note; RERC = Real Estate Receivable Certiicate.
Source: Developed by the authors based on data from the study.
ation, it is possible for the market to use different dis-count rates and assumptions from those used by com-panies. Hence, they claim that the market “does not necessarily agree” with the fair value reported by com-panies, and that historic cost companies may be being “too optimistic” in their evaluations, thus explaining the differences found between market value and equity value.
The interviewees in the Fair Value Case believe that fair value is a “positive” and “transparent” way of re-porting to the market. For them, the market was not “accustomed to having that” before the adoption of IFRS. They argue that it is the market that has to define the value of firms, yet they believe that the fair value of properties could be a “good indicator” for reaching the value of companies.
When questioned about the calculation of fair value by internal analysts, the initial response was identical to that of the auditor, in their believing in the “pro-fessionals’ ability and competence”. However, the inter-viewees from the Fair Value Case sometimes require “external consulting”, with sampling, in order to vali-date the fair value calculated by internal analysts, and do not use third-party services to carry out all of the evaluations, given the delay that the process would su-ffer, as well as being a more “costly” job. They claim to choose fair value because it involves a form of “disclo-sure” that is close to European companies that are in a “consolidated market”.
The interviewees from the Historic Cost Case claim not to “pass on” fair value via company results because they do not “believe it right”. They report that when fair value is recognized in financial statements (balance sheets and income statements), it ends up “polluting their result”. The gain from fair value “does not exist”. The interviewees claim that, with cash flow statements, analysts verify a company’s situation better, since the gain from fair value in income statements “is of no use at all”.
When questioned about the use of internal metho-ds to calculate fair value, the interviewees from the
Historic Cost Case claimed to do the calculation “one year inside and the other outside”, despite not repor-ting when it is done “inside” or “outside” in explanatory notes, and which independent evaluation company is contracted. The option of doing the evaluation throu-gh internal analysts is due to “economy”, given that the service provided by external specialists can cost four digit values for the contracting company, and since it contains “all of the metrics” that external evaluators ap-ply. The years that it uses an external evaluator, this is due to questions of “conservatism” and in order to have a “neutral ground” with more “governance”. They even said that another point in favor of an choosing inter-nal calculation is the six-month delay for the exterinter-nal specialist to report the evaluation and because the cal-culation, when done by external specialists, “is almost impossible” for the auditing firm to audit.
With relation to the difference between market va-lue and equity vava-lue, they eluded the question initially, claiming not to use this metric to compare the value of the company, and that it is necessary to raise other questions, such as leverage. However, information pre-sented by the company reports that a shopping mall was recently sold for a “value much higher than the fair value”. This point shows the uncertainty that the company is passing on to the market, since fair value, by definition, is the market value of exit, regardless of the way the company is funded. However, it uses the WACC (weighted average cost of capital) as a discount rate, which depends on the capital structure of the company.
With this issue it should be noted that the Fair Va-lue Case gives the impression of wanting to provide the market with better quality information, which is con-sistent with studies by Muller et al. (2008), and Qua-gli and Avallone (2010), while the Historic Cost Case judges that fair value information is irrelevant to the market.
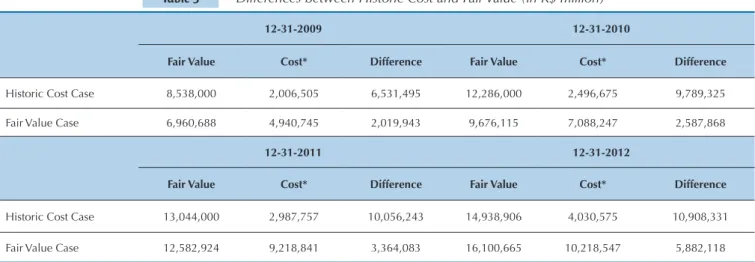
In Table 3, the differences between historic cost and fair value of investment properties are shown. The va-lues are material.
Table 3 Differences between Historic Cost and Fair Value (in R$ million)
12-31-2009 12-31-2010
Fair Value Cost* Difference Fair Value Cost* Difference
Historic Cost Case 8,538,000 2,006,505 6,531,495 12,286,000 2,496,675 9,789,325 Fair Value Case 6,960,688 4,940,745 2,019,943 9,676,115 7,088,247 2,587,868
12-31-2011 12-31-2012
Fair Value Cost* Difference Fair Value Cost* Difference
Historic Cost Case 13,044,000 2,987,757 10,056,243 14,938,906 4,030,575 10,908,331 Fair Value Case 12,582,924 9,218,841 3,364,083 16,100,665 10,218,547 5,882,118
* The value of historic cost, for the Fair Value Case, was calculated from 2010 (adoption of IFRS); in subsequent periods, the appreciation in fair value and de -preciation in the calculations was ignored, for not having a reliable rate and its value being negligible, since, in the sector, projects are depreciated, on average, for 50 years.
he materiality of fair values calculated by companies was directly questioned by the market analysts. Unani-mously and categorically, they said: “it is us who calculate fair value!” hey claimed to ignore fair value in analyses, but did not conirm that all of the market does this. If this is not done, they agree that the discount of fair value can cause “relevant relections” in analyses. he analysts even mentioned how they consider the publication of the fair value of companies that only report it in explanatory no-tes and of those that capitalize on it in balance sheets. Ac-cording to them, despite it being their job to calculate fair value, the value reported serves as a “reference”, is used as an “indicator” and does not diverge much from their calcu-lations. hey pay more “attention” to fair value recognized by companies in their balance sheets, that is, “they spend more time” on this analysis. When fair value is only repor-ted in explanatory notes, they have “less obligation to un-derstand the value”, which ends up “losing force”. In spite of this, they consider the number credible in both forms.
In the opinion of the external auditor, the value is more “impacting” when it is in the result and the balance sheet, since it is a “prettier” number, despite a “personal preferen-ce” for historic cost. He claims that fair value in the whole company is more useful than “baking a cake” only when evaluating investment properties.
For the interviewees from the Fair Value Case, recor-ding fair value in the accounts is “important” for being able to “relect” the company’s worth in market value. hey believe in the usefulness of fair value for analysts and rea-ders of inancial statements. One “driver” is the possibility of showing the market how much a property is worth and how much income it generates, in that it is “more transpa-rent”. Moreover, they believe in the “informative ability” of
fair value.
he interviewees from the Historic Cost Case have a di-ferent opinion of fair value. hey claim that it is going to “pollute” results with proits that “do not exist”, since, for them, fair value reported in explanatory notes is an “im-portant indicator” of how much their investment proper-ties are worth, however they do not believe it to be “right to pass the value on through results”.
In conclusion, it could be shown that companies that capitalize on fair value in their inancial statements have less information asymmetry, and in companies that do not capitalize on it, asymmetry is greater. his implies that the fair value of investment properties of companies that ca-pitalize on it is closer to the value that the market itself establishes for the properties. In the case of those compa-nies that only state fair value in explanatory notes, there is a substantial diference between the stated value and that which the market evaluates, and moreover, the value stated in the notes is consistently higher than market evaluations. From this, it can be inferred that accounting choice for measuring investment properties signals more or less in-formation asymmetry between managers and the market.
4.1.3 Impact on results.
In order to attempt to identify the efects on results using the secondary data, it was assumed from the outset that the fair value option is a way for companies to report better results.
In Table 4, the reconciliation of proits following the reversal of the variation of fair value of investment pro-perties is shown. In this reconciliation, deferred income tax of 34% was taken into account. he result found with the reversal reveals proits hundreds of times inferior to those featured in the inancial statements.
Table 4 Adjusted Profit (in R$ million)
Fair Value Case 2009 2010 2011 2012
Earnings before Interest and Taxes 1,549,349 968,351 1,445,374 3,409,403 Reversal of Fair Value (1,244,596) (567,925) (776,215) (2,518,035) Adjusted Earnings 304,753 400,426 669,159 891,368 Financial Result (6,584) (94,047) (305,693) (433,964)
Proit before IT 298,169 306,379 363,466 457,404
Current IT (29,262) (42,825) (58,934) (100,944) Deferred IT (without IP) - (4,113) (25,406) (92,839)
Adjusted Net Proit 268,907 259,442 279,126 263,621
Reported Net Proit 1,095,086 634,272 789,655 1,925,524
Difference 826,179 374,831 510,529 1,661,903
% Difference 307% 144% 183% 630%
IT = Income Tax; IP = Investment Properties.
Source: Developed by the authors based on data from the study.
In the interviews regarding impact on results and on manager’s remuneration, the auditor and the market analysts responded that this has no relationship with fair value and that this is not taken into account in managers’ remuneration.
With regards to smoothing of results, the analysts believe that this could “make sense” due to the fact that
The auditor claims that having an accounting record of fair value provides “punch”, mainly when companies have in their portfolios projects under development, (greenfields), which are ventures with greater increase in value. In mature businesses, there is less growth and increase in value.
Regarding results management, one hypothesis rai-sed by the analysts was that companies did not adopt fair value due to the volatility of profits, but instead due to the volatility in balance sheets. According to them, in 2009 and 2010, Brazil exhibited “prospects” of a fall in interest rates, and investment properties, being real esta-te with “fixed income characesta-teristics”, would have incre-ased in value. However, companies may be “waiting” for future scenarios, in which interest rates increase again and they need to report a “loss in their property”, a fact that would affect, above all, the value of their assets.
The interviewees from the Fair Value Case believe in volatility, but claim that this “does not worry them”. They state that constant development of new projects “always” ends up “adding” value to the company. With stable gro-wth, without acquisitions and development, they believe that “negative reevaluation” may occur in “some” perio-ds, but “there is nothing to worry about”, since there is no immediate effect on cash flow. Despite taking into the account the possibility of market effects on fair value variation, they believe that the Brazilian market still “la-cks maturity” and requires “clearer” and more “specific” rules with regard to the issue of fair value.
The interviewees from the Historic Cost Case com-municated that the possibility of volatility exists and that analysts face “difficulties” following companies, due to this volatility caused by the market. In addition, they mention that changes in the market with the “reevalu-ation” of investment properties “hide” investments in fixed assets (CAPEX) carried out by companies. They argue that fair value may be used for companies with ne-gative EBITDA that report profits with “other operating revenue” resulting from fair value variations.
This evidence supports studies by Edelstein et al. (2012), as well as Devalle and Rizzato (2011), who claim that the use of fair value can have a double effect, having an impact on various performance indicators and not only on results.
The results achieved by fair value companies with “reevaluation” of investment properties can be a way achieving added value for shareholders. These are main-ly international funds (see subsection 4.2.1) that invest in companies looking for a quick return, achieved with the “gains from fair value”. The opposite occurs in histo-ric cost companies, in which the investors are mainly the founders, who prefer an increase in company value and its consolidation in the market, as opposed to a return exclusively from dividends.
It can be inferred that, for companies that capitalize on fair value, managers are more worried about pre-in-forming the market, via results, regarding performance in managing investment properties; while those that do
not capitalize on it prefer to record investment proper-ty management performance in results, only when it is realized.
4.1.4 Maintaining the status quo.
In the interviews, when the market analysts were asked whether the choice of historic cost was more comfortable for those producing financial statements, they replied that it was not. According to them, this assumption would make sense provided that the rule allowed the historic cost option, but did not oblige fair value to be reported in explanatory notes. The analysts believe that “the job is the same”, whether it is recog-nized in balance sheets or only in explanatory notes, with the difference being that of capitalizing or not on the value. It was also asked whether the introduction of IFRS had changed the level of comfort involved in carrying out analysis work. They responded that, for carrying out the work, the adoption of IFRS did not bring “great changes”, since their analyses are guided by the “business model” and, with the adoption of IFRS, there were no “great changes” in companies’ business models.
The external auditor, like the analysts, believes that the segregation of investment property from fixed as-sets was a relevant change, since it is an income earning property, unlike fixed assets: these generate income in-directly, and the former, in-directly, for example through the receipt of rent.
The interviewees from the Fair Value Case highlight the difficulty of implanting IFRS and fair value in Bra-zil due to assumptions and judgments, and believe that the country still has to evolve a lot. They consider dis-cussions regarding the subject as “positive”, since they “seize the opportunity” to address “wider” concepts, bringing benefits not only to companies, but also to the whole market.
In the Historic Cost Case, the interviewees argue that they did not and do not have any problem with adopting the accounting rules, and that those who “re-quest changes” are the auditors. With the computer system “working perfectly”, the change can be made “smoothly”, and there is no “difficulty” in following the accounting criteria. They cite examples of companies from other sectors that suffered a negative impact from fair value, confirming that historic cost maintains a “state of calm”, which existed when investment proper-ty was treated as a fixed asset. According to the inter-viewees, investors “speak little” about the possibility of adopting fair value and, if there no “legal requirement” for the change, they will not alter the reporting me-thod.
maintai-ning the status quo, as predicted by Devalle and Ri-zzato (2011), Martínez et al. (2011), and Capkun et al. (2008).
State of comfort is also related to shareholder pro-file and with each company’s business model. Historic cost companies, in which Brazilian shareholders pre-dominate, feel comfortable with maintaining it, since there is not yet a culture of evaluating non-financial assets by fair value in Brazil. Fair value companies have a strong presence among international investors who, in their countries of origin (Europe), are used to “ma-rking for market” non-financial assets, and in the end did not experience any discomfort in measuring and reporting investment properties by fair value. This last aspect is explored later, since it is one of the differen-tiating characteristics in companies’ business models.
4.2 Explanations Related to Business Models
In this item, other characteristics, which are diferent from the traditional ones already mentioned and featured in Figure 1, that relate to companies’ business models, are presented. hese characteristics help to understand why accounting choices are multifactoral and that these fac-tors, in the case of Brazilian investment property compa-nies, lie in business models. hey are important factors because they complement the explanations for the ac-counting choices of the companies analyzed.
4.2.1 Shareholder composition.
In order to know the shareholder composition of the companies, the main shareholders and the percentage of control that they held in each company, compared with the percentage in free float, were consulted on the BM&FBOVESPA website. This information is in Table 5.
Table 5 Shareholder composition
Company Number of Main Shareholders Participation of Main Shareholders Free-Float
Fair Value Case 2 13.22% 86.78%
Historic Cost Case 4 73.07% 26.33%
Source: Developed by the authors based on data from the study.
When questioned about shareholder composition, the initial response of the auditor and of the analysts was that this business model characteristic would not have directly influenced in the choice of fair value or cost for measuring investment properties. The auditor believes that a more concentrated company may have “different policies” regarding investments in new ventures from those of less concentrated companies. Companies that are more fragmented on the market may be more “wor-ried” about results, and, for this reason, end up buying businesses with a view to merely “earning money”.
More concentrated companies are also more con-servative, due to their “owners’ vision” and a certain “romanticism”, in the words of the auditor. Because of this, they construct the majority of their businesses instead of acquiring them already built. Also according to the auditor, investment banks are relevant investors in more “fragmented” companies, and these are “more aggressive” with regards to growth. They prefer fair va-lue for measuring investment properties, since this me-asurement anticipates companies’ potential for growth. The market analysts believe that the logic for com-panies with a more fragmented shareholder base adop-ting fair value makes more sense than more concentra-ted companies opting to adopt historic cost. For them, companies with a more fragmented shareholder base would have incentives to adopt fair value, with a view to “showing” their fair value to the market and, for this reason, allocate more “visibility” to the fair value num-ber. However, in less concentrated companies, they do not believe that the non adoption of fair value is due to there being other internal information that
su-pplements it missing from financial statements, among other reasons because this value “is reported” in expla-natory notes.
The interviewees in the Fair Value Case, with its fragmented shareholder base, defend the informative ability of fair value and argue that this is the way by which companies manage to “better portray” the value of their assets. They believe that historic cost does not manage to inform the market how much companies re-ally have in their portfolios and how much these are worth.
The interviewees from the Historic Cost Case, with its shareholder concentration, affirm that minority shareholders and controllers do not have “adverse”, but rather, “completely aligned” interests. However, when questioned about the use of fair value in internal company decisions, they claimed that this value passes through “much more complex” analyses than the ac-count reported. This leads to the assumption that com-panies’ internal controllers have more information and that fair value is not relevant for their decisions.
In accordance with Collin et al. (2009), the results of this subsection show the influence of shareholder composition over the accounting choices made by companies.
4.2.2 Company size and taxation.
Merely with the information from Table 6, it is not possible to accept that, the bigger a company, the less likely it is to choose fair value. The external auditor believes that this should not be taken into account, since the largest companies are visible and considered “icons” in the sector. It would not be the reevaluation of investment property that would change their visibili-ty in the market, however, he believes that balance she-ets reported using fair value feature “prettier” numbers, leading to speculation as to whether “prettier” numbers are not a form of visibility.
The market analysts also do not consider a company’s size to be a “driving factor” in accounting choice, since the companies are listed on the Stock Exchange and, with this, the market eventually perceives its visibili-ty and ends up “evaluating it every second”. In spite of this, they do not deny the possibility of the existence of “vanities”, for companies to appear bigger than others.
However, one point questioned by the analysts was the taxation position of investment properties. They report that, at the moment in which one of the metho-ds for measurement was chosen, there was no “clear understanding” about what would be the tax treatment for income with fair value. The Brazilian Federal Reve-nue Office had not defined, at the time of making the accounting choice, what the tax treatment should be at the moment of sale if properties were “marked for market”. This resulted in some companies that opted for fair value recognizing differed tax and others conti-nuing with historic cost, since it would be “simpler”, at the moment of sale, to pay tax on the difference betwe-en depreciated accounting value and sale value.
The interviewees from the Fair Value Case belie-ve that fair value “draws attention”, mainly in the be-ginning, and argue that attractiveness may occur as a result of the “expressive” and “more relevant” values reported in balance sheets. This fact also occurs with market analysts, who “pay more attention” to fair value when this is recognized in balance sheets. In spite of this, they believe that fair value in balance sheets is not a way of attracting more investors. The taxation ques-tion does not appear to be an important factor for com-panies either, since “accounting and tax balance sheets” are separated, with there being no effect of the reeva-luation of investment properties in tax balance sheets.
The interviewees in the Historic Cost Case believe that fair value “does not make any difference” to the vi-sibility of companies and are confident in “the market’s ability” to evaluate explanatory notes, with no expec-ted reaction to simply “saying” how much a property
“may or is going to increase in value”, Regarding the question of tax, they mentioned that, before the choice between one of the two methods was questioned, they did not obtain a “letter of comfort” from the lawyers, highlighting that that Federal Revenue Office was not going to charge tax on gains from fair value, a fact that did not make the choice of this criterion “comforta-ble”. This situation in which there was a lack of a “clear understanding” of the position of the Federal Reve-nue Office, as argued by the analysts, partly resulted in Normative Ruling n. 1,397, of September 16th 2013 (which was after the interviews).
Contrary to the evidence presented here, Quagli and Avallone (2010), and Pereira (2013) concluded that company size is a characteristic that has an influence over the choice of fair value, since historic cost is linked to contractual efficiency, given that it reduces agency costs, political visibility, taxation and legal proceedin-gs, as explained by Watts (2003) and Qiang (2007).
4.2.3 Family and professional management, busi-ness characteristics and clientele.
The Fair Value Case is fragmented throughout the stock market and the shareholders (international fun-ds) aim for higher and quicker dividends, as a form of return on their investment in the company. Dividend is related to profit and this increased exponentially with the reevaluations of investment properties; however extraordinary dividends, paid with the “gains from fair value”, started being taxed from 2014 onward.
The Historic Cost Case, with its founders in mana-gement and as the main shareholders, did not consi-der this immediate return from fair value interesting, and is more concerned with taxation. The relationship between these controlling shareholders and founders and their companies is more long term than the rela-tionship of international funds with companies.
Companies with a fragmented shareholder base and belonging to the financial market have a greater need for quick results and detailed accountability to their shareholders, who are, basically, international invest-ment funds. These funds, because they are in Europe and the United States, are used to the way of reporting by fair value, due to the fact that there is an active pro-perty market in these places. With a need for rapid de-velopment, the companies normally acquire businesses in operation and seek to serve classes C and D, which are growing exponentially in Brazil.
In the company in which the founders are the con-trollers (Historic Cost Case), the business model is gui-ded by the “owner’s vision”. In this company, projects
Table 6 Comparison of Size of Companies Studied (2nd quarter/2013)
Number of properties GLA (m2) Own GLA (m2) Shopping Malls Managed
Fair Value Case 51 shopping malls 1,620,600 934,900 44 Historic Cost Case 17 shopping malls 712,000 638,959 17
GLA – Gross Lettable Area
are constructed with the desired characteristics, in the intended location, and serve classes A and B. Due to the founders being in the business’ management, fair value is much more useful in the “vision and percep-tion” of the owners than in the reporting in financial statements.
These differences in the business models for the Fair Value Case and the Historic Cost Case are related to the companies’ different organizational and mana-gement strategies to make them competitive and profi-table, adding and creating value to their products, and serving the specific needs of their stakeholders.
In conclusion, the Fair Value Case has professional management (market executives), fragmented control, aggressiveness in the management of the investment properties (it seeks quick results), and a significant part of the debt is in the credit market. It is a company that is more linked to the market and uses fair value to decrease information asymmetry with respect to the market value and performance of its businesses.
The Historic Cost Case is a family company, with fa-mily management as well. Control is centralized in the family and there are few shares on the market. Debt is concentrated in bank loans that are guaranteed by the controllers (family). The management of investment properties is different, since the controllers construct the properties and select the clients. The management is more characterized by family questions than by the market, and for this reason fair value is not relevant in the financial statements.
It is possible to deduce that these management cha-racteristics form part of the business model defini-tions presented by Timmers (1998) and Amit and Zott
(2001), as well as them integrating into the definition of business model presented in this study, since they con-tribute to the establishment of strategies that are able to generate competitive advantage and, consequently, value for the companies and stakeholders.
Thus, these characteristics that are related to the companies’ business models could explain the accoun-ting choices for measuring the investment properties. As this evidence is based on secondary data analysis and interviews, another test was carried out in order to provide greater consistency to the results, as is laid out in the following subsection.
4.3 Consistency Analysis and Widening of
Results
Via the analyses carried out up until here, the diffe-rence found in the two companies chosen is perceived to lie in the business model: each one has different infor-mational characteristics and needs, which could result in different accounting choices for measuring the invest-ment properties.
The aim of this subsection is to provide consistency to the findings that business models can explain accoun-ting choices. This consistency analysis was carried out with the next three companies in the sector (after the first two previously analyzed), and is also based on 2012, in order to widen the results found.
In Table 7, a comparison between the business mo-del characteristics of the previously analyzed companies (Historic Cost Case and Fair Value Case), and the busi-ness model characteristics of the three additional com-panies looked at are presented, for the purposes of con-sistency analysis.
Table 7 Business model characteristics of the companies studied
Historic Cost Fair Value
Source
Case Observed Case Observed 1 Observed 2
Concentrated shareholding Conirms Fragmentated sharehol-ding
Conirms Partial BM&FBOVESPA website
Founder as controller Conirms Various investors Conirms Conirms Minutes Constructs the businesses Conirms Adquires the businesses Conirms Doesn’t
con-irm
Corporate proile
Serves classes A & B Conirms Serves classes C & D Doesn’t conirm Conirms Standard of the businesses, leaseholders and location
Few and large businesses Conirms Many and small busi-nesses
Conirms Partial GLA/number of businesses ratio
Low leverage Conirms High leverage Conirms Conirms Debt/Equity ratio Non-inancial covenants Doesn’t conirm Financial covenants Doesn’t conirm Conirms Explanatory notes
BCN Conirms RERC and securitization Conirms Doesn’t
con-irm
Explanatory notes
Market to book < 1 Conirms Market to book > 1 Conirms Partial Index calculation
BCN = Bank Credit Note; RERC = Real Estate Receivable Certiicate; GLA = Gross Lettable Area.
As can be verified, almost all of the business model characteristics analyzed in this study in the companies interviewed were confirmed in the observed compa-nies. In Observed Historic Cost, the only characteristic that was not confirmed was the existence of non-finan-cial covenants. Despite the company having concentra-ted ownership, with the founding family in control and in the company’s management, the funding providers did not demand the maintaining of this control in the loan clauses, as occurred in the Historic Cost Case, even though the loan mechanisms were similar (BCN).
The two companies that chose historic cost for mea-suring investment properties hold large businesses and aim to serve the highest classes in Brazilian society. To achieve this, they prefer to construct the businesses and maintain the standard expected by the controlling family. Moreover, they are not dependent on the finan-cial market and hold few businesses, all with high ad-ded value.
With relation to the choice of measuring investment properties by fair value, observations were made of two companies from the sector. In Observed Fair Value 1, two characteristics were not confirmed: existing cove-nants, which go beyond the financial clauses with the presence of non-financial clauses, such as maintaining management; and the serving of classes C and D, since the company is much diversified and its businesses ser-ve all social classes.
Despite the two non complete confirmations, the two fair value companies (Fair Value Case and Obser-ved Fair Value 1) are greatly fragmented in the stock market, with shareholders strongly linked to the finan-cial market (professional management). In this way, they are more aggressive and require a shorter period of return on their investments, preferring to buy busi-nesses that are ready and rented, which generate im-mediate cash flow. In order to buy businesses that are ready, they depend on more loans and other forms of funding (RERC), compared to companies that opt for
historic cost. However, there is a restriction in Obser-ved Fair Value 1: it exploits commercial buildings and premises, and the Fair Value Case exploits shopping malls.
In order to soften the restriction of the first compa-rison, a second observation was carried out in a com-pany that also exploits shopping malls. The fragmented shareholding was partially confirmed in Observed Fair Value 2 since, unlike the Fair Value Case and Observed Fair Value 1, Observed Fair Value 2 has two controllers.
In relation to the acquisition of businesses, Obser-ved Fair Value 2 did not confirm this characteristic: the company constructs businesses. Due to the fact that it serves classes C and D, it is similar to the company in-terviewed and this characteristic was confirmed.
Observed Fair Value 2 exhibits a higher leverage than the others in the sector and, like the Fair Value Case, does not exhibit non-financial covenants. Howe-ver, the way it captures financial resources is not via RERC, but this fact is related to another difference be-tween the companies, which is the construction of the businesses.
The companies that buy businesses, such as the Fair Value Case and Observed Fair Value 1, require diffe-rent forms of funding in order to support their invest-ments (RERC and securitization); and the companies that construct withdraw credit in financial institutions to support the construction phase of businesses (BCN), thus exhibiting different funding structures. The ma-rket value indicator for Observed Fair Value 2 is close to 1, which indicates that it is almost at the same level as the Fair Value Case and Observed Fair Value 1.
The observations, both in the companies that opted for historic cost and in those that opted for fair value, exhibited points that are not exactly the same, but are at least similar. This shows that the business models found in the companies interviewed may make sense in the observed businesses, which extends the results of the interviews to other investment property companies.
5 CONCLUDING REMARKS
The literature presents partial explanations regar-ding accounting choices, almost all modeled on the Theory of the Firm and the Theory of Agency, which are based on relationships between individual (or sin-gle) characteristics (or factors) and the accounting choices made by agents. This opens up an opportunity for advancing understanding of accounting choices, since various interacting characteristics (or factors) can be incorporated to explain such choices. In the case of this study, by considering the aggregation of various characteristics (or factors) as a business mo-del, it was possible to deduce, with some certainty (taking much into account the small sample repre-senting basically the whole of the analyzed sector),
that the business model is a predominant factor in ex-plaining accounting choice for measuring investment properties, in publicly traded real estate management companies in Brazil.
management characteristics, and dependence on cre-dit and capital markets.
Traditional explanations in the literature regarding making accounting choices (debt, information
asym-metry, impact on results, and maintaining the status
quo), according to studies by Capkun et al. (2008),
Muller et al. (2008), Quagli and Avallone (2010), Lou-renço and Curto (2010), Martínez et al. (2011), Osma and Pope (2011), Devalle and Rizzato (2011), Edelstein et al. (2012), and Christensen and Nikolaev (2013), can also be found in the five main real estate compa-nies operating in the Brazilian capital market that are researched in this study. And the business model in-corporates (totally or significantly) these individual factors that explain accounting choices as if they were a single variable, making it possible to relate business model with accounting choice.
The influence of debt over accounting choices for measuring investment properties was verified, throu-gh the existence of two new factors not previously con-sidered in the literature on investment properties: debt calculated via net debt divided by EBITDA, and the existence of non-financial covenants.
Information asymmetry was observed in the com-panies analyzed, bearing in mind the divergence be-tween the accounting values and market values for the companies, even though investment properties com-pose a significant part of their assets.
Regarding the impact on the results of the compa-nies studied, the use of fair value in measuring invest-ment properties has a double effect, and that is, the companies may choose fair value with the debt/equity ratio in mind, for example, instead of just focusing on profit or loss.
In relation to maintaining the status quo, the com-panies’ internal agents expressed that, even with un-certainty regarding fair value, the expertise required for calculating and reporting it exists, but in the His-toric Cost Case, it will be recognized in the financial statements only by legal requirement, bearing in mind that such assets were recorded by historic cost in fixed assets before IFRS.
In the case of Brazilian investment property com-panies, it was verified that the business model charac-teristics (shareholder composition, business and clien-tele characteristics, and management characteristics) may explain choices for measuring these assets; that is, different business models imply different accounting choices.
The company that applies fair value is controlled by international funds and uses the credit market, while the company that applies historic cost is
fami-ly controlled and relies on financial institutions. Fur-thermore, one of the covenants of the company that applies cost is for not transferring corporate control. This situation indicates that, for the company that ap-plies cost, a critical element in the obtainment of bank funding is the importance and influence of the con-trolling family. In this case, the financial statements and potential use of fair value in order to report higher results are not important factors, which justifies the choice of historic cost. The company that applies fair value seeks to follow the international standard for the sector, so as to maintain the attention of international investment funds, which may explain the choice of this method for measuring investment properties.
The consistency analysis intended to compare of the results derived from the documentary study and interviews with the two biggest real estate companies, and the results derived from the documentary resear-ch on the next three biggest companies in the same sector. The analysis revealed that the companies that made the same accounting choice for measuring in-vestment properties feature similar business model characteristics. The final result of this study, which covered the five main Brazilian investment property companies, reveals that the business model of these companies can offer additional explanations for their accounting choices for measuring investment proper-ties. It can thus be understood that accounting choices can be explained by a wider set of economic-financial, managerial, and strategic characteristics of companies. These explanatory factors can be added to those that are known in the literature, such as contracts, oppor-tunistic behavior, results management, and informa-tion asymmetry.
However, it is very important to highlight that the results presented here cannot be generalized (study li-mitations), since they are restricted to the companies studied, which were few in number (even though the sample represents almost all of the relevant publicly traded companies that manage real estate). However, this study shows, nevertheless, that accounting choices can have deeper explanations when various characte-ristics (or factors) are related together. This is a clear opportunity for future studies.