Organization of the business process of a real estate
agency, using an information system supported by a
regression model
Egor Gulakov
Work carried out under the supervision of
Prof. Paulo Jorge Matos Prof. Marina Rasskazova
Organization of the business process of a real estate
agency, using an information system supported by a
regression model
Dissertation for the title of Master in Information Systems
High School of Technology and Management
Egor Gulakov
The High School of Technology and Management is not responsible for the opinions
Acknowledgments
I would like to express my deep gratitude to the ICM Erasmus + International Credit
Mobility for the opportunity to study in one of the best European institutions. This program
allowed me to gain invaluable knowledge from highly qualified professors, improve my
English and find new friends from all over the world. Separately, I would like to thank my
supervisor - Professor Paulo Jorge Matos, for his patience and tremendous help in writing my
master's thesis. Thank supervisor of the home institute - Marina Rasskazova for good ideas.
Also thanks to my parents - Olga Gulakova and Konstantin Moroz, for investing in me time,
love and care, brought up in me a person. I love you and will try to live up to your
expectations! I thank my friend Vahan Vahanyan and neighbour Zhenya Selivonchik for their
Abstract
The effectiveness of the functioning of the real estate market depends on the level of
development of the management structure of enterprises. It is necessary to create an
information and analytical base that meets the requirements and wishes of the client. This
product should have functions that simplify the process of searching and selling real estate,
and also have a positive effect in the activities of the real estate agency. [B 15]
We created an information system of the real estate agency, which is aimed at
satisfying the needs of the client and increasing the comfort when using the product.
The first step was to conduct an analytical study of the real estate agency "Galleon",
the main organizational charts were reflected, the agency's activities were described in detail.
Next, it was necessary to make demands on the future information system. On UML -
Diagrams, the functions and processes of the future program were described in detail, the
roles of the main actors were characterized. All the diagrams were built in the program "IBM
Rational Rose".
The next step was the development and construction of a mathematical model for
calculating the cost of the apartment. At this stage, we used the package for regression
analysis included in the MS Office Excel.
The final stage was the development of the main product - the information system of
the real estate agency. The program was created using Visual Studio 2017, on the ASP.NET
platform. The C # programming language was used. The information system database was
implemented usign markup language – XML.
Index
Acknowledgments ... v
Abstract ... vii
Index ... ix
List of Figures ... xii
List of Abbreviations ... xiii
Introduction ... 1
1.1. Goals ... 1
1.2. Structure of the document ... 2
Inspection of the Galleon agency ... 3
2.1. Description of activity of real estate agency Galleon ... 3
2.2. Technical model of the Galleon real estate agency ... 4
2.2.1. Program model of the Galleon real estate agency. ... 4
2.2.2. Information model of the Galleon real estate agency ... 5
2.2.3. Organizational scheme of the Galleon real estate agency ... 6
2.2.4. Topological model of real estate agency ... 7
2.2.5. “Problems tree” of real estate agency ... 8
2.2.6. Justification of need of creation of an information system ... 9
Beginning of design ... 10
3.1. Description of subject domain ... 10
3.1.1. Purposes and system designations ... 11
3.1.2. Deployment diagram ... 11
3.1.3. Justification of the choice of ASP.NET platform ... 12
3.1.4. Justification of the choice of XML and database ... 13
3.1.5. Comparison of XML data and relational data ... 14
3.1.6. Determination of the data required for work ... 15
3.2.2. Designing a business model for a real estate agency ... 18
3.2.3. Description of the transaction process ... 19
3.2.4. Building a detailed model of business ... 20
Model for forecasting prices ... 27
4.1. Theoretical justification of the method ... 27
4.1.1. The classical normal linear model of multiple regression ... 28
4.1.2. Estimation of the parameters of classical regression of the model by the method of least squares ... 28
4.1.3. Evaluation of the significance of multiple regression. The coefficients of determination R2 ... 29
4.1.4. Multicollinearity ... 31
4.1.5. Selection of the most significant explanatory variables in the regression model 32 4.1.6. Linear regression models with variable structure. Dummy variables ... 32
4.2. Implementation of the mathematical model for forecasting prices... 33
Implementation ... 37
5.1. Create a spreadsheet ... 41
5.2. Add an entry to the database ... 42
5.3. Delete an entry from the database ... 42
Quick start guide ... 45
6.1. Introduction ... 45
6.2. Preparing for work ... 45
Conclusion ... 53
7.1. Problems ... 54
7.2. Future work ... 54
Bibliographic references ... 55
Attachment A ... 1
List of Tables
Table 1 - Technical characteristic of the workstation ... 4
Table 2 - Software used by the real estate agency ... 5
Table 3 - "Registration apartment" and "Search for objects" ... 16
Table 4 - Maps ... 16
Table 5 - Feedback ... 17
Table 6 - Employees ... 18
Table 7 - Client model description ... 21
Table 8 - The director ... 23
Table 9 - Employee model ... 24
List of Figures
Figure 1 - Information model of the Galleon real estate agency ... 6
Figure 2 - Organizational scheme of management of Galleon real estate agency ... 7
Figure 3 - Topological model ... 7
Figure 4 - The tree of problems ... 8
Figure 5 - Deployment diagram ... 12
Figure 6 - Conceptual Business Model ... 19
Figure 7 - Deal process ... 20
Figure 8 - Client model ... 21
Figure 9 - The director ... 22
Figure 10 - Employee model ... 24
Figure 11 - Statistical data for Omsk ... 34
Figure 12 - Matrix of coefficients of pair correlation ... 35
Figure 13 - Regression statistics... 35
Figure 14 - The variance analysis ... 36
Figure 15 - Default page ... 37
Figure 16 - Pages ... 38
Figure 17 - Default .aspx ... 38
Figure 18 - Regisrtation ... 46
Figure 19 - Log in ... 46
Figure 20 - Registration apartment page ... 47
Figure 21 - Search an apartments ... 48
Figure 22 - Search results ... 49
Figure 23 - Calculation of the apartment’s cost ... 50
Figure 24 - Feedback page ... 51
Figure 25 - Administrator page ... 52
List of Abbreviations
AIS - Automated Information System
ASP.NET - Active Server Pages for .NET
CASE - Computer Aided Software / System Engineering
C# - Object-oriented programming language
HTML - HyperText Markup Language
RDF - Resource Description Framework
UML - Unified Modeling Language
Chapter 1.
Introduction
The principle of an integrated approach to customer needs is the cornerstone activity
of Galleon real estate agency. The list of the services provided by the agency covers all parts
of the relations arising upon transition of the property rights, privatizations of the land and
structures, commissioning of the objects of the real estate to rent, the lawsuits connected with
the real estate and the land. Also real estate assessment is carried out, professional
photography of the object offered to sale is carried out.
Relevance of this work is that registration and timely processing of a large number of
data, including data storage about objects, is necessary for carrying out any kind of
transactions. Constant control of updates and the changes in price, characteristics and
existence of objects to sale, is necessary for optimization of work of real estate agency.
1.1.
Goals
This work aims the development of an Automated Information System (AIS) to the
Galleon real estate agency. The object of the research is the Galleon real estate agency.
The creation of an AIS to a real estate agency will allow:
- to reduce operating time on search of objects for the client;
- to reduce the number of the routine operations carried out by the experts;
- to reduce the labor required to collect and register the input information;
- to organize the output information;
- to create a database of the sold objects;
To achieve this goal, it is necessary to solve the following problems:
- research of real estate agency "Galleon" before the beginning of designing;
- definition of the organizational scheme of the agency;
- identify and characterize the requirements of the Galleon real estate agency;
- drawing up functional, information, technical, program and topological models;
- drawing up a problems tree;
- design of an information system;
1.2.
Structure of the document
The work includes a theoretical, analytical and practical part, that are described in this
dissertation in 5 chapters.
The first chapter includes an introduction to the work and describes the need to create
a product.
In the second chapter, we described the main activities of the agency, identify the main
problems and, proceeding from them, the goals and objectives.
In the third chapter, the requirements for future work are presented and describe the
structure of the program using the UML diagram. It is also justified the choice of tools and
programming languages, used in the development of the information system.
The fourth chapter was devoted to regression analysis. We calculated the importance
of the factors necessary for constructing a mathematical model for calculating the cost of an
apartment.
The fifth chapter includes a description of the code and basic formulas used in writing
the program.
Chapter 2.
Inspection of the Galleon agency
2.1.
Description of activity of real estate agency Galleon
The real estate agency is a specialized commercial organization that supplies, as rule,
intermediary services between the seller and the final buyer in the real estate market.
The purpose of a real estate agency is to facilitate and promote business among sellers
and buyers of real estate properties, guaranteeing that both parts have a good deal and that the
real estate agency wins money with that.[B 15]
The main goals of the real estate agency are:
- improving the quality of work;
- customer satisfaction;
- increase in positive feedback about the agency;
- receiving a profit;
- development and expansion of activities.
The main services provided by real estate agency:
- purchase - property sale;
- search of sellers and buyers;
- legal support of the transaction;
- check of purity of a real estate object;
- registration in the public or other authorities of an object according to the
transaction;
- legitimation of changes in a real estate object.
A real estate agency present several advantages to the potential clients. A wide range
of properties and a highly specialized and dedicated service. The staff of real estate agency
daily works on extension of the database of apartments, and well in it is guided. The real
estate agency daily adds new and new options to the base, and the employees offer them to
the clients for viewing. The agency undertakes all work on the organization of meetings
between sellers and buyers of apartments.
Therefore possibilities of acquisition or property sale by means of the agency are
much wider, than to look for necessary option independently.
2.2.
Technical model of the Galleon real estate agency
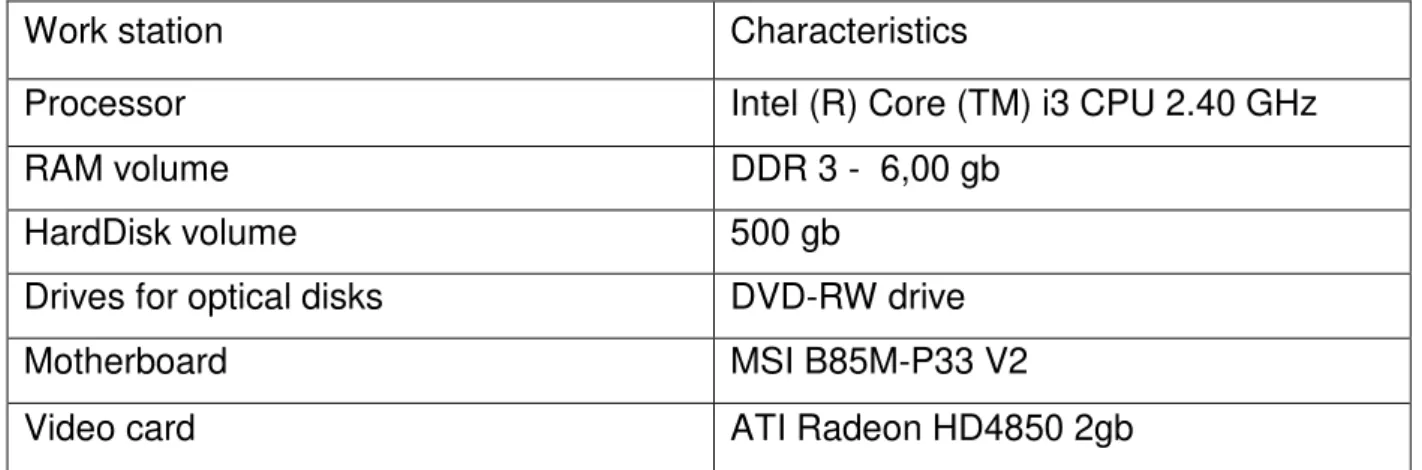
Technical model of the agency - hardware of jobs at office or in other workplace. In
the agency workplaces, the personal computers characteristics are the ones presented in the
Table 1.
Table 1 - Technical characteristic of the workstation
Work station Characteristics
Processor Intel (R) Core (TM) i3 CPU 2.40 GHz
RAM volume DDR 3 - 6,00 gb
HardDisk volume 500 gb
Drives for optical disks DVD-RW drive
Motherboard MSI B85M-P33 V2
Video card ATI Radeon HD4850 2gb
2.2.1.
Program model of the Galleon real estate agency.
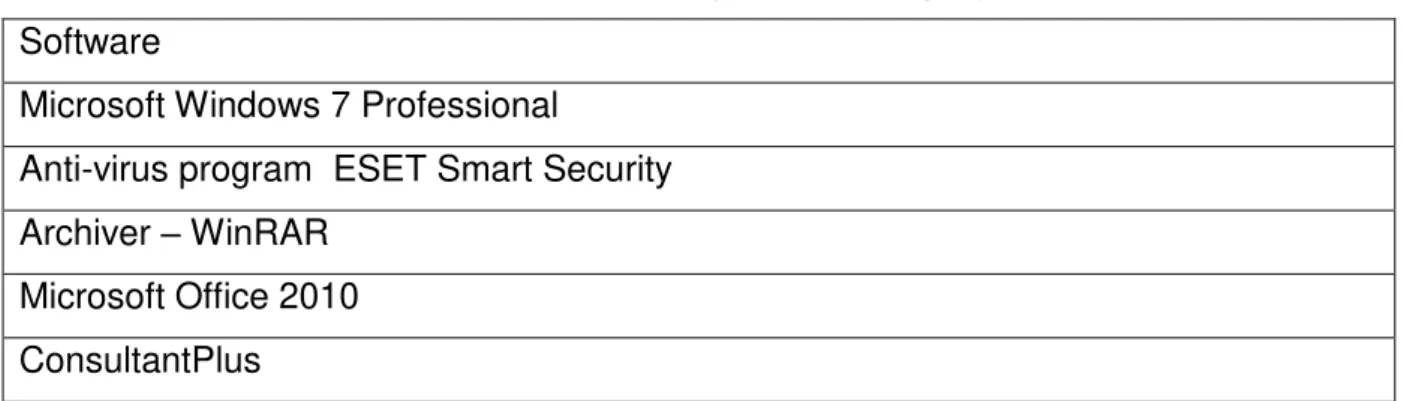
A minimum set of the generic and specific software is required for the employees
Table 2 - Software used by the real estate agency
Software
Microsoft Windows 7 Professional
Anti-virus program ESET Smart Security
Archiver – WinRAR
Microsoft Office 2010
ConsultantPlus
The Microsoft Windows 7 Professional - an operating system with which specialists of
the agency work. Anti-virus program ESET Smart Security - the anti-virus program that
provides data protection on the computer and at the internet access, blocking attempts of
malefactors to take control of data. Archiver - WinRAR - widely used archiver thanks to
whom the employees can squeeze large volumes of data, for example, sending to the client a
selection of objects with a large number of photos. Microsoft Office 2010 is used to prepare
documents, namely reports. ConsultantPlus is an electronic version of Federal Laws of the
Russian Federation and the Civil Code of the Russian Federation. They are necessary for
drawing up the agreements, contracts and other documents participating in various processes
of real estate agency and governing the relations between the client and the agency.
2.2.2.
Information model of the Galleon real estate agency
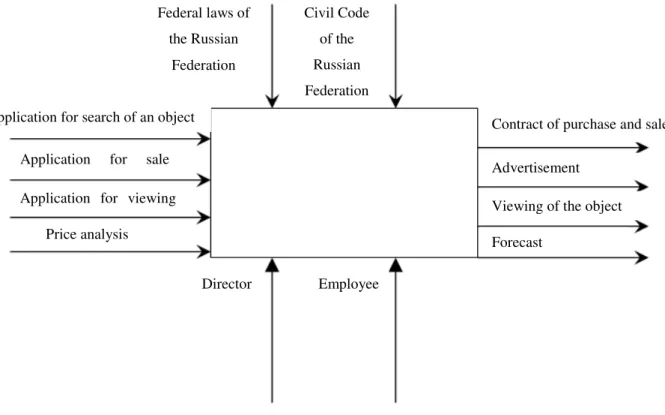
In the course of studying of document flow of real estate agency Galleon, and also
obtaining additional data from the staff of the agency, it was built an information model in
which the Director and Employees take part, being guided by federal laws of the Russian
Federation and the Civil Code of the Russian Federation. As entrance, information serves the
application from the client for search or sale of a real estate object, or the analysis of data on
real estate prices. At the exit, we receive the contract of purchase and sale, the forecast of the
prices or the announcement in an information system and on various advertising websites.
Figure 1 - Information model of the Galleon real estate agency
2.2.3.
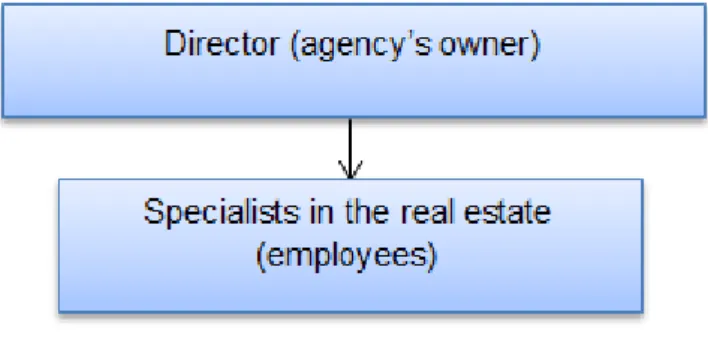
Organizational scheme of the Galleon real estate agency
During performance of analytical work, it was made the organizational scheme of
management in the Galleon real estate agency presented at Figure 2.
The organizational scheme in real estate agency Galleon includes 2 elements: The
main element is the Director of real estate agency who bears responsibility for all operations
with the real estate performed by him or the staff of the agency. The Director also provides
training in the agency, exercises supervision of work of the employees. The second element is
the team of experts. Under sensitive supervision of the director, they carry out operations with
the real estate and with the information system, entering necessary data about the objects. The
experts also carry out all communications with the client, advising them, holding meetings
and providing verification of documents when carrying out the transaction. Federal laws of
the Russian Federation Civil Code of the Russian Federation
Application for search of an object
Application for sale объекта
Price analysis Application for viewing объекта
Director Employee
Contract of purchase and sale
Advertisement
Viewing of the object
Figure 2 - Organizational scheme of management of Galleon real estate agency
2.2.4.
Topological model of real estate agency
The topological model is a conditional representation of the room in which object of
automation settles down Figure 3.
The real estate agency includes 10 jobs of realtors. Six personal computers with the
characteristics specified in the Figure 3, and 4 laptops. Existence of one personal computer
and one laptop for the administrator (director) is provided. Existence of the laptop is
necessary for mobility and for holding meetings abroad with clients. Also at office, a printer
is necessary to print documentation and contracts. Wi-Fi router is necessary for ensuring
access to Internet.
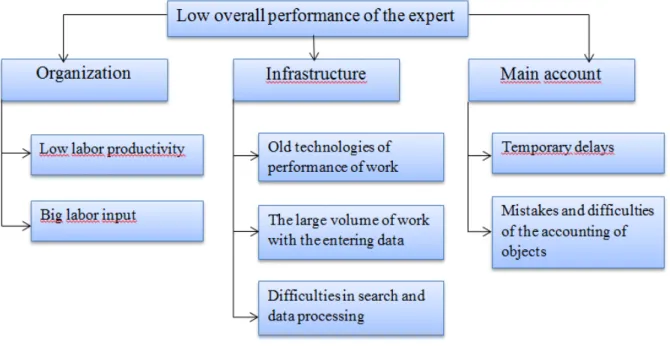
2.2.5.
“Problems tree” of real estate agency
"The tree of problems" is a multilevel structure on which the revealed problems are
located in a hierarchical order of Figure 4.
Figure 4 - The tree of problems
This tree represents the set of problems structured, constructed by the hierarchical
principle in which the main problem and subproblems of the second and subsequent levels
subordinated to it is allocated.
Perhaps, not all problems influencing achievement of goals are revealed, but the most
2.2.6.
Justification of need of creation of an information system
Before starting development of personalized software solution, it is necessary to be
convinced that this decision is proved. [M 08]
At the moment, the Galleon real estate agency has not a database with the data about
the solded objects. Employees process all data manually and on the basis of the obtained
information fill in tables. In this case, it is very high the probability of commit a mistake when
fill a document or loss/damage a document.
Besides, at the moment, the staff of the agency has only local access to data that
creates additional difficulties and big loss of time in the course of work.
The developed AIS of real estate agency will allow:
- to reduce operating time on creation of announcements;
- to reduce the number of the operations carried out by the experts;
- to reduce the labor to collect and register the information about new objects and to
fulfill the applications to search for an object;
- to structure output information;
- to create a database of the real estate objects which are available on sale;
- to reduce time necessary for work with a real estate object or the client;
- to provide online - access to data that will provide mobility and besides will
reduce time;
- to increase quality of feedback supplied by the clients.
- it is easy and fast to change the personal data and privilege rights of the
employees, namely to assign responsibilities and tasks.
Thereby, the information system will allow reduce considerably amount of the time
spent by the employees searching the necessary object, it will allow to structure data that
considerably will increase productivity of work of the department, and also it will grant to the
Chapter 3.
Beginning of design
3.1.
Description of subject domain
This system is intended for the accounting of the properties available to sell - data
recorded by the staff of the enterprise. The system allows to issue the client application, to
provide it the catalog of apartments and the price list of all real estate properties.
Description of business processes of subject domain
Adding a property to the database:
- the expert receives a call from the client;
- depending on the type of client (seller/buyer), he fills in an application for the
purchase or sale of a property;
- the client receives the invitation in office (time is discussed);
- the client comes to office in due time;
- the client describes the premises of the intended real estate object (the location,
the number of rooms, existence of property, etc.)
- the expert enters these premises in the database.
At the future work, the client should be able to introduce directly the data of the real
estate object in the database, and the administrator will only need to confirm the conditions by
3.1.1.
Purposes and system designations
The system is intended for automation of an information system of real estate agency.
Users of system can perform the functions more effectively, thereby increasing the working
capacity. Less time will be spent with proceedings, increasing work efficiency.
The list of the functions of system providing achievement of goals
- the accounting of the arriving real estate objects;
- the accounting of the existing real estate objects;
- the accounting of the sold real estate objects;
- granting statistics of the sold real estate objects;
- search of real estate objects;
- function of feedback with the client;
- viewing of an arrangement of an object on maps;
- sorting of objects according to any criterion;
- viewing and editing information on employees;
- calculating the cost of an apartment.
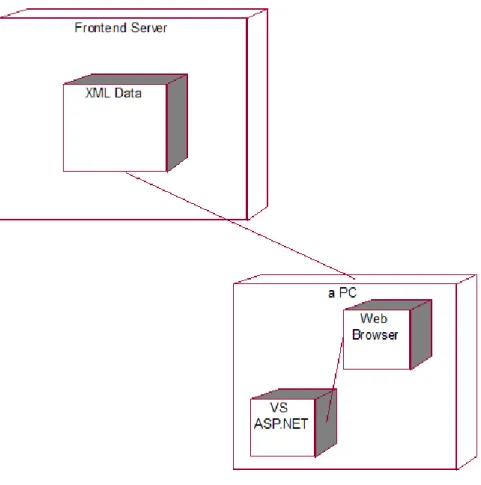
3.1.2.
Deployment diagram
The deployment diagram is intended for visualization of elements and components of
the program, existing only at the stage of its execution (runtime). In this case, only the
component-instances of the program that are executable files or dynamic libraries are
represented. Those components that are not used during the execution phase are not shown in
the deployment diagram. [M 08]
The deployment diagram contains graphical representations of processors, devices,
processes, and connections between them (Figure 5). Unlike diagrams of logical
representation, the deployment diagram is unified for the system as a whole, since it must
Figure 5 - Deployment diagram
3.1.3.
Justification of the choice of ASP.NET platform
We use the ASP.NET platform to develop the information system. ASP.NET (Active
Server Pages for .NET) is a technology for creating Web applications and web services from
Microsoft. Structure of Pages and Controls ASP.NET is a programming structure that runs on
a Web server for dynamically creating and displaying ASP.NET Web pages. ASP.NET Web
pages can be viewed in any web browsers or client devices, ASP.NET displays markup (such
as HTML) in the requesting browser. Typically, you can use the same page for different
browsers, because ASP.NET displays the appropriate markup for the requesting browser.
ASP.NET Web pages are completely object-oriented. The structure of ASP.NET pages and
controls also encapsulates the general functionality of the user interface into convenient
reusable controls. Controls written once can be used in many pages. They are embedded in an
ASP.NET web page, on which they are placed during rendering. The structure of ASP.NET
standard behavior that can be used for all pages (or a group of pages) in the application. Next,
we can create separate content pages that include the content associated with the page that we
want to display. When users request a content page, the output page is a combination of the
structure of the main page and content from the content page. We can also manage the
authentication of a Web application using Windows groups or its own role database using
ASP.NET roles. These schemes are easy to add, remove or replace, depending on the
requirements for the application. This platform was chosen for development because it
includes the "designer" mode, which is easy enough to use at the initial level of programming.
Also during the creation of the information system, we used the programming
language C#. To date, the programming language C# is one of the most powerful, fast
growing and demanded languages in the IT industry. At the moment, it writes a variety of
applications: from small desktop programs to large web portals and web services that serve
millions of users every day.
Compared to other languages, C# is quite young, but at the same time it has already
gone a long way. The first version of the language was released with the release of Microsoft
Visual Studio .NET in February 2002. C# is object-oriented. C# supports polymorphism,
inheritance, operator overload, static typing. The object-oriented approach allows solving the
tasks of building large, but at the same time flexible, scalable and extensible applications.
And C# continues to develop actively, and with each new version there are more and more
interesting functionalities, such as lambda, dynamic binding, asynchronous methods, etc.
3.1.4.
Justification of the choice of XML and database
Now various database management systems, differing with both the opportunities and
requirements to computing resources, are applied to creation of information systems.
The most important characteristics of this DBMS are:
- simplicity of administration;
- possibility of connection to Web;
- speed and functionality of the mechanism of the DBMS server;
- existence of means of remote access [C 08].
XML is the new Standard Generalized Markup Language (SGML) derivative markup
language of documents, allowing to structure information of different types, using for this
Today XML can be used in any applications which need the structured information -
from difficult geographic information systems, to huge volumes of transmitted data. A set of
tasks for which XML can be used:[C 08]
- First of all, this technology can be useful to developers of difficult information
systems, with a large number of the appendices connected by flows of information
the most various structures. In this case, XML documents carry out a role of a
universal format for exchange of information between separate components of the
big program.
- XML is the basic standard for the modern resource description language -
Resource Description Framework (RDF), allowing to simplify many problems in
Web connected with search of information, ensuring control of contents of
network resources, creations of electronic libraries, etc.
- The XML language allows to describe data of any type and is used for submission
of specialized information. It means that XML can serve as powerful addition to
HTML for distribution of "non-standard" information in the Web. Perhaps, in the
near future, XML will completely replace HyperText Markup Language (HTML),
at least, the first attempts of integration of these two languages already become
(extensible hypertext markup language - XHTML).
- Information, which is contained in XML documents, can change, be transferred to
the client machine and be updated in parts. The developed XML Linking
Language (XLink) and Xpointer specifications is tumblinge down to refer
separate elements of the document, with the accounting of their enclosure and
values of attributes.
- XML can be used in usual applications for storage and processing of the
structured data in a uniform format. [C 08]
The main advantage of XML documents is that it is easy to create and process (the
usual text can be edited by any test processor and be processed by standard XML analyzers),
but it is also easy to produce structured information which computers well "understand".
Data of XML are internally ordered as an example from our program.
tables. Each type of data is stored in columns. Each record is presented as a line on the table.
The order of lines in the table is not connected with any streamlining of data, unlike XML
where internally present order of the document influences, for example, it affects the data
returned. Only the elementary relational data can be stored in one table; The typical relational
database has a data in different tables. For example, in the table Customers can be a field (or a
column) CustomerID. Identification of orders for the specific user is facilitated by the
existence of the corresponding value in the table Orders CustomerID column. The
relationship between data can be "one-to-one", “one-to-more”, more-to-more. Each of these
relations can be represented by data storage in two or more connected tables. Relational
databases usually have no hierarchy per se unlike XML documents. [C 08]
Summarizing, we can briefly list the difference between XML and relational
databases:
- The XML data is hierarchical; Relational data are presented in the model of
logical relationships. The XML document contains information about the
relationships between data items in a hierarchical form.
- The XML document contains not only data, but also tags that explain this data.
One XML document can contain different types of data. In the relational model,
the data content is specified in the column definition. All data in the column must
be of the same type.
- XML data has its own order; relational data does not have this order. For the order
of the data in an XML document is received the order in which you specify the
data items. As a rule, there is no other way to specify the order of data in the
document. [C 08]
3.1.6.
Determination of the data required for work
For further development of the automated system, it is necessary to define and
describe entities.
In the program there will be forms, one of which (Registration apartment) is necessary
for addition of an object with use of certain criteria, and second (Search for objects) is
necessary for search of objects in base by the set criteria. This is shown in Table 3. These
forms will be almost identical on structure, as the criteria used in the description of an object
Table 3 –“Registration apartment” and “Search for objects”
Name of attribute Description of attribute
ID_Area District of the city
Type_object Housing type: primary or secondary
Type_of_Apartment Number of rooms
Material_Construction Material of construction of the house
Number_of_floors The number of floors in the house
Floor Floor
Area Area of the object
Address Object address
Street Object street
House_№ House number
Building_№ Building number
Price Object cost
E-mail E-mail of the client
Phone Phone number of the client
In the tab to Search for objects, it is necessary to add a viewing with online maps
containing the available apartments. This is a very useful feature – for example, a client
moved to our city recently that badly knows names of streets or areas, could easily find an
object for purchase visualizing online map and choose the option which is most suitable for
him. A description of the main elements of this menu is shown in the Table 4.
Table 4 – Maps
Name of attribute Description of attribute
Address Address form
ID Object ID
The Feedback menu will be available to the administrator and workers. Very often
happens so that the client finds for himself suitable option and the following step which he
should make – is establishment of communication with the agency or the expert in more
are other good arguments, if the time zone of client is distinct of the agency, direct contact
could not be easy to do. The expert, in a hurry, loses contacts of clients which it is necessary
to contact for examination or specification of details and a set of other options. Therefore it
was decided to organize a simple form of feedback for clients. The client will choose a
suitable object then the form with already entered data on an object will be available in base.
The client will need only to add a contact information for feedback and to leave the comment,
or to submit its question in the corresponding window. Then the administrator or the
employee will receive the application which will be stored in the information system. A
description of the main elements of this menu is shown in the Table 5.
Table 5 - Feedback
Name of attribute Description of attribute
Name Name of the client
Phone Phone number of the client
E-mail E-mail address of the client
Comments Comments of the client on an object
Message The message for the client
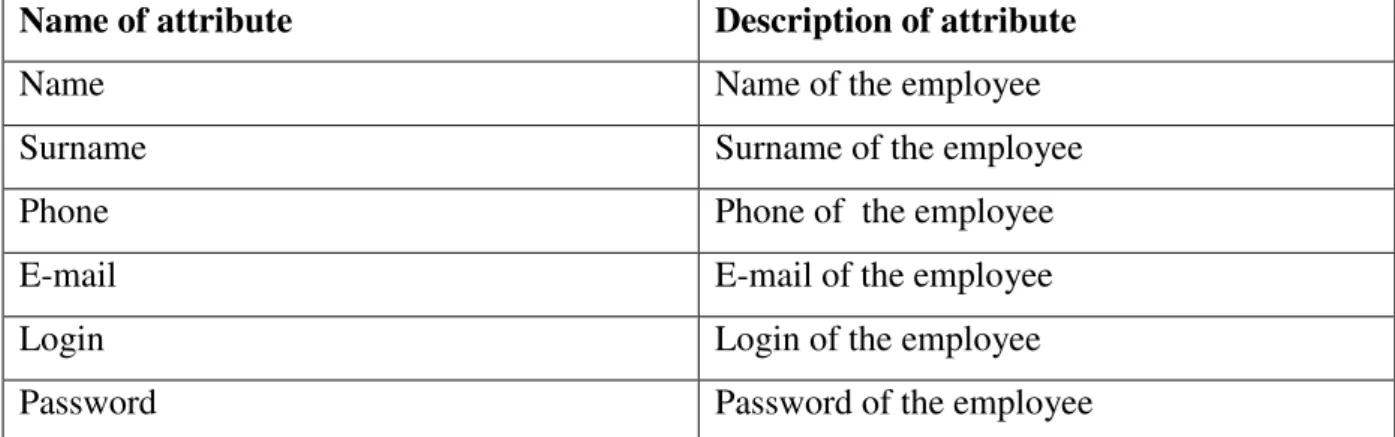
As it was told before, in our information system users are divided into three types:
administrator, employee and guest. We will create another menu for the administrator. Here
will be the data of registered users: Name, Surname, Phone number, Login, Password and
E-mail of each user. The administrator can register new users, change data on the available users
and delete data of the dismissed user. This is the table where will be stored the registration
data of all users authorized to access the system. A description of the main elements of this
Table 6 - Employees
Name of attribute Description of attribute
Name Name of the employee
Surname Surname of the employee
Phone Phone of the employee
E-mail E-mail of the employee
Login Login of the employee
Password Password of the employee
3.2.
Design of information system software
3.2.1.
Justification of the choice of CASE tools at the design stage
CASE-tools (from Computer Aided Software / System Engineering) allow us to
design any system on the computer. A necessary element of system and structural analysis,
CASE tools allow us to model business processes, databases, software components, activity
and structure of organizations. Practically applicable in all areas of activity. The result of
applying CASE-tools - optimization of systems, reducing costs, improving efficiency,
reducing the probability of errors. [W 08]
The most suitable is Rational Rose, this tool has the greatest functionality.
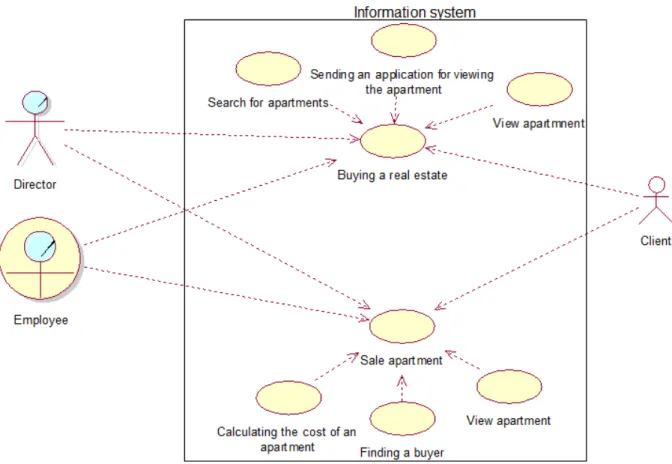
3.2.2.
Designing a business model for a real estate agency
The main purpose of the real estate agency is the sale and purchase of real estate. As
actors, there are: worker, director, client. Figure 6 presents a conceptual business model,
Figure 6 - Conceptual Business Model
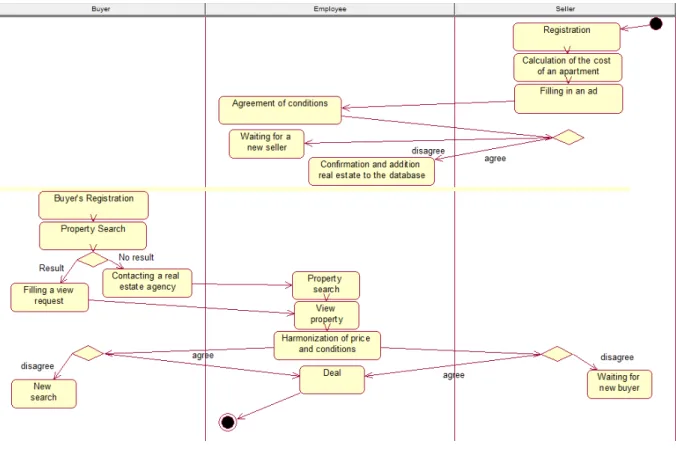
3.2.3.
Description of the transaction process
The main purpose of the real estate agency is the purchase and sale of apartments. We
need to understand how the process of buying and selling an apartment from the beginning to
the end. In practice, this process looks like this: The first thing the seller do is to register in
our system and calculate the cost of his apartment using our price calculation function.
Further, he fills in the necessary fields and sends an advertisement on the sale of his
apartment to our base. After receiving the application, the agency employee contacts the seller
and agrees the selling price and all the conditions. If the seller agrees, the agency employee
confirms and adds the ad to the main database. Further, the buyer appears in the process and
is similar to the seller, being registered to gain access to the system. After this, the buyer
carries out an independent search or immediately appeals to the agency. Once the suitable
apartment is found, the agency employee shows the apartment to the buyer. If after viewing
the apartment, the buyer is satisfied with everything, then the employee calls the seller,
Figure 7 - Deal process
3.2.4.
Building a detailed model of business
Functional requirements must be in accordance with the context and objectives set by
the Business Requirements. Requirements that do not contribute to achieving the Business
Objectives of the project should not be included in the project. The problems concerning the
image and boundaries must be resolved to the specification of the detailed functional
requirements.[M 08]
As mentioned earlier, our project involves: a client, an employee and a director. UML
diagrams will be used to display the roles, functions and dependencies of each actor. As you
can see, Figure 8 shows the Client model. Description of the actor, its main functions and
Figure 8 - Client model
Table 7 - Client model description
Actors Specification
Client Describe Uses agency services. After
registration can perform the
necessary operation with real
estate: to look for an
Send an application for an
inspection of the apartment;
Calculate the cost of an
apartment and so on
Attributes Full name, phone number,
e-mail, login, password,
comments
Privilege Significant restriction on
access rights
Figure 9 shows the Director's model. This is the main actor who has access to any
function, can change the rights for other participants, can change the structure and
functionality of the program itself. Description of the model “The director” is in Table 8.
Table 8 - The director
Actors Specification
Director Description Sets rights for other users;
Changes or limits the
functionality of the program;
Confirms the registration of
users, has direct access to the
database
Attributes Full name, phone number,
e-mail, login, password
Privilege Highest level, full access
Next, consider the model employee. This actor does not require a self-registration in
the system. The administrator needs to add a questionnaire and an account for the new
employee. The employee has access to most of the functions. Consider this model in Figure
Figure 10 - Employee model
Table 9 - Employee model
Actors Specification
Employee Description Processes incoming requests
from customers; Adds an
apartment to the base; Has a
apartment
Attributes Full name, phone number,
e-mail, login, password
Privilege Limited access
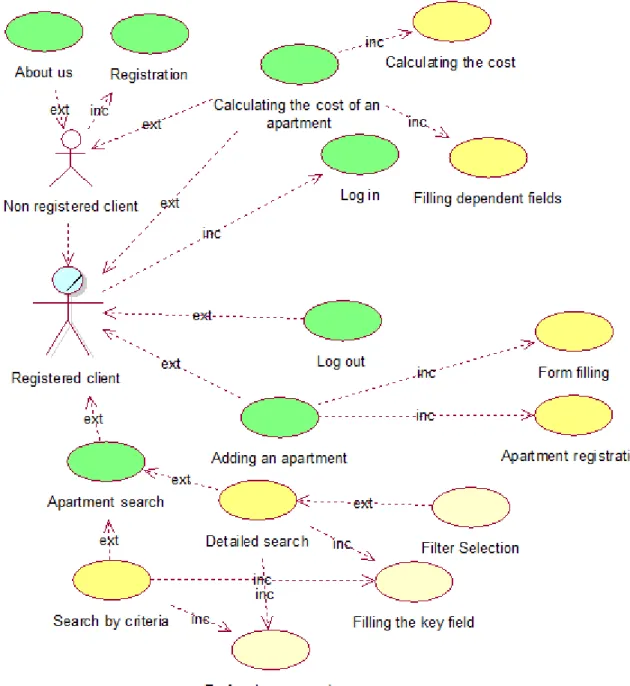
After we have built UML diagrams for each actor, we need to describe the meaning of
main use cases. Brief description we reflected in the table 10.
Table 10 - Use Cases description
UseCase name Description
Log in / Log out Action User authorization in the
system
Actors Client, Employee, Director
Calculating the cost of an apartment
Action Calculating the cost of an
apartment based on
regression statistics
Actors Client, Employee, Director
Adding an apartment Action Fill out the form and
registration of the apartment
in the database
Actors Client, Employee, Director
Apartment search Action Search for an apartment
according to the specified
criteria. Detailed search
includes the ability to use
filters.
Actors Client, Employee, Director
Administration Action View the database of real
estate, change and delete
apartments from the database.
The ability to sort by any
Actors Director
Feedback Action Receipt of applications from
customers, filling out the
form and sending a response.
Actors Director, Employee
Administration of
employees
Action Add, edit and delete any
information about employees.
Including login data
Chapter 4.
Model for forecasting prices
4.1.
Theoretical justification of the method
This chapter will describe and build a mathematical model for forecasting prices.
While writing this part of the thesis, additional literature was used for a more accurate
description of the mathematical model.
The effectiveness of the functioning of the real estate market, largely dependent on the
development of its administrative structure and the level of information security of the
governance structure, acquires a strategic importance at the macroeconomic level. Therefore,
for the solution of regulatory and management problems, it is necessary to fulfill such
conditions as the creation of an information and analytical database that satisfies the
requirements of reliability, completeness and accuracy of the source information that
facilitates the adoption of well-founded management decisions, the optimization of the
distribution of real estate objects by types, Formation of strategy and management programs,
minimizing the costs of maintaining the management system. [KP 02]
Fulfillment of the proposed conditions and, as a consequence, the solution of the tasks
posed require information about trends in the market development, which can only be
obtained by combining qualitative and quantitative approaches to forecasting the main
indicators of the real estate market revealed as a result of systemic studies. They contribute to
the development of integrated thinking in the process of developing and making managerial
decisions. [KP 02]
System analysis of any component of the socio-economic system, including the real
determine which trends are activated and relevant in a given situation. However, a qualitative
analysis of the relevant tendencies and variables is not able to provide an objective assessment
of the behavior of the system due to the limited examples of the systems being studied. This
determines the need to use, along with a qualitative approach, quantitative methods and
models that can take into account the complexity of the systems under study and the processes
that take place in them. [R 15]
At the present stage, the needs for the forecast information required for effective
management are not fully met. This indicates the relevance of setting and solving the
problems of developing and testing models for forecasting the main indicators of the real
estate market. Forecasting, as one of the forms of state regulation, serves as a base stage,
precedes the development of programs, plans, strategies for socio-economic development.
The main function of forecasting is the formation of scientific prerequisites for making
managerial decisions in market conditions [R 15].
4.1.1.
The classical normal linear model of multiple regression
Economic phenomena are usually determined by a large number of both the
cumulative effects of factors. In connection with this, the problem frequently arises of
investigating the dependence of one dependent variable Y on several explanatory variables
X1, X2, ..., Xn. This problem is solved with the help of multiple regression analysis.
i-th observation of the dependent variable yi, and xi1, xi2, ..., xip are explanatory
variables. The multiple linear regression model is presented as:
Equation 1
where i = 1,2,..., n. [KP 02]
4.1.2.
Estimation of the parameters of classical regression of the model by the
method of least squares
To estimate the unknown parameter vector β is applied the method of least squares.
Equation 2
The solution of the equation is the vector
Equation 3
Where (X'X) -1 is the matrix inverse to the coefficient matrix of system (Equation 2)
X'Y is a matrix-column, or vector, of its free terms.
Finding the matrices entering into equation (Equation 2). The matrix X'X represents
the matrix of sums of the first powers, squares and pairwise products of n observations of the
explanatory variables:
Equation 4
The matrix X'Y is a vector of products of n observations of explanatory and dependent
variables: [KP 02]
Equation 5
4.1.3.
Evaluation of the significance of multiple regression. The coefficients of
determination R
2As in the case of the paired regression model, in the multiple regression model, the total variation
Equation 6
Equation 7
Equation 8
The multiple regression equation is significant (H0 hypothesis that the parameters of the regression model are zero, that is, H0: β1 = β2 = ... = βр = 0 is rejected), if
Equation 9
where Fα; p; n-p-1 is the tabular value of the Fisher-Snedekor F-test, and QR and Qe are
determined by formulas (Equation 8) and (Equation 7). [KP 02]
Evaluation of the significance of regression coefficients using Student's t-test is
reduced to the calculation of the value:
Equation 10
where mbi is the mean square error of the regression coefficient bi, it can be
determined by the formula:
Equation 11
Equation 12
R2 characterizes the proportion of the variation of the dependent variable due to the
regression or variability of the explanatory variables; the closer R2 to unity, the better the
regression describes the relationship between explanatory and dependent variables.
At the same time, the use of only one determination coefficient R2 for selecting the
best regression equation may not be sufficient. In practice, there are cases when a poorly
defined regression model can give a relatively high coefficient R2. [R 15]
The disadvantage of the determination coefficient R2 is that it increases with the
addition of new explanatory variables, although this does not necessarily mean an
improvement in the quality of the regression model. In this sense, it is preferable to use the
corrected determination coefficient R2, determined by the formula:
Equation 13
4.1.4.
Multicollinearity
Multicollinearity is understood as a high mutual correlation of explanatory variables.
Multicollinearity can be manifested in functional (explicit) and stochastic (latent) forms.
In the functional form of multicollinearity, at least one of the paired links between
explanatory variables is a linear functional dependence. In this case, the matrix X'X is special,
since it contains linearly dependent column vectors and its determinant is zero, that is, the
precondition for regression analysis is violated. This leads to the impossibility of solving the
corresponding system of normal equations and obtaining estimates of the parameters of the
regression model. [KP 02]
However, in economic studies, multicollinearity is more often manifested in a
stochastic form, when there is a close correlation between a minimum of two explanatory
variables. The matrix X'X in this case is nonsingular, but its determinant is very small.
To eliminate or reduce multicollinearity used a number of methods. The simplest of
0.8), one variable is excluded from consideration. At the same time, what variable to keep and
what to remove from the analysis, decide primarily based on economic considerations. If from
the economic point of view none of the variables can be given preference, then keep one of
the two variables that has a greater correlation coefficient with the dependent variable. To
eliminate multicollinearity can be used the transition from the initial explanatory variables X1,
X1, ..., Xn interconnected fairly close correlation, the new variables representing linear
combinations of the original. At the same time, new variables must be weakly correlated, or
generally uncorrelated. As such variables, take, for example, the main components of the
vector of the initial explanatory variables studied in the component analysis. Next, regression
is considered on the main components, in which the latter act as generalized explanatory
variables that are subject to further meaningful (economic) interpretation [KP 02].
4.1.5.
Selection of the most significant explanatory variables in the regression
model
Another possible method for eliminating or reducing multicollinearity is the use of
step-by-step procedures for selecting the most informative variables. For example, in the first
step, only one explanatory variable is considered that has the largest coefficient of
determination with the dependent variable Y. In the second step, a new explanatory variable is
included in the regression, which, together with the originally selected one, forms a pair of
explanatory variables, which has the highest (corrected) coefficient of determination with Y.
At the third step, another explanatory variable is introduced into the regression, which
together with the two originally selected forms a triple of explanatory variables, having the
largest (corrected) coefficient of determination with Y, and etc.
The procedure for introducing new variables continues as long as the corresponding
(corrected) determination coefficient (more precisely, the minimum value ) increases.
[R 15]
4.1.6.
Linear regression models with variable structure. Dummy variables
In practice, it is often necessary to study the influence of qualitative features that have
Qualitative characteristics can significantly affect the structure of linear relationships
between variables and lead to a discontinuous change in the parameters of the regression
model. In this case, it is necessary to study regression models with a variable structure or to
construct regression models from heterogeneous data.
There is an approach that allows one to evaluate the influence of the values of
quantitative variables and levels of qualitative characteristics using a single regression
equation. This approach is associated with the introduction of fictitious (manikin) variables,
or mannequins.
A qualitative difference can be formalized using any variable that takes two different
values, not necessarily "0" or "1". However, in econometric practice, fictitious variables of
type "0-1" are almost always used, since the interpretation of the results obtained here is the
simplest. [R 15]
If the considered qualitative feature has several (k) levels (gradations), then a discrete
variable is introduced into the regression model, taking the same number of values.
4.2.
Implementation of the mathematical model for forecasting
prices
There are various tools for implementing similar tasks such as: Statistics views,
economic views, Statgraphics, etc. Easy to use add-in Excel «Analysis Package" because it
provides all the essentials, and also gives us the opportunity to continue to program in VBA
and build interface. [R 15]
We have chosen the data of Omsk’s real estate to build a model for forecasting prices of real estate.
Dependent variable - the cost of one square meter of real estate. Independent - the
number of rooms, area of the city, floor, total area, type of house, material. [B 15]
Figure 11 - Statistical data for Omsk
Figure 11 introduces the following notation:
Y – the price of real estate (thousand rubles per square meter);
X1 – area of the city;
X2 – type of building;
X3 – number of rooms;
X4 – material;
X5 – total area (sq.m.);
X6 – floor;
X7 – number of floors;
It is necessary to build correlation-regression models. A matrix of coefficients of pair
Figure 12 - Matrix of coefficients of pair correlation
A multi-factor model is being constructed where Y - the price of real estate is the
response, X1 - area of the city, X2 - type of building, X3 - number of rooms, X4 - material,
X5 – total area, X6 – floor, X7 – number of floors, - factors.
The multifactorial model has the form:
Y=48460,28984-662,178713*X1-9787,767077*X2-3873,487154*X3-1164,713507*X4+
201,1990145*X5+1750,138678*X6+879,0563569*X7
Figure 13 shows the regression statistics.
Figure 13 - Regression statistics
The multiple correlation index (multiple R) is equal to 0.93, which means a
pronounced tightness of the influence of factors on the result.
The coefficient of multiple determination (R-square) is 0.88, which shows the high
quality of the model built.
The adjusted coefficient of determination (normalized R-square) is 0.88. This means
that the correction of the R-square had a high influence on the value of the coefficient of
determination. [R 15]
The standard error is 510.6, which means a good forecast quality.
Figure 14 - The variance analysis
F = 141.03, the significance of F = 8.28, which means a high significance of the result.
The constructed model has a high coefficient of determination - 88.28%, which allows
using it in forecasting.
During the analysis of the coefficients can be concluded that the constructed model
Chapter 5.
Implementation
The program is implemented in C # ASP # in Visual Studio 2017. The program is
located on a hosting server that supports Windows. Visual Studio allows to run the program
on the local computer. In this case, there is no need to install a virtual server. Visual Studio
does this automatically and opens the program in the WEB browser, installed on your
computer by default (Figure 15): [V 07]
Figure 15 - Default page
As you can see from the figure, the program consists of seven pages:
• Registration • Add Apartment • Search for object • Feedback
• Administrator • Employees • Calculate cost • About
Figure 16 - Pages
When the program starts, the registration window of the Default.aspx page appears
(Figure 17):
Figure 17 - Default .aspx
The program provides three types of users: "Administrator", "Employee", "Guest". In
Application.Lock();
if (Application["mode"] == null) Application["mode"] = ""; Application.UnLock();
}
If Application["mode"] = 1 - is an administrator, if Application["mode"] = 2 - is an
employee, if Application["mode"] = 3 - is a guest. For synchronization sessions used blocking
flow Application.Lock(); And Application.UnLock();
The user enters his data into the text fields "Name", "Log In", "Password" (Figure 17).
The program reads them from the database and sets the corresponding Application ["mode"].
If this is an administrator, then all tabs of the pages become available (see Figure 15). [O 05]
Logins and passwords of registered employees are stored in the file Emploes.xml:
<?xml version="1.0" standalone="true"?>
- <NewDataSet>
- <Employees>
<ID>2</ID>
<Name>Kirill</Name>
<Surname>Postevoy</Surname>
<Phone>933-677-375</Phone>
<E_Mail>[email protected] </E_Mail>
<Login>levon</Login>
<Password>987</Password>
<Date>5/15/2017</Date> </Employees>
- <Employees>
<ID>3</ID>
<Name>Vahan</Name>
<Surname>Vahanyan</Surname>
<Phone>010-55-38-65</Phone>
<E_Mail>[email protected]</E_Mail>
<Login>vahan</Login>
<Password>375</Password>
<Date>5/15/2017</Date> </Employees>
</NewDataSet>
The ReGister.xml file where it was wrote down, it was edit and stored data about real
estate:
<Building>2</Building> <Price>1790000</Price> </Egor> <Egor> <ID>14</ID> <ID_Area>Kirovsky</ID_Area> <Type_Object>Primary </Type_Object> <Apart>3</Apart> <Mat_Const>Brick</Mat_Const> <Num_Floors>10</Num_Floors> <Floor>5</Floor> <Area>100</Area> <Street>Pushkina</Street> <House>10</House> <Building>1</Building> <Price>1420000</Price> </Egor> </NewDataSet>
The first line XML of the document is called the announcement of XML (declaration)
it is the optional line specifying the version of the XML standard. [O 05]
Let's pay attention to a tag of "NewDataSet". As we work with DataSet, at
preservation of contents of DataSet in the XML file, this tag is added automatically.
Besides the file has tags of "ID" - the identifying number of record (it is unique),
"ID_Area" - the area, "Type_Object" - Primary or Secondary housing, etc.
Customer applications are stored in the file Admin.xml:
<?xml version="1.0" standalone="true"?> <NewDataSet>
<Admin>
<ID>3</ID>
<ID_Area>Sovetsky</ID_Area>
<T_Object>Secondary</T_Object>
<Apart>3</Apart>
<MatConst>Panel</MatConst>
<N_Floors>5</N_Floors>
<Floor>3</Floor>
<Area>75</Area>
<Street>Lenina</Street>
<House>12</House>
<Building>2</Building>
<Price>2300000</Price>
<Name>Dmitry</Name>
<Phone>933974583</Phone>
<Mail>[email protected]</Mail> </Admin>
The data on the registered guests is in the Log_pass.xml file:
<password>qwerty</password>
<name>Ivan</name> </Regis>
<Regis>
<ID>6</ID>
<login>Dima</login>
<password>17412g</password>
<name>Dmitry</name> </Regis>
5.1.
Create a spreadsheet
Consider the source code of the program for ReGister.xml.
Three class objects are described:
DataTable table = new DataTable("Egor"); - creates a table named
"Egor"
DataSet dataSet ; - Manages the database (reads, writes, edits)
DataColumn column ; - creates a table column
The initXML() function is called once when the page loads:
protected void initXML() {
column = new DataColumn();
// We need to initialize it. The type of the column, we need
to specify the type of .Net
column.DataType = Type.GetType("System.Int32"); column.ColumnName = "ID"; // column name
// Field autoincrement, and if AutoIncrement set to "true"
and the field type is not "int", then we get exeption
column.AutoIncrement = true;
column.ReadOnly = false; // can not be changed
column.Unique = true; // unique
table.Columns.Add(column); // add to the table
See the full code in the attachment A.
Function Read(); - reads data from the server and writes them to the GridView1
control:
private void Read() {
try
{
dataSet.Clear();
The Write() function writes data to the server:
private void Write() {
dataSet.WriteXml(Server.MapPath("~/" + "ReGister.xml")); GridView1.DataBind();
}
5.2.
Add an entry to the database
protected void Button_Registration_Click(object sender, EventArgs e) {
DataRow row; // a class object for adding one object
row = table.NewRow();
row["ID_Area"] = TextBox3.Text; row["Type_Object"] = TextBox4.Text; row["Apart"] = TextBox5.Text; row["Mat_Const"] = TextBox6.Text; row["Num_Floors"] = TextBox8.Text; row["Floor"] = TextBox9.Text; row["Area"] = TextBox7.Text; row["Street"] = TextBox10.Text; row["Building"] = TextBox11.Text; row["House"] = TextBox12.Text; row["Price"] = TextBox2.Text; row["Mail"] = TextBox13.Text; row["Phone"] = TextBox14.Text; row["User"] = Label_user.Text; row["Buy_Sell"] = false;
row["Date"] = DateTime.Now.ToShortDateString(); table.Rows.Add(row);
GridView1.DataBind();
Write();
ClearTextBox(); // Clear all text fields
}
5.3.
Delete an entry from the database
protected void Button_Delete_Click(object sender, EventArgs e) {
try
{
if (table.Rows.Count != 0 && index != -1) {
else
{
Label_Info.Text = "Error: Selected Row"; }
} catch
{
Label_Info.Text = "Error: Selected Row"; }
Chapter 6.
Quick start guide
6.1.
Introduction
Brief description of the possibilities
The developed information system is designed to automate the processing of
information on real estate, the implementation of forecasting prices for real estate, as well as
maintaining a database of real estate.
Purpose and conditions for the application of the information system
The developed information system will allow to automate the processes of gathering
information about real estate; to calculate the preliminary cost of an apartment to any user;
and will also provide the ability to independently search for real estate for any user
Work with the information system is available to all users with the set access rights.
6.2.
Preparing for work
The procedure for downloading data and programs
To start working with the information system on the user's workplace, follow these
steps:
After starting the program - the Login and Registration page will open.
Figure 18 - Regisrtation
After passing the registration, the user needs to log in to the system. To do this, the
user must enter his registration data and press the "Sign In" button, as shown in Figure 19.
Figure 19 - Log in
After a successful login, the user enters the real estate registration section. This section
is available to any type of user. If the user wants to sell the apartment - he fills the main form
fields and presses the "Registration" button. This is shown in Figure 20.
After clicking the "Registry" button, the generated advertisement is published in the
Figure 20 - Registration apartment page
If the user wants to buy an apartment, he chooses the page "Search for objects". In this
section, he performs an independent search for real estate by specified filters. A user can
search for an apartment using one or more filters. It is possible to search for an apartment by
any numeric or text value. Fields "floor", "area" and "price" have the ability to set the range.
When using this range - the list of found apartments will be larger.
It will be necessary to find the added ad. To do this, it is necessary to enter three values: “ID Area”, “Material Construction”, and set the price range. After filling in the required fields - the user should tick the box on the right and click the "Search" button, as
Figure 21 - Search an apartments
If at least one apartment answers the given conditions, it will appear in the search
results, as shown in Figure 22.
The results are displayed in a tabular form. After selecting the desired Ad - opens a
detailed description.
We can see the following information about the ad: location of the object on the map;
application form, which includes a detailed description of the advertisement. The user fills in
the fields of this form, indicating contact information for feedback, as well as a comment to
the advertisement. Having filled all fields, the user presses the button "Send Admin". The