Association of
CAPN1
and
CAST
gene polymorphisms with meat tenderness
in
Bos taurus
beef cattle from Argentina
Pablo Corva
1, Liliana Soria
2, Alejandro Schor
3, Edgardo Villarreal
4, Macarena Pérez Cenci
1,
Mariana Motter
2, Carlos Mezzadra
4, Lilia Melucci
1, Cristina Miquel
2, Enrique Paván
4,
Gustavo Depetris
4, Francisco Santini
4and Juan Grigera Naón
31
Departamento de Producción Animal, Facultad de Ciencias Agrarias,
Universidad Nacional de Mar del Plata, Balcarce, Argentina.
2
Área de Genética, Facultad de Ciencias Veterinarias, Universidad de Buenos Aires, Buenos Aires,
Argentina.
3
Laboratorio de Carnes, Facultad de Agronomía, Universidad de Buenos Aires, Buenos Aires, Argentina.
4Instituto Nacional de Tecnología Agropecuaria, Balcarce, Argentina.
Abstract
The activity of the calpains/calpastatin proteolytic system is closely related to the postmortem tenderization of meat. We investigated the association between beef tenderness and single nucleotide polymorphism (SNP) markers on theCAPN1 gene (SNP316, alleles C/G; SNP530 alleles A/G) and the CAST gene 3’ untranslated region (SNP2870, alleles A/G). We sampled nine slaughter groups comprising 313 steers which had been reared in beef production systems in Argentina between 2002 and 2004 from crosses between Angus, Hereford and Limousin cattle. Minor al-lele frequencies for the markers were 0.27 to 0.46 (C), 0.02 to 0.18 (A), and 0.24 to 0.53 (A), respectively. The pres-ence ofCAPN1 markers had significant effects on meat shear force but no detectable effects were demonstrated for theCAST marker. The shear force of meat from steers with the SNP316 CC genotype was 11% lower than for the SNP316 CG genotype and 17% lower than for the SNP316 GG genotype. There were very few steers with the SNP530 AA genotype and, contrary to previous studies, meat from steers with the SNP530 GG genotype showed an 11.5% higher shear force than that from steers with the SNP530 GA genotype. Final body weight, carcass weight and rib eye area were not affected by any of the markers. These results support the concept thatCAPN1 variants are associated with tenderness across a wide range of beef production systems.
Key words:beef cattle,CAPN1,CAST, genetic markers, meat quality.
Received: December 13, 2006; Accepted: May 17, 2007.
Introduction
Several genetic markers associated with differences in beef tenderness have been reported in the last few years. These markers target two genes corresponding to the most important proteolytic system of skeletal muscle, the
cal-cium-activated neutral proteasegene (CAPN1) encoding the large subunit of µ-calpain and the calpastatin gene (CAST) encoding a specific inhibitor of the calpains (Page
et al., 2002; Whiteet al., 2005; Schenkelet al., 2006). Ge-netic marker technology is a promising tool for geGe-netic improvement in livestock. However, single genes are not free from potential interactions with environmental
fac-tors that could modulate their effect on a given trait of eco-nomic importance, as happens when breeds and even indi-vidual animals within breeds are compared. For this rea-son, new markers should be validated in each production system before widespread use by the industry. This is es-pecially important in the case of beef quality traits, be-cause the properties of beef are strongly affected by non-genetic factors such as animal nutrition, slaughter age and weight, animal handling and carcass manipulation, among others.
The beef industry in Argentina has some unique fea-tures that clearly distinguish it from other countries. Con-sumers have a strong preference for beef cuts from low-weight, young animals, because they associate these char-acteristics with a higher probability of the beef being more tender. As a consequence, the local market discriminates against the heaviest categories of finished steers. Also, car-www.sbg.org.br
Send correspondence to Pablo M. Corva. Departamento de Pro-ducción Animal, Facultad de Ciencias Agrarias, Universidad Nacio-nal de Mar del Plata, CC 276, 7620 Balcarce, Argentina. E-mail: [email protected].
casses are sold soon after slaughter so there is little time left for beef aging, a process that favors beef tenderization.
Most studies reporting significant effects of either
CAPN1orCASTalleles on beef tenderness have been based on the evaluation of aged beef from typical feedlot steers, with the exception of results from New Zealand reported by Morriset al.(2006). Both the animal category and the man-agement of beef after slaughter described in most of these studies are not common to the beef industry in Argentina. Therefore, the objective of this work was to confirm the as-sociation of markers in theCAPN1andCASTgenes with beef tenderness, in cattle from typical beef production sys-tems of Argentina. A secondary objective was to produce an appraisal of allele frequencies in a local population.
Materials and Methods
Animal resources and phenotypic information
In this study we used a cattle population that has been involved in various studies to evaluate supplementation strategies and/or crossbreeding systems at the Experimen-tal Station of the National Institute of Agricultural Technol-ogy (Instituto Nacional de Tecnología Agropecuaria (INTA), Balcarce, Argentina). All the animals received a grass-based diet that was combined with different supple-ments (grains, hays and silages) to modify growth rate and length of the fattening period. We sampled nine slaughter groups containing a total of 313 steers which were 15 to 18 months old and had been reared between 2002 and 2004 (Table 1). The decision to sample this experimental popula-tion instead of other commercial cattle populapopula-tions was based on the availability of reliable phenotypic information in terms of management and the genetic background of the animals. The steers belonged to different genetic groups and included purebred Bos taurus Angus and Hereford steers from the experimental herds maintained at the Bal-carce Station, with other steers coming from a rotational crossbreeding scheme involving the same breeds. Females from the original crossbred population were split in two
groups that were recurrently mated to either Angus or Hereford sires. At the time this study was conducted, the proportion of either Angus or Hereford genes in each group was 80% or above. There were also F1
Angus-Hereford/Hereford Angus crossbreds and reciprocal back-crosses and a group of steers produced by mating Limousin (B. taurus) sires to Angus-Hereford crossbred cows (LX). All the animals came from the herds maintained at INTA with the exception of Limousin sires, which were bought at private ranches. In order to allow an approximate estima-tion of allele frequencies, the steers were grouped in the fol-lowing way: steers that were at least 75% Angus (AX), steers that were at least 75% Hereford (HX), Angus-Hereford (AH) steers and Limousin (LX) crossbred steers. The genetic structure of the sample is detailed in Table 1.
Each contemporary group was slaughtered at a pri-vate abattoir when at least 50% of the steers in a given group had a backfat thickness (BFT) of 5 mm between the 12 and 13thribs, estimated by ultrasound measurements. Fi-nal live body weight (BW) and rib eye area (REA, esti-mated by ultrasound) were recorded before slaughter. At the time of slaughter, mean live weight was 332±33 kg and backfat thickness was 5.2 ± 1.5 mm as averaged across slaughter groups. Carcasses were weighed and the hot car-cass weight (HCW) recorded and then placed in a chiller for 24 h at 5 °C without previous electrical stimulation, after which a block of steaks corresponding to the 11, 12 and 13th ribs was removed from each cold carcass and kept at -20 °C until they were thawed for study. Analytical determinations were performed at the University of Buenos Aires Meat Laboratory. Beef tenderness was estimated indirectly as Warner-Bratzler shear force (WBSF) measured on samples taken from the Longissimus lumborum muscle. Steaks (2.5cm-thick) were thawed overnight at room temperature for 24 h and external fat, peripheral connective tissue and other muscles were removed from each steak and samples placed in plastic bags which were then immersed in a water bath at 70 °C for 50 min. The cooked steaks were cooled under running tap water for 40 min, the bags drained and
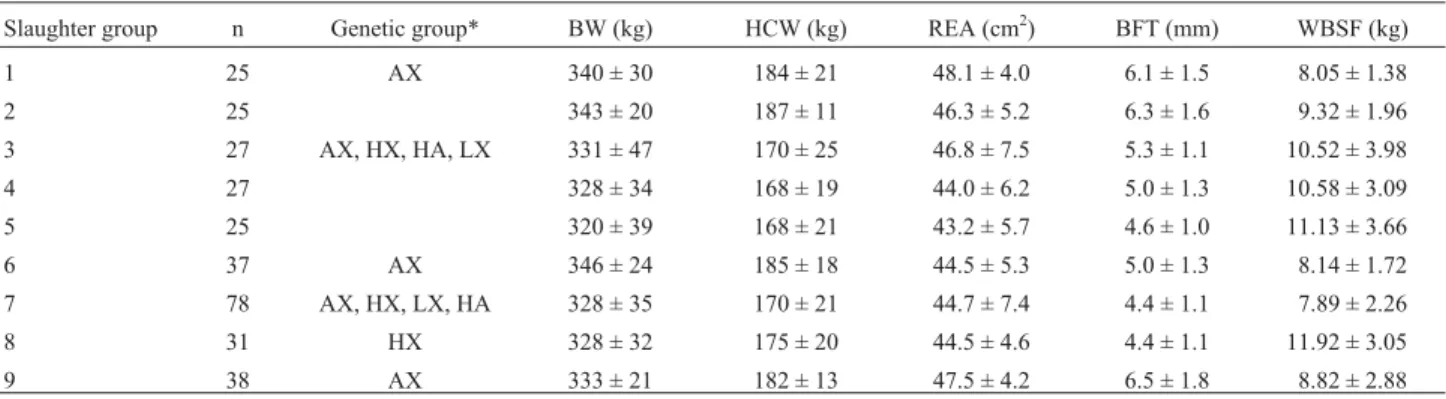
Table 1- Slaughter groups, showing number of steers (n), final body weight (BW), hot carcass weight (HCW), rib eye area (REA), backfat thickness
(BFT) and Warner-Bratzler Shear Force (WBSF) for each genetic group (AX, HX, HA, LX). Values represent mean ± standard deviation (SD).
Slaughter group n Genetic group* BW (kg) HCW (kg) REA (cm2) BFT (mm) WBSF (kg)
1 25 AX 340 ± 30 184 ± 21 48.1 ± 4.0 6.1 ± 1.5 8.05 ± 1.38
2 25 343 ± 20 187 ± 11 46.3 ± 5.2 6.3 ± 1.6 9.32 ± 1.96
3 27 AX, HX, HA, LX 331 ± 47 170 ± 25 46.8 ± 7.5 5.3 ± 1.1 10.52 ± 3.98
4 27 328 ± 34 168 ± 19 44.0 ± 6.2 5.0 ± 1.3 10.58 ± 3.09
5 25 320 ± 39 168 ± 21 43.2 ± 5.7 4.6 ± 1.0 11.13 ± 3.66
6 37 AX 346 ± 24 185 ± 18 44.5 ± 5.3 5.0 ± 1.3 8.14 ± 1.72
7 78 AX, HX, LX, HA 328 ± 35 170 ± 21 44.7 ± 7.4 4.4 ± 1.1 7.89 ± 2.26
8 31 HX 328 ± 32 175 ± 20 44.5 ± 4.6 4.4 ± 1.1 11.92 ± 3.05
9 38 AX 333 ± 21 182 ± 13 47.5 ± 4.2 6.5 ± 1.8 8.82 ± 2.88
the cuts gently blotted dry with a paper towel. Five 2.5 cm-diameter cores were removed from each steak par-allel to the muscle fibers and sheared at their mid-point us-ing a 50 kg compression load cell and a Warner-Bratzler V-notch blade mounted on an Instron model 4442 testing machine (Canton, MA, USA) at a crosshead speed of 50 mm min-1. A single peak-shear force measurement was obtained for each core and these results were averaged to obtain a single WBSF value for each sample.
Markers and genotyping
For each sample, DNA was isolated from a 160-mg sample removed from the frozen steaks following the stan-dard procedures of Maniatiset al.(1982), except for the use of a modified cell lysis buffer (50 mM Tris-HCl, 25 mM EDTA pH 7.5, N-Laurylsarcosine 2% (w/v), 0.05 M DL-dithiothreitol). After phenol/chloroform extraction and eth-anol precipitation DNA was resuspended in 10 mM Tris HCl.
We used two previously described markers on the
CAPN1gene (Pageet al., 2002) which had been named ac-cording to the position of the amino acid substitutions pro-duced by each single nucleotide polymorphism (SNP) as SNP316 (alleles C/G) onCAPN1exon 9 and SNP530 (al-leles A/G) onCAPN1exon 14. Previous research (Pageet
al., 2002) has shown that alleles C and G have a more favor-able effect on beef tenderness over the alternative G and A alleles.
The polymerase chain reaction restriction fragment length polymorphism (PCR-RFLP) method was designed to distinguish SNP alleles both on theCAPN1andCAST
genes. Primers for PCR amplification were designed based on reported bovine CAPN1 sequences (GenBank AF252504 and AF248054). For SNP316 a 709 bp fragment was amplified with the primers CCAGGGCCAGATGG TGAA (forward) and CGTCGGGTGTCAGGTTGC (re-verse) and digested with theBtgI restriction enzyme, while for SNP530 a 787 bp fragment was amplified with the primers AGCGCAGGGACCCAGTGA (forward) and TC CCCTGCCAGTTGTCTGAAG (reverse) and digested with theAvaII restriction enzyme. The PCR amplification was performed in a total volume of 25 µL containing 50 pmol of each primer, 1.5 mM MgCl2, 200µM of each
dNTP (Promega Corporation, Madison, WI), 1X PCR-buffer, 2.5 units ofTaqDNA Polymerase (Invitrogen Life technologies, Brazil) and 120 ng of DNA. The following PCR program was used: 35 cycles of 45 s at 95 °C, 45 s at the annealing temperature and 45 s at 72 °C, with a first step at 95 °C for 5 min and a final extension for 5 min at 72 °C. Annealing temperatures were 62.5 °C for SNP316 and 64 °C for SNP530. After amplification, 16 ng of the PCR product of each SNP was digested with 10 units of the cor-responding restriction enzyme (New England Biolabs, Be-verly, MA) for 4 h at the temperature suggested for each enzyme by the manufacturer. The digestion product was
then electrophoresed in 1.5% agarose gels at 60V for 1 h 15 min and photographed under UV light.
A bioinformatic approach was followed to develop a new marker on the CASTgene. We downloaded 97 Ex-pressed Sequence Tags (EST) corresponding to the bovine
CASTgene from GenBank and aligned them with the CAP3 software (Huang and Madan, 1999). The resulting cluster derived from several overlapping and highly similar se-quences (contig) was searched for polymorphisms with the AutoSNiP software (Barkeret al., 2003) at the Plant Genet-ics and GenomGenet-ics web site, Victorian AgriBiosciences Centre, Australia. A conservative criterion was applied be-cause ESTs are usually low-quality sequences and there are many sequencing errors that could be wrongly considered real polymorphisms. In order to declare an SNP, both alter-native alleles should appear at least twice in the same posi-tion of the contig and this minimum frequency was increased together with the number of sequences in the contig (Barkeret al., 2003). Only three polymorphisms in the 3’ untranslated region (UTR) of the gene fulfilled this requirement, with the polymorphism considered most reli-able based on the number of ESTs with the alternative al-leles of the putative SNP being chosen for our study. This polymorphism was named SNP2870 according to its posi-tion on the EST contig. Based on the reported bovineCAST
sequence (GenBank AF159246), a 275 bp fragment en-compassing SNP2870 was amplified with the primers AAT TTTTAAAAATTGCCTTCAGTTGGGAG (forward) and AAGAAACATCAAACACAGTCCACAAGTCTA (re-verse). The PCR product was digested with theTsp509I re-striction enzyme that distinguishes the alternative alleles (A/G). The PCR-RFLP amplification, digestion and elec-trophoresis proceeded as described above, except that the annealing temperature was 62 °C.
Statistical analyses
Allele frequencies were compared by chi-square analysis. The BW, HCW, REA and WBSF data were ana-lyzed using a model that included the genetic marker and slaughter group fixed effects and the genetic marker x slaughter group interaction. For the analysis of WBSF, per-centage lipid content in meat (overall mean = 2.71±1.4%) was initially included as a covariate but it had no significant effect so it was removed from the final model. Pedigree in-formation was available for only a few of the slaughter groups so it was not included in the analyses.
Previous trials showed a slight but significant effect of the number of days that the steaks remained frozen (range: 40 to 202 days, overall mean = 113±57 days) on WBSF (-0.0145± 0.003 kg/day). Therefore, this variable was included as a covariate in the model. All statistical analyses were carried out with the SAS program version 8.1 (SAS, 1998).
Preliminary analysis with a subset of the phenotypic data showed that slaughter group was the most important source of variation in WBSF, while genetic groups made a minor contribution to differences on that trait.
Results
Genotype and allele frequencies
The allele and genotype frequencies of each marker are listed in Table 2. Because most of the animals were crossbreds, allele frequencies for each breed could not be thoroughly estimated. Allele frequencies at SNP316 were significantly different between the AX and HX groups, the former having a higher frequency of the C allele. The A al-lele at SNP530 seemed to be rare among British breeds.
For the newly discoveredCASTSNP2870, the group with a predominantly Angus background (AX) had a higher frequency of the A allele, whereas the opposite was true for the Hereford-based group (HX).
Association analyses
There was a significant effect of both the CAPN1 SNP316 and SNP530 polymorphisms on WBSF (Table 3). For SNP316, the WBSF value for the CC genotype was 10% lower than for the CG genotype and 14.6% lower than for the GG genotype. There were only four steers with the SNP530 AA genotype, so these steers were not included in the association analysis. Beef from steers with the GG ge-notype at this marker had an 11.5% higher WBSF than beef from steers with the GA genotype. Interestingly, other stud-ies conducted under different conditions (Pageet al., 2002; Whiteet al., 2005) established that G was the most favor-able allele in terms of beef tenderness. TheCASTSNP2870 polymorphism showed no significant detectable effect on WBSF. It remains to be demonstrated whether this marker has any association with tenderness in aged beef. There were no detectable effects of any marker on BW, HCW or REA. Mean values of these traits for each slaughter group are presented in Table 1.
Discussion
Despite the relevance of beef tenderness as a selection objective in cattle, virtually no selection has been practiced on this trait. In fact, the difficulties encountered in measur-ing measure beef quality traits make them suitable for marker-assisted selection strategies. Thus, the validation of marker effects becomes a crucial step towards their appli-cation in a breeding program. In this paper we report the re-sults of a validation study involving markers targeting a proteolytic system of skeletal muscle closely connected to the process of beef tenderization.
Extreme frequencies of any allele at a given locus make selection highly inefficient, independently of its ef-fect on the mean of a quantitative trait (Falconer and Mackay, 1996), so that consideration of allele frequencies is an important part of the marker validation process. The
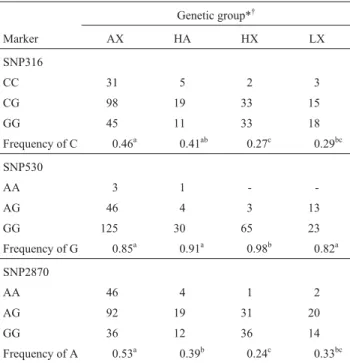
Table 2- Genotype and allele frequencies of theCAPN1gene SNP316 and SNP530 markers and theCASTgene SNP2870 marker.
Genetic group*†
Marker AX HA HX LX
SNP316
CC 31 5 2 3
CG 98 19 33 15
GG 45 11 33 18
Frequency of C 0.46a 0.41ab 0.27c 0.29bc
SNP530
AA 3 1 -
-AG 46 4 3 13
GG 125 30 65 23
Frequency of G 0.85a 0.91a 0.98b 0.82a
SNP2870
AA 46 4 1 2
AG 92 19 31 20
GG 36 12 36 14
Frequency of A 0.53a 0.39b 0.24c 0.33bc
*AX:≥75% Angus -≤25% Hereford; AH: 50% Angus - 50% Hereford; HX:≥75% Hereford -≤25% Angus; LX: Limousin x Hereford-Angus. †
In the same row, allele frequencies with different letters are significantly different (chi-square test, p < 0.05).
Table 3- Mean Warner-Bratzler Shear Force (WBSF) values and standard error (SE) of the mean for genotypic classes based on individual
poly-morphisms on theCAPN1andCASTgenes. Genotype AA at the SNP530 locus was not included in the analysis due to the low number of animals in this class.
CAPN1gene CASTgene
SNP316 marker SNP5302marker SNP2870 marker
Genotype n WBSF ± SE (kg)* Genotype n WBSF ± SE (kg)* Genotype n WBSF ± SE (kg)*
CC 41 7.86 ± 0.65a - - - AA 53 9.11 ± 0.75a
CG 165 8.73 ± 0.51ab AG 66 7.98 ± 0.62a AG 162 8.91 ± 0.53a
GG 107 9.21 ± 0.54b GG 243 8.90 ± 0.47b GG 98 8.68 ± 0.56a
*
broad pattern of allele frequencies across genetic groups (Table 2) forCAPN1markers is consistent with other re-sults from research herds (Pageet al., 2004). In our study Angus steers showed a higher frequency of the CAPN1 SNP316 C allele than Hereford steers, similar to that re-ported by Pageet al.(2004) and Morriset al.(2006). While theCAPN1SNP530 A allele seemed to be very uncommon among British breeds it tended to have a higher frequency in the continental breeds as suggested by the results for LX crosses, these results being in agreement with those of (Pageet al., 2004). Our new SNP2870 marker for theCAST gene showed an allele frequency pattern resembling that of SNP316, with the allele that predominated in the Here-ford-based groups being at a lower frequency in the An-gus-based group (Table 2).
With the exception of Limousin sires, all the animals that contributed to the genetic background of the popula-tion studied belonged to INTA experimental herds and rep-resent two distinct genetic pools. Both the Angus and Hereford herds have been kept closed since their creation in the late 1960s. The Hereford herd has been under selection since 1986 with the objective of increasing preweaning growth rate while keeping birth weight constant (Melucci and Mezzadra, 2003), but no selection has ever been prac-ticed in the Angus herd. It is worth noting that both Angus and Hereford cattle from these herds are smaller than cattle from registered herds. Special attention was paid when ani-mals were chosen to create both herds, in order to resemble the genetic background of commercial herds at that time. However, most commercial herds have undergone changes that have probably altered allele frequencies for some genes. Unfortunately, there is no information available about the genetic trends for this particular set of mutations. A comprehensive validation program conducted by the Na-tional Beef Cattle Evaluation Consortium in the United States provides information about frequencies for the most popular markers for beef tenderness currently in the mar-ket. For SNP316, the frequency of the G allele was above 0.76 for all the sampled breeds and crosses of B. taurus breeds. This value is close to those reported by Pageet al. (2004) for most crosses and consistent with results reported here for HX but not AX. It would be interesting to confirm whether these differences are due to genetic trends or sam-pling effects and genetic drift.
The WBSF values from the present study (Table 1) were higher than many others reported in the literature (Shackelfordet al., 1999; Kinget al., 2003). Both the lack of an aging period and the cooking method could have con-tributed to obtaining such high values. It has been demon-strated that chilling and cooking rates and the interaction between these factors can have dramatic effects on beef tenderness (King et al., 2003). Moreover, the highest WBSF values are usually obtained 24 h postmortem, and coincidentally that was the sampling point chosen in the present study. Also, slight differences between
experimen-tal protocols for WBSF determination may exist among laboratories. Although our WBSF values cannot be com-pared to those reported elsewhere, it was considered that relative comparisons between genetic classes within the same study were still valid.
In the present study the toughest meat seemed to be as-sociated with G alleles at both SNP316 and SNP530 (Table 3). Previous research suggested that GA would be the two-marker haplotype (SNP316/SNP530) with the highest WBSF values (Pageet al., 2002; Whiteet al., 2005). A new SNP (alleles C/T) on intron 17 ofCAPN1has been recently described (Pageet al., 2002; Whiteet al., 2005) and the C al-lele at this locus is expected to be more favorable to tender-ness. Extending the genotyping to include the new SNP in future studies together with the definition of haplotypes, could allow for better classification of carcasses in terms of their WBSF. No formal proof of causality has been presented for any of the described polymorphisms on CAPN1. The strength of their statistical association with tenderness de-pends on the degree of linkage with a putative polymorphism affecting calpain activity, yet to be discovered. The present knowledge suggests that the C allele at SNP316 has the strongest linkage disequilibrium with the putative tenderness allele. Therefore, a good definition of haplotypes could help in the identification of gametes carrying the favorable allele of the actual polymorphism affecting beef tenderness.
The SNP2887 on theCASTgene corresponds to base 2870 in the GenBank sequence AF159246 and another pre-viously described SNP in theCAST3’ UTR is in position 2959 of the same sequence (Barendse, 2002), a difference of only 89 bp. However, at least three haplotypes exist ac-cording to the EST contig (AG, AA and GA), suggesting that linkage disequilibrium is not complete. The 3’ UTR has gained attention due to its importance in regulation of gene function (Hughes, 2006), with many regulatory motifs being only 8 bp long (Xieet al., 2005). Also, the most fa-vorable allele of the marker described by Barendse (2002) seems to be at high frequency in taurine populations (Casas
different sources confirmed to be an inexpensive yet pow-erful method to detect variability at the gene level among cattle populations.
Although care was taken to follow the same protocol during slaughter and sampling of the carcasses across the entire study, the most important source of variation on WBSF was always the slaughter group. Similar results have been observed in other studies (Schenkelet al., 2006). In our study, the slaughter group effect cannot be explained by the genetic background alone, stressing the relevance of en-vironmental effects on beef quality traits, especially the management of animals before slaughter and handling and the storage of carcasses. Additional care is needed in future studies to detect and control as many sources of variation as possible in order to conduct these types of genetic evalua-tions more precisely.
If the allele frequencies estimated in our study were representative of those in the commercial population, it would be advisable to select cattle favoring the SNP316 C allele. The SNP530 A allele was present at very low fre-quencies and was usually found on GA haplotypes, while the CA haplotype seems to be rare in British breeds (Pageet
al., 2004; Whiteet al., 2005). Thus a SNP316 C allele will be most likely tagging the CG haplotype and genotyping of SNP530 would add little information at least in Angus, Hereford and crosses between these breeds.
In summary, our results showed that there is a detect-able effect ofCAPN1markers on tenderness, even in beef that has not been aged. However, theCASTmarker showed no detectable effect on tenderness under the conditions tested. None of the markers tested showed any effects on live weight, carcass weight or rib eye area. Therefore, selection favoring beef tenderness would not produce any undesired correlated responses. The results are promising and warrant further research to apply this technology to the beef industry.
Acknowledgments
This research was supported by grants from the Uni-versity of Mar del Plata, UniUni-versity of Buenos Aires, Na-tional Agency of Science and Technology (ANPCyT) and INTA, Argentina.
References
Barendse W (2002) DNA markers for meat tenderness. Interna-tional Patent Application No PCT/AU02/00122. World Intel-lectual Property Org. Int. Publication No WO 02/064820 A1. Barker G, Batley J, O’Sullivan H, Edwards K and Edwards D
(2003) Redundancy based detection of sequence polymor-phisms in expressed sequence tag data using AutoSNP. Bioinformatics 19:421-422.
Casas E, White SN, Wheeler TL, Shackelford SD, Koohmaraie M, Riley DG, Chase Jr CC, Johnson DD and Smith TPL (2006) Effects of calpastatin andµ-calpain markers in beef cattle on tenderness traits. J Anim Sci 84:520-525.
Falconer, DS and Mackay TFC. (1996) Introduction to Quantita-tive Genetics. 4thedition. Longman, Essex, 464 pp. Huang X and Madan A (1999) CAP3: A DNA sequence assembly
program. Genome Res 9:868-877.
Hughes T (2006) Regulation of gene expression by alternative un-translated regions. Trends Genet 22:119-122.
King DA, Dikeman ME, Wheeler TL, Kastner CL and Kooh-maraie M (2003) Chilling and cooking rate effects on some myofibrillar determinants of tenderness of beef. J Anim Sci 81:1473-1481.
Maniatis T, Fritsch EF and Sambrook J (1982) Molecular Clon-ing: A Laboratory Manual. Cold Spring Harbor Laboratory, New York.
Melucci LM and Mezzadra CA (2003) Direct and maternal ge-netic parameters for growth traits in a Hereford cattle popu-lation. J Basic Appl Genet 15:63-72.
Morris CA, Cullen NG, Hickey SM, Dobbie PM, Veenvliet BA, Manley TR, Pitchford WS, Kruk ZA, Bottema CDK and Wilson T (2006) Genotypic effects of calpain 1 and calpastatin on the tenderness of cooked M. longissimus dorsi steaks from Jersey x Limousin, Angus and Here-ford-cross cattle. Anim Genet 37:411-414.
Page BT, Casas E, Heaton MP, Cullen NG, Hyndman DL, Morris CA, Crawford AM, Wheeler TL, Koohmaraie M, Keele JW, et al.(2002) Evaluation of single-nucleotide polymorphisms in CAPN1 for association with meat tenderness in cattle. J Anim Sci 80:3077-3085.
Page BT, Casas E, Quaas RL, Thallman RM, Wheeler TL, Shac-kelford SD, Koohmaraie M, White SN, Bennett GL, Keele JW, et al. (2004) Association of markers in the bovine CAPN1 gene with meat tenderness in large crossbred popu-lations that sample influential industry sires. J Anim Sci 82:3474-3481.
SAS (1998) OnlineDoc (TM). SAS Institute Inc., Cary. Available at http://v8doc.sas.com/sashtml/.
Schenkel FS, Miller SP, Jiang Z, Mandell IB, Ye X, Li H and Wil-ton JW (2006) Association of a single nucleotide polymor-phism in the calpastatin gene with carcass and meat quality traits of beef cattle. J Anim Sci 84:291-299.
Shackelford SD, Wheeler TL and Koohmaraie M (1999) Evalua-tion of slice shear force as an objective method of assessing beef longissimus tenderness. J Anim Sci 77:2693-2699. White SN, Casas E, Wheeler TL, Shackelford SD, Koohmaraie
M, Riley DG, Chase Jr CC, Johnson DD, Keele JW and Smith TPL (2005) A new single nucleotide polymorphism in CAPN1 extends the current tenderness marker test to in-clude cattle ofBos indicus,Bos taurus, and crossbred de-scent. J Anim Sci 83:2001-2008.
Xie X, Lu J, Kulbokas EJ, Golub TR, Mootha V, Lindblad-Toh K, Lander ES and Kellis M (2005) Systematic discovery of reg-ulatory motifs in human promoters and 3’ UTRs by compar-ison of several mammals. Nature 434:338-345.
Internet Resources
Plant Genetics and Genomics, Victorian AgriBiosciences Centre, Australia, http://hornbill.cspp.latrobe.edu.au/.
National Beef Cattle Evaluation Consortium, USA, http://www. nbcec.org/nbcec/index.html (September 2006).