Mapping QTLs for drought tolerance in a SEA 5 x AND 277 common bean
cross with SSRs and SNP markers
Boris Briñez
1, Juliana Morini Küpper Cardoso Perseguini
1,2, Juliana Santa Rosa
1, Denis Bassi
1, João
Guilherme Ribeiro Gonçalves
3, Caléo Almeida
1, Jean Fausto de Carvalho Paulino
4, Matthew Ward Blair
5,
Alisson Fernando Chioratto
3, Sérgio Augusto Morais Carbonell
3, Paula Arielle Mendes Ribeiro Valdisser
5,
Rosana Pereira Vianello
6and Luciana Lasry Benchimol-Reis
11
Centro de Recursos Genéticos Vegetais, Instituto Agronômico (IAC), Campinas, SP, Brazil.
2Ciências Biológicas, Universidade Tecnológica Federal do Paraná (UTFPR), Dois Vizinhos, PR, Brazil.
3Centro de Grãos e Fibras, Instituto Agronômico (IAC), Campinas, SP, Brazil.
4
Departamento de Agronomia, Universidade Estadual de Maringá (UEM), Maringá, PR, Brazil.
5Department of Agriculture and Natural Sciences, Tennessee State University, Nashville, TN, USA.
6Bean Program, Centro Nacional de Pesquisas Arroz e Feijão, Goiânia, GO, Brazil.
Abstract
The common bean is characterized by high sensitivity to drought and low productivity. Breeding for drought resis-tance in this species involves genes of different genetic groups. In this work, we used a SEA 5 x AND 277 cross to map quantitative trait loci associated with drought tolerance in order to assess the factors that determine the magni-tude of drought response in common beans. A total of 438 polymorphic markers were used to genotype the F8 map-ping population. Phenotymap-ping was done in two greenhouses, one used to simulate drought and the other to simulate irrigated conditions. Fourteen traits associated with drought tolerance were measured to identify the quantitative trait loci (QTLs). The map was constructed with 331 markers that covered all 11 chromosomes and had a total length of 1515 cM. Twenty-two QTLs were discovered for chlorophyll, leaf and stem fresh biomass, leaf biomass dry weight, leaf temperature, number of pods per plant, number of seeds per plant, seed weight, days to flowering, dry pod weight and total yield under well-watered and drought (stress) conditions. All the QTLs detected under drought con-ditions showed positive effects of the SEA 5 allele. This study provides a better understanding of the genetic inheri-tance of drought tolerance in common bean.
Keywords: abiotic stress, interpopulation gene-pool, molecular markers, QTL mapping, water deficit. Received: August 18, 2016; Accepted: April 3, 2017.
Introduction
The common bean (Phaseolus vulgarisL.) is an
an-nual grain legume crop with important human consumption worldwide (Broughtonet al., 2003). Drought stress is a
se-rious agronomic problem that contributes to severe yield losses worldwide (Sabadinet al., 2012) and affects 60% of
bean production, especially in Africa where this effect is particularly severe (Asfaw et al., 2013). Important bean
producing areas that already suffer frequent droughts, such as Mexico, Central America, southern Africa and north-eastern Brazil, are likely to receive even less average rain-fall in the future because of climate change (Beebeet al.,
2011).
A broad understanding of the physiology of drought response is key to identifying useful selection criteria in ad-dition to yieldper se. The optimal plant response for
deal-ing with moisture deficit will vary dependdeal-ing upon the pattern of drought (Cortéset al., 2013). Four patterns of
drought have been defined: late initiation of rains, early cessation of rains or terminal drought, intermittent drought, or low rainfall throughout the season (Levitt, 1972).
Common beans of the Durango race germplasm (prostrate bush types with medium-sized seeds from the dry northern highlands of Mexico) reportedly possess the high-est levels of drought resistance and have been used to de-velop drought resistant bean cultivars in the Middle American gene pool (Singhet al., 2001; Singh, 2007).
Ac-cording to Mukeshimana et al. (2014), combining the
germplasm of the races Durango and Mesoamerica (small-seeded types, mostly bush habits, from lowland Central America and Mexico; Singhet al., 1991) has provided a
Genetics and Molecular Biology, 40, 4, 813-823 (2017)
Copyright © 2017, Sociedade Brasileira de Genética. Printed in Brazil DOI: http://dx.doi.org/10.1590/1678-4685-GMB-2016-0222
Send correspondence to Juliana Morini Küpper Cardoso Perse-guini. Ciências Biológicas, Universidade Tecnológica Federal do Paraná (UTFPR), 85660-000, PR, Dois Vizinhos, Brazil. E-mail: [email protected]
consistent source of improved drought resistance for tropi-cal environments. Singhet al.(2001) described the SEA 5
line as a drought tolerant cultivar derived from interracial crosses between the Mesoamerican and Durango races; one of the parents originating the SEA 5 line was the cultivar BAT 477.
Genetic and physiological mechanisms related to the responses of plants to water stress are important for the se-lection of more drought-tolerant plants. In general, drought resistance mechanisms include drought escape, drought avoidance and drought tolerance (Levitt, 1972). Drought escape allows plants to accelerate their cell cycle with early flowering and maturity, and rapidly relocates metabolites to seed production and away from leaves and shoots. Drought avoidance is the ability to maintain high tissue wa-ter potential through increased root depth, a reduction in hydraulic conductance, radiation absorption reduction in leaves, a reduction in water-loss area, reduced absorption of radiation by leaf movement, and reduced evaporation surface (leaf area). Drought tolerance is the ability of plants to resist the stress by adjusting cell osmosis, plasticity and size (Levitt, 1972).
Many traits influence tolerance to drought stress, in-cluding rooting pattern, the ability to partition a greater pro-portion of carbohydrates to seeds under stress, the capacity to set pods and fill seeds under stress, reduced stomatal con-ductance and leaf area, and the ability to maintain turgor through osmotic adjustment (Singh, 2007).
Breeding for drought tolerance is complex because of the number of traits involved, quantitative inheritance and environmental influence (Miret al., 2012). A large amount
of data has contributed to our understanding of the impact of drought on the common bean (Asfaw and Blair, 2012; Blairet al., 2012; Mukeshimanaet al., 2014). However, the
identification of major-effect QTLs with stable expression across different stress environments is needed to facilitate marker assisted selection (MAS) for drought tolerance in the common bean.
Molecular markers are powerful tools for analyzing the genetic control of complex traits such as drought toler-ance (Miret al., 2012). Asfaw and Blair (2012) used
ran-dom amplified polymorphic DNA, amplified fragment length polymorphism and simple sequence repeats markers (SSRs) to map a Mesoamerican intra-gene pool cross of drought-susceptible DOR364 and drought-tolerant BAT 477, and detected a yield QTL on Pv08 and a stem carbohy-drate QTL on Pv05.
Diversity analysis using intron-based SNPs revealed different patterns of diversity compared to that reported by Blair et al. (2009a,b) using SSRs. Mukeshimana et al.
(2014) identified 14 QTLs for performance under drought in an inter-gene pool recombinant inbred line (RIL) popula-tion from a cross of the drought-tolerant line SEA 5 and CAL 96 cultivar; QTLs associated with yield components overlapped, especially on Pv03, Pv07, and Pv09.
Villordo-Pineda et al. (2016) observed 83 SNPs that were
significantly associated with flowering time, physiological maturity, reproductive period, seed and total biomass, reuse index, seed yield, weight of 100 seeds, and harvest index in three cultivation cycles.
The goal of this study was to identify QTLs associ-ated with physiological and yield components under drought and irrigation conditions based on an anchored linkage map obtained from a RIL population derived from a contrasting inter-gene pool cross between drought-tolerant (SEA 5 – Mesoamerican gene pool) and drought-suscep-tible (AND 277 – Andean gene pool) parents.
Material and Methods
Plant material
The population used in this study was a set of 107 re-combinant inbred lines (RILs) from the cross SEA 5 x AND 277 created at the International Center for Tropical Agri-culture (CIAT, Cali, Colombia). The population was propa-gated until the F8generation using the single seed descent
(SSD) method. The drought-tolerant dry bean line SEA 5 was also developed at CIAT (Singhet al., 2001; Terán and
Singh, 2002) and is considered superior to BAT 477 (Pérez-Vegaet al., 2011). SEA 5 was developed from the
interracial double-cross population TR 7790 = BAT 477/‘San Cristobal 83’//‘Guanajuato 31’/‘Rio Tibagi’. BAT 477 is a cream-colored, small-seeded (< 25 g/100 seeds) breeding line developed at CIAT; BAT 477 has an indeterminate prostrate Type III growth habit and is highly tolerant to charcoal root rot [caused byMacrophomina phaseolina(Tassi) Goid]. San Cristobal 83 is a red mottled,
small-seeded landrace with a Type III growth habit from the Dominican Republic. Guanajuato 31 is a beige-colored, medium-seeded (25-40 g/100 seeds) landrace of Type III growth habit from the semi-arid central highlands of Mex-ico. This line has high yields, a high harvest index and is re-sistant to anthracnose [caused by Colletotrichum lindemuthianum (Sacc. & Magn.) Lams.-Scrib.]. Crosses
involving Guanajuato 31 indicate that it possesses resis-tance genes toC. lindemuthianumraces 6, 31, 38, 39 and
357 (Rodríguez-Soárezet al., 2007) and to race 83
(Alza-te-Marinet al., 2009). Rio Tibagi has small black seeds and
an indeterminate upright Type II growth habit; this is a pop-ular cultivar in central and southern Brazil. BAT 477, San Cristobal 83 and Rio Tibagi belong to the Mesoamerica race, and Guanajuato 31 belongs to the Durango race. All four genotypes have some level of tolerance to drought, al-though Rio Tibagi has been classified as susceptible (Singh, 1995). AND 277 belongs to the Nueva Granada race and is of the Andean genepool (Blairet al., 2009a).
2003) andPhg-1(Carvalhoet al., 1998) genes that confer
resistance to anthracnose (Colletotrichum lindemuthianum) and angular leaf spot (Pseudocercospora
griseola) diseases, respectively, but is susceptible to
drought.
Phenotyping for drought tolerance
The experiment was done from January to April 2012 at the Agronomic Institute (IAC, Campinas, SP, Brazil), lo-cated at 22°52’40” latitude south and 47°04’72” longitude west and an altitude of 685 m. Two greenhouses were set up for the experiment. The first one (water stress) was covered with shade cloth as a sun screen and polyethylene plastic to prevent the entry of water during the experiment, while the second one (well water) was covered only with shade cloth.
Each greenhouse was filled with 428 plastic pots linked to an individual irrigation system that allowed con-trol of the amount of incoming water and the drought stress generated in the experiment. The pots were filled with 12 kg of a soil, manure and sand mixture (in a 3:1:1 ratio). Since pot size can affect plant growth and performance (Pieruschka and Poorter, 2012),we used pots with a soil
ca-pacity of 12 kg to minimize the influence of pot size. The soil was adjusted to a neutral pH with lime and watered be-fore filling the pots. The experimental design consisted of completely randomized blocks with four replicates. After one week of letting the soil settle, the pots were fertilized using chemically-formulated fertilizer (NPK 8-18-16) that was applied directly to the soil. The total amount of each nutrient was equivalent to 1.5 g of N, 6.0 g of P2O5and 3.5
g of K2O per pot.
Soil moisture levels in the pots were measured with 30 watermark sensors (granular matrix sensors) that were randomly installed at soil depths of 20 cm in control and drought stress pots. Before planting, the seeds were rinsed for 1 min in 5% (v/v) NaClO, washed in distilled water and germinated in a Biological Oxygen Demand (BOD) incubator for 72 h at 25 °C. Three seeds of each genotype were planted per pot. During the growing season, irriga-tions were provided twice a day for a total volume of 400 mL. Every two days, soil water tension was measured, along with the leaf temperature of the plants in the pots con-taining the sensors, as well as the ambient temperature and relative humidity of each environment. Days to flowering were recorded every day and the mean flowering date was calculated for each genotype.
After 20 days of water deficit, one plant of each geno-type and each replication was collected for phenotypic analysis; the others were allowed to grow until the end of the crop cycle to measure yield. At this point, leaf tempera-ture was measured with an infrared thermograph (Telatemp model AG-42D, Telatemp, CA, USA), after which the plants were cut at the soil surface and separated into leaves and stems. The chlorophyll present in the leaves was mea-sured with a non-destructive, hand-held SPAD-502
chloro-phyll meter (Minolta Camera Co., Ltd., Japan). Leaf area was determined using a leaf area meter (LICOR model LI-3000). For these same plants, the fresh stem and leaf weights were measured using an analytical balance (BEL Engineering, Milan, Italy) to determine biomass partition-ing. Plant parts were placed in separate paper bags and dried in an oven at 60 °C for 48 h after which the stem and leaf biomass dry weights were determined.
The physiological and morphological responses to drought were measured 33 days after planting (DAP), when the water-stressed greenhouse plants reached a mean value of 160 kPa of soil water potential. After the physiological and morphological evaluations, the remaining plants were evaluated at physiological maturity to determine their pro-ductivity. In general, the plants were harvested after ap-proximately three months, at which point the number of pods at harvest, number of seeds per plant and number of seeds per pod were determined. In addition, yield and total seed weight and dry pod weight were estimated. The drought intensity index (DII) was calculated as 1-Xds
Xns,
where Xds and Xns are the mean seed yield of all genotypes under drought stress (ds) and no stress (ns) treatments.
DNA extraction and genotyping
DNA was extracted from 300 mg of powdered lyophilized young leaves from the parents and all the RILs by the CTAB method. DNA concentration was measured in a NanoDrop 2000 (Thermo Scientific) and diluted in Tris-EDTA (TE) buffer (10 mM Tris-HCl, 1 mM Tris-EDTA, pH 8.0) to a final concentration of 50 ng/mL and stored at 4 °C.
Microsatellite amplification and analysis
For microsatellite screening, 594 SSRs were tested for polymorphisms among the SEA 5 and AND 277 lines. These SSRs were previously published by Blair et al.
(2006, 2008, 2009a), Benchimolet al.(2007), Hanaiet al.
(2007) and Camposet al.(2011). The amplification reac-tions included 30 ng of DNA, 1 U ofTaqDNA polymerase, 1.5 mM MgCl2, 0.15 mM of each dNTP, 0.8 pmol/mL of
each primer (forward and reverse), 10 mM Tris-HCl and 50 mM KCl in a final reaction volume of 15mL. The
fol-lowing conditions were used for amplification: 1 min at 94 °C, 30 cycles of 1 min at 94 °C, 1 min at the specific anneal-ing temperature for each SSR, and 1 min at 72 °C, with a fi-nal extension of 5 min at 72 °C. The PCR products were visualized on a 3% agarose gel and stained with 1X GelRed (Biotium, Inc. Hayward, CA, USA). After checking the PCR amplification products, they were separated in a 6% denaturing polyacrylamide gel and visualized using silver staining. Molecular mass standards (10-bp and 100-bp lad-ders; Invitrogen) were included in the runs.
Single nucleotide polymorphism (SNP) analysis Genotyping for the 384 SNPs was done using the Vera Code® BeadXpress platform (Illumina) at the
technology Laboratory of Embrapa Arroz e Feijão (Goia-nia, GO, Brazil). A set of 384 SNP markers, validated through Prelim file (https://icom.illumina.com/Cus-tom/UploadOpaPrelim/) previously identified for P. vulgaris(Mülleret al., 2015) and derivatives of
polymor-phism between the lines BAT 477 of Mesoamerican origin and Jalo EEP558 of Andean origin were selected to com-pose the Oligo Pool Assay (OPA) SNP markers.
For the SNP detection procedure on the BeadXpress platform, three oligonucleotides were used, two allele-specific (ASO) primers for each of the variations of the same specific SNP locus and a third primer (LSO) binding to the 3’ region fragment DNA containing the SNP target. After hybridization, the procedure consisted of extending the regions between the ASO and LSO, followed by melt-ing from a ligase enzyme, thus formmelt-ing a smelt-ingle allele-specific fragment. This fragment was subsequently ampli-fied using the enzyme Titanium Taq DNA polymerase
(Clontech Laboratories Inc., Palo Alto, CA, USA) and primers complementary to the ASO region were labeled with Cy3 and Cy5 fluorescence.
Finally, the PCR products were hybridized with the complementary region of LSO strings present on the sur-face of the holographic beads. SNP genotyping was done using the program Genome Studio version 1.8.4, (Illumina, USA), with call rate values ranging from 0.80 to 0.90 and³
0.26 for GenTrain grouping of SNPs. Clustering (grouping) to call alleles for each SNP was donea prioriin an auto-mated manner based on the intensity of the signals from Cy3 and Cy5. These signals were grouped into three classes of genotypes representing homozygous (AA and BB) and heterozygous (AB) alleles. For data analysis, the groups were adjusted individually and manually by determining the best clusters based on the parental profile.
Linkage mapping and QTL identification
Segregation analyses the SNP and SSR scoring of the 105 recombinant inbred lines and the SEA 5 and AND 277 parents were done using the chi-square test (X2), assuming 1:1 segregation ratios, with Bonferroni corrections. The ge-netic map was constructed with OneMap software version 2.0-1 (Margarido et al., 2007) using the multipoint ap-proaches and hidden Markov models for analysis in the RIL population. Briefly, after identifying the redundant markers and segregation distortion, the recombination fractions were estimated between each pair of markers using the two-point function. The markers were then assigned to the chromosomes using a LOD threshold of 3.0 and maximum genetic distance of 37.5 cM in conjunction with the Kosambi (1944) map function and the make.seq function. For the remaining markers, the try.seq function was used.
The positioning of the markers was refined using make.seq and map functions consecutively. To help decide on the position of each marker inserted in a specific linkage group, the rf.graph.table and draw.try=TRUE function
were used to display the heat map. The nomenclature of the chromosomes and physical positions were identified by comparisons through sequence similarity analysis using BLASTN against theP. vulgarisG19833 Andean genome
(https://phytozome.jgi.doe.gov/pz/por-tal.html#!info?alias=Org_Pvulgaris) and the integrated ge-netic map for the common bean based on microsatellite mapping described by Blairet al.(2011) and Camposet al.
(2011).
Normality of the phenotypic data of the least square means (LSMeans) distribution was assessed based on the skewness, kurtosis and Shapiro-Wilk values. The Box-Cox transformation was applied and the appropriate model for normalizing the data of each trait was selected using the lambda (l) parameter (Osborne, 2010).
Quantitative trait loci identification was done using QTL Cartographer v. 1.17 (Bastenet al., 2005) with
com-posite interval mapping (CIM) analysis. The likelihood ra-tio test (LRT) was used to check for the presence of QTL at 1 cM walkspeed and 10 cM window size. The coefficient of determination was calculated for each interval separately (R2) and for each interval given the background markers
(TR2) to determine the phenotypic variance explained by a
single QTL. LOD values were calculated using the formula LOD = 0.2172 * LRT. Multiple linear regression for each chromosomal position was applied at the 5% significance level to obtain the cofactors used in the analysis. Threshold values were identified for each trait based on 1000 permu-tations and represented by graphs using Excel 2010.
Statistical analysis
Analysis of variance (ANOVA) and the Generalized Linear Models (GLM) procedure were to assess the perfor-mances of the RILs and of each trait evaluated. All data and statistical analyses were done using the software SAS v.8.2 (SAS Institute, Cary, NC, USA). A value of p < 0.05 indi-cated significance.
Results
Marker characteristics
Field conditions
The well-watered greenhouse or control treatment was kept at 80% field capacity throughout the experiment, with an average temperature of 34 °C and 52% relative hu-midity. The water-stressed greenhouse was under terminal stress conditions in the vegetative phase (V3/V4) and had an average temperature of 36.4 °C and relative humidity of 42.4%. Humidity was lower in the stressed greenhouse and leaf temperatures showed almost the same pattern, with higher temperatures in the stressed greenhouse (Figure 1).
Descriptive statistics and analysis of variance of the morphological response patterns related to drought toler-ance detected significant differences among the parents and RILs for most of the traits (Tables 2 and S1). In the well-watered greenhouse, the parental lines, SEA 5 and AND 277, differed in leaf dry biomass, leaf temperature, days to flowering, number of pods, number of seeds per pod, yield, number of seeds, seed weight and pod weight. Among the
RILs, all the traits were significant and showed a normal distribution (Figure S1). The two parents were similar in terms of chlorophyll, leaf area, leaf fresh biomass, stem fresh biomass and stem dry biomass. Heritability was lower for pod weight (0.28) and higher for leaf fresh biomass (0.93).
In contrast, in the water-stressed greenhouse, the pa-rental lines differed in leaf area, leaf fresh biomass, leaf biomass, dry weight, leaf temperature, days to flowering, number of pods, number of seeds per pod, yield, number of seeds, seed weight and pod weight. Among the RILs, leaf fresh biomass and leaf biomass dry weight were not signifi-cant traits. Heritability was lower for leaf biomass dry weight (0.12) and higher for yield (0.95).
In the well-watered treatment, the mean yield of all the genotypes was 2.84 g/plant, and 1.97 g/plant in the treatment under drought stress. This result showed a 30% reduction in grain yield due to drought, calculated using the
QTLs for drought tolerance in beans 817
Table 1- Distribution of SSRs and SNPs mapped in the 11 chromosomes of the common bean genetic map from the AND 277 x SEA 5 population.
Linkage group (Pv) SSR SNP No. of linkage loci Linkage length (cM) Average distance (cM)
1 10 26 36 221.2 6.1
2 11 21 32 161.4 5
3 10 30 40 159.4 3.9
4 5 18 23 128.4 5.5
5 5 22 27 147.2 5.4
6 8 19 27 148.3 5.4
7 8 22 30 179.6 5.9
8 7 22 29 86.7 2.9
9 7 17 24 112.4 4.6
10 5 23 28 63.1 2.2
11 4 31 35 107.5 3
Total 80 251 331 1515.2 4.5
cM – CentiMorgan, SNP – single nucleotide polymorphism, SSR – simple sequence repeat.
drought intensity index. Parental means were significantly different, except for leaf fresh and dry biomass.
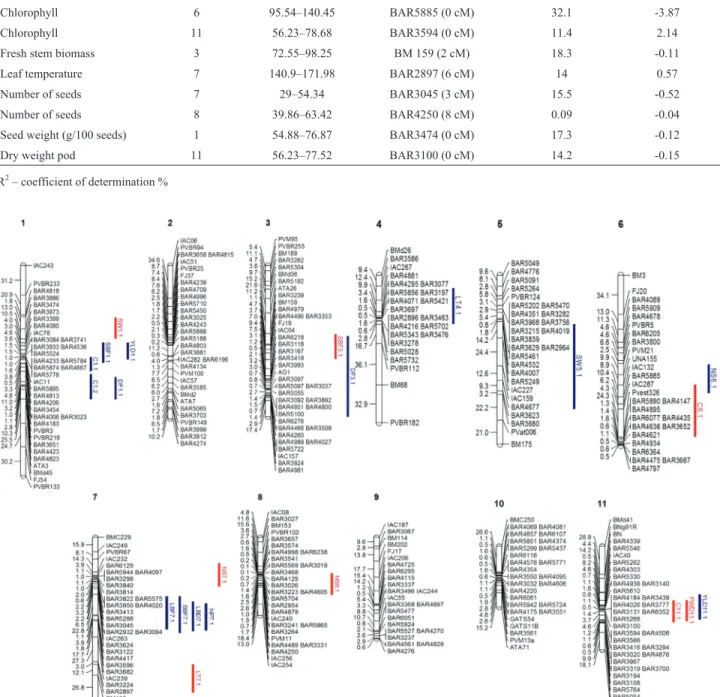
QTL mapping
Of 22 QTLs identified in the experiment, eight were under drought conditions and 12 under irrigation condi-tions (Tables 3 and 4, Figure 2). Dry pod weight was de-tected only under drought treatment and explained 17% of the phenotypic variance with a negative allele for the QTL, indicating that SEA 5 contributed to this trait, with an LOD of 3.48 and a BAR3100 marker located within the QTL (Table 4). The QTLs were detected in both conditions but appeared on different chromosomes (Figure 2). The great-est amount of phenotypic variance associated with drought tolerance was detected for the chlorophyll QTL, with a co-efficient of determination (R2) of 32.8%. However, this
trait was also detected in the irrigated condition and ex-plained 32.1% of the phenotypic variance. For drought treatment, stem fresh biomass, seed weight and number of seeds (g/100 seeds) showed the greatest effects with R2
(18%, 17% and 15%, respectively). These QTLs were found linked to the BM159 marker in Pv 3, the BAR3474 marker in Pv 1 and the BAR3045 marker in Pv 7, with a contribution from the SEA 5 allele. All the QTLs detected under drought treatment showed a contribution from the SEA 5 parental allele, except for one chlorophyll QTL identified in Pv 11 and one QTL for leaf temperature identi-fied in Pv 7. Fresh and dry biomass had a positive allele from AND 277 under irrigated treatment, whereas leaf tem-perature had a positive allele from AND 277 under both treatments. The number of pods and days to flowering
un-der the irrigated treatment and the number of seeds and seed weight under both treatments had a negative allele from SEA 5. Positive and negative alleles contributed to yield in the irrigated treatment. Most of the QTL identified a contri-bution from SEA 5 (13) rather than from AND 277 (9).
Discussion
When compared to other maps (Camposet al., 2011; Blairet al., 2012; Oblessucet al., 2014) the position of the markers remained the same on the 11 chromosomes, thus confirming the robustness and reliability of the genetic map generated by this study. The markers were placed on all 11 chromosomes and covered the whole genome, thereby al-lowing identification of the QTLs under two irrigation sys-tems. The average genetic distance between markers was 4.5 cM and therefore provides a dense map ideal for QTL analysis.
Exposure of the plants to drought stress substantially decreased the leaf water potential, relative water content and transpiration rate, with a concomitant increase in leaf temperature (Siddique et al., 2001). SEA 5 had cooler
leaves than AND 277, apparently by reducing the leaf tem-perature in drought conditions (Table 2).
Three types of drought stress are commonly recog-nized, with two types of water supply (irrigated for non-stress and rain-fed for drought non-stress) being used to assess the effects of the intensity and duration of drought on crop growth and seed yield in genetically fixed materials (Blair
et al., 2012; Sabadinet al., 2012). In this study, terminal
drought stress was chosen because it affects over 60% of
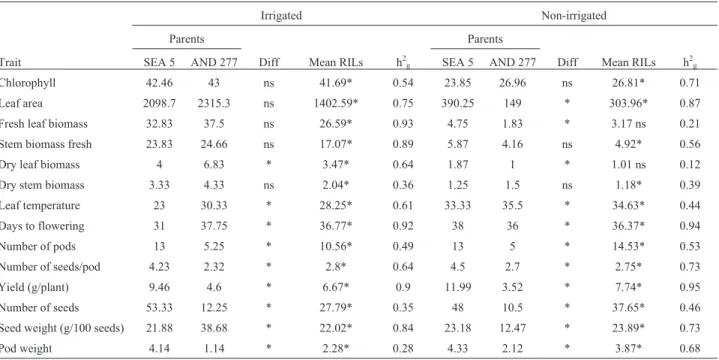
Table 2- Analyses of variance for quantitative traits for AND 277, SEA 5 and recombinant inbred lines of the AS population evaluated in a greenhouse under irrigated and non-irrigated (water-stressed) conditions.
Irrigated Non-irrigated
Parents Parents
Trait SEA 5 AND 277 Diff Mean RILs h2
g SEA 5 AND 277 Diff Mean RILs h2g
Chlorophyll 42.46 43 ns 41.69* 0.54 23.85 26.96 ns 26.81* 0.71
Leaf area 2098.7 2315.3 ns 1402.59* 0.75 390.25 149 * 303.96* 0.87
Fresh leaf biomass 32.83 37.5 ns 26.59* 0.93 4.75 1.83 * 3.17 ns 0.21
Stem biomass fresh 23.83 24.66 ns 17.07* 0.89 5.87 4.16 ns 4.92* 0.56
Dry leaf biomass 4 6.83 * 3.47* 0.64 1.87 1 * 1.01 ns 0.12
Dry stem biomass 3.33 4.33 ns 2.04* 0.36 1.25 1.5 ns 1.18* 0.39
Leaf temperature 23 30.33 * 28.25* 0.61 33.33 35.5 * 34.63* 0.44
Days to flowering 31 37.75 * 36.77* 0.92 38 36 * 36.37* 0.94
Number of pods 13 5.25 * 10.56* 0.49 13 5 * 14.53* 0.53
Number of seeds/pod 4.23 2.32 * 2.8* 0.64 4.5 2.7 * 2.75* 0.73
Yield (g/plant) 9.46 4.6 * 6.67* 0.9 11.99 3.52 * 7.74* 0.95
Number of seeds 53.33 12.25 * 27.79* 0.35 48 10.5 * 37.65* 0.46
Seed weight (g/100 seeds) 21.88 38.68 * 22.02* 0.84 23.18 12.47 * 23.89* 0.73
Pod weight 4.14 1.14 * 2.28* 0.28 4.33 2.12 * 3.87* 0.68
Diff – difference between parents, h2
QTLs
for
drought
tolerance
in
beans
819
Table 3- Identification of quantitative trait loci for chlorophyll, fresh leaf biomass, fresh stem biomass, dry leaf biomass, leaf temperature, number of pods, number of seeds, seed weight, days to flowering, dry pod
weight and yield for the AS population.
Trait QTL Treatment Pv Marker interval Marker LOD score LOD threshold Additive effect R2(%)
Chlorophyll C1.1AS Irrigated 1 114.7-140.7 BAR3651 9.8 3.8 0.36 32.88
Chlorophyll C1.2AS Irrigated 1 96.83-111.08 BAR3454 3.5 3.8 -0.21 11.23
Chlorophyll C6.1AS Drought 6 95.54-140.45 BAR5885 10.8 3.1 -3.87 32.12
Chlorophyll C11.1AS Drought 11 56.23-78.68 BAR3594 4.3 3.1 2.14 11.42
Fresh leaf biomass LBF7.1AS Irrigated 7 65.3-101.92 BAR3122 4.1 3.1 0.13 13.66
Fresh stem biomass SBF1.1AS Irrigated 1 81.43-102.44 IAC11 3.3 3 0.07 10.26
Fresh stem biomass SBF7.1AS Irrigated 7 65.3-105.92 BAR4417 3.8 3 0.08 13.2
Fresh stem biomass SBF3.1AS Drought 3 72.55-98.25 BM159 4.1 2.9 -0.11 18.26
Dry leaf biomass LBD7.1AS Irrigated 7 71.3-103.92 BAR4417 3 3 0.04 11.29
Leaf temperature LT4.1AS Irrigated 4 11.41-42.23 BAR4881 3.4 3 0.61 12.38
Leaf temperature LT7.1AS Drought 7 140.9-171.98 BAR2897 3 3 0.57 14
Number of pods NP7.1AS Irrigated 7 73.3-102.92 BAR3682 3.2 3.2 -0.06 12.63
Number of seeds NS6.1AS Irrigated 6 77.71-102.54 PVM21 3.3 3.1 -0.38 12.87
Number of seeds NS7.1AS Drought 7 29-54.34 BAR3045 4.1 2.9 -0.52 15.51
Number of seeds NS8.1AS Drought 8 39.86-63.42 BAR4250 4.1 2.9 -0.04 0.09
Seed weight (g/100 seeds) SW5.1AS Irrigated 5 42.67-116.38 BAR4677 3.9 3 -0.29 14.41
Seed weight (g/100 seeds) SW1.1AS Drought 1 54.88-76.87 BAR3474 4.4 3 -0.12 17.32
Days to flowering DF1.1AS Irrigated 1 117.7-140.76 BAR4823 3.2 3.1 -0.01 10.8
Days to flowering DF3.1AS Irrigated 3 74.55-159.28 BAR3097 5.1 3.1 -0.02 14.37
Dry weight pod PWD11.1AS Drought 11 56.23-77.52 BAR3100 3.5 3.1 -0.15 14.19
Yield (g/plant) YLD1.1AS Irrigated 1 81.43-98.87 BAR3084 3.2 3.1 0.19 10.08
Yield (g/plant) YLD11.1AS Irrigated 11 50.03-75.83 BAR4938 3.5 3.1 -0.19 11.86
dry bean production worldwide (White and Singh, 1991), with the most affected areas in Latin America being north-eastern Brazil and Central America. Although terminal drought stress is one of the most severe types of drought, the results of this experiment found a 30% reduction in grain yield and, surprisingly, even with the large reduction, some of the RILs had higher yields under terminal drought stressed conditions. These results corroborated those of Acosta-Diazet al.(2004) and may be explained by the
ob-servation that the drought allele (an allele for a favorable environment) was accompanied by a neutral allele for the other environment. This implies that yield under drought conditions and yield under well-watered conditions are not mutually exclusive and can be combined (Beebe et al.,
2011). Analysis of variance of the quantitative traits showed that the SEA 5 parental line was significantly supe-rior for almost all the traits measured under water stress conditions, except for leaf temperature. Under normal
con-Figure 2- Common bean linkage map constructed using the AND 277 x SEA 5 RIL population. The positions of the QTLs for drought (blue) and irri-gated treatments (red) are shown. Chromosomes were assigned based on theP. vulgarisL. genome (http://www.phytozome.net/).
Table 4- Identification of quantitative trait loci for significant drought tolerance in the AS population, their marker interval, marker located nearest to the QTL peak and its distance from the peak (in cM).
Trait Linkage group (Pv) Interval (cM) Marker (distance to the peak) R2(%) Additive effect
Chlorophyll 6 95.54–140.45 BAR5885 (0 cM) 32.1 -3.87
Chlorophyll 11 56.23–78.68 BAR3594 (0 cM) 11.4 2.14
Fresh stem biomass 3 72.55–98.25 BM 159 (2 cM) 18.3 -0.11
Leaf temperature 7 140.9–171.98 BAR2897 (6 cM) 14 0.57
Number of seeds 7 29–54.34 BAR3045 (3 cM) 15.5 -0.52
Number of seeds 8 39.86–63.42 BAR4250 (8 cM) 0.09 -0.04
Seed weight (g/100 seeds) 1 54.88–76.87 BAR3474 (0 cM) 17.3 -0.12
Dry weight pod 11 56.23–77.52 BAR3100 (0 cM) 14.2 -0.15
ditions, the days to flowering trait in SEA was greatly infe-rior to that of AND 277 under well-watered conditions and was greatly delayed under stress conditions (but was signif-icant in both cases). The performance of SEA 5 with regard to the number of seeds/pod, yield, seed weight and pod weight was better under drought (stress) compared to well-watered conditions, whereas the number of pods was unaf-fected.
Eight QTLs for drought conditions were identified and showed different levels of genetic variability; these QTLs were located on chromosomes 1, 3, 6, 7, 8 and 11. All the QTLs identified under drought conditions had the SEA 5 allele, except for the QTL for leaf temperature (LT7.1AS–
leaf temperature). Fourteen QTLs were identified in the ir-rigated environment, with R2values ranging from 10% to
33%, and were located on chromosomes 1, 3, 4, 5, 6, 7 and 11. QTLs were identified in all chromosomes except for chromosomes 2, 9 and 10. Overlapping QTLs were identi-fied in chromosomes 1, 3, 6, 7 and 11. Blairet al.(2012)
also found some overlapping QTLs and suggested that pleiotropic genes controlled two or more traits. Mukeshi-manaet al.(2014) found that correlated variables such as
phenology, yield and yield components, co-localized on the same chromosome and that the yield QTL occurred mainly on Pv03 and Pv09. In the present study, leaf fresh biomass, stem fresh biomass, leaf biomass dry weight and the num-ber of pods clustered together in Pv 7 under well-watered conditions. Although LBD7.1AS(dry leaf biomass) showed
a higher marker interval, it showed the same marker for the QTL peak (BAR4417) as SBF7.1AS(fresh stem biomass).
QTLs for chlorophyll, stem fresh biomass, leaf tem-perature, number of seeds and seed weight were identified in both treatments. For days to flowering, leaf fresh bio-mass, leaf biomass dry weight, number of pods and yield, QTLs were detected only in the irrigated treatment. For pod dry weight, a QTL was identified under drought conditions. The seed weight trait was important given that seed filling is inhibited under drought stress, so large seeds may indi-cate tolerance to drought and lead to higher yields (Ra-mírez-Vallejo and Kelly, 1998). Furthermore, the allele for seed size under drought and irrigated conditions came from the drought-tolerant parent, SEA 5. Two QTLs were found for seed weight, one in Pv 1 and the other in Pv 5. Blairet al.
(2012) also found QTLs for seed weight in Pv 5 and Broughtonet al.(2003) found QTLs in Pv 1. QTLs for days
to flowering were found in Pv 1 and 3, while Broughtonet al. (2003) located them in Pv 1 and 8. According to
Mukeshimanaet al.(2014), Pv03 also seems to be related
to the seed weight QTL.
The nature of drought and its interaction with multi-ple environmental factors make the validation of QTLs much more complex. Schneideret al.(1997) studied the
ge-netics of drought resistance using QTLs detected with RAPD markers. Four markers in one population and five in a second RIL population were reported to be important for
drought resistance. Beebeet al.(2006) reported the
identi-fication of markers for QTLs under drought and irrigated conditions in a RIL population derived from the SEA 5 x MD 23-24 cross; one QTL was common to two drought seasons, one was specific to each of two seasons, and some were common to unstressed environments. Blair et al.
(2012) identified several QTLs in a BAT477 x DOR364 RIL, most of them being for seed weight followed by yield per day, yieldper se, days to flowering and days to
matu-rity. However, these authors noted that fewer QTLs were detected in the first year because of differences in the sever-ity of drought stress and in the experimental conditions form year to year (terminalvs.intermittent drought).
In terms of breeding for drought tolerance, BAT 477 has been widely used to improve various classes of com-mon beans (Terán and Singh, 2002). SEA 5 is an advanced line derived from BAT 477 that proved to have a superior background in terms of donor alleles favorable to QTLs as-sociated with drought tolerance, as shown here.
Mukeshi-manaet al.(2014) reported that the only QTL associated
with yield under drought stress on Pv09 was contributed by the SEA 5 parent in combined environments, indicating the importance of SEA 5 alleles in maintaining yield under drought stress. Gonçalveset al.(2015) studied the
combin-ing ability under drought stress in common bean cultivars recommended for breeding programs aimed at drought tol-erance, with grain yield as the parameter. Common beans of the Durango race, such as SEA 5 from the semi-arid highlands of Mexico, have been reported to have the high-est levels of drought resistance (Terán and Singh, 2002). Thus, combining the germplasms of Durango and Meso-america races, such as SEA 5 x AND 277, may provide a consistent source of improved drought resistance for tropi-cal environments (Mukeshimanaet al., 2014).
Since the nature of drought and its interaction with multiple environmental factors makes QTL validation much more complex the challenge will be to test combined populations across broad classes of environments to deter-mine which QTLs are stable. The complexity of this task will assist in rationally establishing an effective approach for marker-assisted selection (MAS). Beebeet al.(2013)
suggested testing a subsample of 30-40 phenotypically ex-treme segregant RILs in a smaller trial over multiple sites for the sole purpose of validating the QTLs. Schneideret al.
(1997) validated markers using a small set of selected RILs. Multiple environment trials should be done and QTL map-ping confirmed in order to estimate genotype x environ-ment (G x E) interactions.
The results of this study indicate that SEA 5 and AND 277 parents had contrasting sensitivities to drought toler-ance, with SEA 5 having a superior background in terms of donor alleles favorable to QTLs associated with drought tolerance. The SEA 5 genotype was superior for drought tolerance for traits such as leaf area, pod dry weight and yield. Genotyping with SSRs and SNPs showed a high level
of polymorphism in the AS population and a high level of map saturation. Among QTLs associated with water defi-cit, 75% had a contribution from the SEA 5 genitor. For QTLs relevant to the cultivation of common beans, those related to leaf area, fresh mass and pod dry weight were the most important ones. Leaf foliar temperature was not a use-ful trait for future studies of QTLs associated with drought tolerance.
Drought tolerance is a complex quantitative trait con-trolled by many minor QTLs. This study confirmed that molecular markers are powerful tools for a better under-standing of the molecular basis of drought tolerance in the common bean and, once validated, can be used in molecu-lar breeding.
Acknowledgments
The authors thank CIAT (Cali, Colombia) for provid-ing the seeds of the AS population. BB was the recipient of a fellowship from FAPESP (grant no. 2009/50275-0) and this work was supported by a research grant from FAPESP (grant no. 2010/51186-9).
References
Acosta-Díaz E, Trejo-López C, Ruiz-Posadas LM, Padilla-Ra-mírez JS and Acosta Gallegos JA (2004) Adaptation of com-mon bean to drought stress during the reproductive stage. Terra Latinoamer 22:49-58.
Alzate-Marin AL, Arruda KM, Barros EG and Moreira MA (2003) Allelism studies for anthracnose resistance genes of common bean cultivar AND 277. In: Annual Report of the Bean Improvement Cooperative, Michigan. BIC 46:173-174.
Alzate-Marin AL, Schuster I, Moreira MA and Barros EG (2009) Association of dominant and recessive genes confers anthracnose resistance in stem and leaves of common bean. J Phytopathol 157:70-72.
Arruda KMA, Alzate-Marin AL, Oliveira MSG, Barros EG and Moreira MA (2008) Inheritance studies for anthracnose re-sistance genes of common bean cultivar AND 277. Annual Report of the Bean Improvement Cooperative, Michigan. BIC 51:170-171.
Asfaw A and Blair MW (2012) Quantitative trait loci for rooting pattern traits of common beans grown under drought stress
vs.non-stress conditions. Mol Breed 30:681-695.
Asfaw AA, Almekinders CJM, Struick PC and Blair MW (2013) Farmers’ common bean variety and seed management in the face of drought and climate instability in southern Ethiopia. Sci Res Essays 8:1022-1037.
Basten CJ, Weir BS and Zeng ZB (2005) QTL Cartographer ver-sion 1.17: A Reference Manual and Tutorial for QTL Map-ping. North Carolina State University, Raleigh.
Beebe SE, Rao IM, Blair MW, Tovar E, Grajales M and Cajiao C (2006) Identificación de QTL para resistencia a sequía en líneas recombinantes (RILs) de la cruza MD 23- 24 x SEA 5. Proceedings of the LII Annual Meeting of the PCCMCA (Program Cooperativo Centroamericano para el Mejora-miento de Cultivos y Animales), Montelimar, Nicaragua, pp. 24-28.
Beebe S, Ramírez J, Jarvis A, Rao IM, Mosquera G, Bueno JM and Blair MW (2011) Genetic improvement of common beans and the challenges of climate change. In: Yadav SS, Redden R, Hatfield JL, Lotze-Campen H and Hall A (eds) Crop Adaptation to Climate Change. Wiley-Blackwell, Ox-ford, pp 356-369.
Beebe SE, Rao IM, Blair MW and Acosta-Gallego JA (2013) Phenotyping of common beans for adaptation to drought. Front Physiol 4:1-19.
Benchimol LL, Campos T, Carbonell SAM, Colombo CA, Chio-ratto AF, Formighieri EF, Gouvêa LRL and de Souza AP (2007) Structure of genetic diversity among common bean (Phaseolus vulgarisL.) varieties of Mesoamerican and An-dean origins using new developed microsatellite markers. Genet Resour Crop Evol 54:1747-1762.
Blair MW, Iriarte G and Beebe SE (2006) QTL analysis of yield traits in an advanced backcross population derived from a cultivated Andean x wild common bean (Phaseolus vulgaris
L) cross. Theor Appl Genet 112:1149-1163.
Blair M, Buendia H, Giraldo M, Métais I and Peltier D (2008) Characterization of AT-rich microsatellite in common bean (Phaseolus vulgarisL.). Theor Appl Genet 118:91-103. Blair MW, Torres MM, Giraldo MC and Pedraza F (2009a)
De-velopment and diversity of Andean-derived, gene-based microsatellites for common bean (Phaseolus vulgarisL.). BMC Plant Biol 9:100.
Blair MW, Diaz LM, Buendia HF and Duque MC (2009b) Ge-netic diversity, seed size associations and population struc-ture of a core collection of common beans (Phaseolus vulgarisL.). Theor Appl Genet 119:955-972.
Blair MW, Hurtado N, Chavarro CM, Muñoz-Torres MC, Giraldo MC, Pedraza F, Tomkins J and Wing R (2011) Gene-based SSR markers for common bean (Phaseolus vulgarisL.)
de-rived from root and leaf tissue ESTs: an integration of the BMc series. BMC Plant Biol 11:50.
Blair MW, Galeano CH, Tovar E, Torres MCM, Castrillón AV, Beebe SE and Rao IM (2012) Development of a Meso-american intra-genepool genetic map for quantitative trait loci detection in a drought tolerant susceptible common bean (Phaseolus vulgarisL.) cross. Mol Breed 29:71-88. Broughton WJ, Hernandez G, Blair M, Beebe S, Gepts P and
Vanderleyden J (2003) Beans (Phaseolusspp.) – model food
legumes. Plant Soil 252:55-128.
Campos T, Oblessuc PR, Sforça DA, Cardoso JMK, Baroni RM, de Sousa ACB, Carbonel SAM, Chioratto AF, Garcia AAF, Rubiano LB,et al.(2011) Inheritance of growth habit
de-tected by genetic linkage analysis using microsatellites in the common bean (Phaseolus vulgaris L.) Mol Breed 27:549-560.
Carvalho GA, Paula JT, Alzate-Marin AL, Nietsche S, Barros EG and Moreira MA (1998) Herança da resistência da linhagem AND-277 de Feijoeiro-Comum à raça 63-23 de
Phaeoisariopsis griseolae identificação de marcador RAPD ligado ao gene de resistência. Fitopatol Bras 23:482-485. Cortés AJ, Monserrate FA, Ramírez-Villegas J, Madriñán S and
Blair MW (2013) Drought tolerance in wild plant popula-tions: the case of common beans (Phaseolus vulgarisL.). PLoS One 8:e62898.
combinatória em feijoeiro comum submetido ao déficit hí-drico. Bragantia 74:149-155.
Hanai LR, Campos T, Camargo LEA, Benchimol LL, Souza AP, Melotto M, Carbonell SAM, Chioratto AF, Consoli L, Formighieri EF,et al.(2007) Development characterization and comparative analysis of polymorphism at common bean SSR loci isolated from genic and genomic sources. Genome 50:266-277.
Kosambi DD (1944) The estimation of map distances from re-combinant values. Ann Eugen 12:172-175.
Levitt J (1972) Responses of Plants to Environmental Stresses. Academic Press, New York, 698 pp.
Margarido GRA, Souza AP and Garcia AAF (2007) OneMap: Software for genetic mapping in outcrossing species. Hereditas 144:78-79.
Mir RR, Zaman-Allah M, Sreenivasulu N, Trethowan R and Varshney RK (2012) Integrated genomics, physiology and breeding approaches for improving drought tolerance in crops. Theor Appl Genet 125:625-645.
Mukeshimana G, Butare L, Cregan PB, Blair MW and Kelly JD (2014) Quantitative trait loci associated with drought toler-ance in common bean. Crop Sci 54:923-938.
Müller BSF, Pappas GJ, Valdisser PAMR, Coelho GRC, de Me-nezes IPP, Abreu AG, Borba TCO, Sakamoto T, Brondani C, Barros EG,et al.(2015) An operational SNP panel inte-grated to SSR markers for the assessment of genetic diver-sity and population structure of the common bean. Plant Mol Biol Rep 33:1697-1711.
Oblessuc PR, Baroni RM, Pereira GS, Chioratto AF, Carbonell SAM, Briñez B, Da Costa E, Silva L, Garcia AAF, Camargo LEA,et al.(2014) Quantitative analysis of race-specific
re-sistance to Colletotrichum lindemuthianum in common
bean. Mol Breed 34:1313-1329.
Osborne JW (2010) Improving your data transformations: Ap-plying the Box-Cox transformation. Pract Assess Res Eval 15:9.
Pérez-Vega JC, Blair MW, Monserrate F and Ligarreto G (2011) Evaluation of an Andean common bean reference collection under drought stress. Agron Colomb 29:17-26.
Pieruschka R and Poorter H (2012) Phenotyping plants: genes, phenes and machines. Funct Plant Biol 39:813-820. Ramirez-Vallejo P and Kelly JD (1998) Traits related to drought
resistance in common bean. Euphytica 99:127-136. Rodríguez-Soárez C, Mendes-Vigo B, Pañeda A, Ferreira JJ and
Giraldez R (2007) A genetic linkage map of Phaseolus vulgarisL. and localization of genes for specific resistance
to six races of anthracnose (Colletotrichum lindemuthianum). Theor Appl Genet 114:713-722. Sabadin PK, Malosetti M, Boer MP, Tardin FD, Santos FG,
Guimarães CT, Gomide RL, Andrade CLT, Albuquerque PEP, Caniato FF,et al.(2012) Studying the genetic basis of
drought tolerance in sorghum by managed stress trials and adjustments for phenological and plant height differences. Theor Appl Genet 124:389-402.
Schneider KA, Brothers ME and Kelly JF (1997) Marker-assisted selection to improve drought resistance in common bean. Crop Sci 37:51-60.
Siddique MRB, Hamid A and Islam MS (2001) Drought stress ef-fects on water relations of wheat. Bot Bull Acad Sin 41:35-39.
Singh SP (1995) Selection for water-stress tolerance in interracial populations of common bean. Crop Sci 35:118-124. Singh SP (2007) Drought resistance in the race Durango dry bean
landraces and cultivars. Agron J 99:1219-1225.
Singh SP, Gepts P and Debouck DG (1991) Races of common bean (Phaseolus vulgaris, Fabaceae). Econ Bot 45:379-396.
Singh SP, Teran H and Gutierrez JA (2001) Registration of SEA 5 and SEA 13 drought tolerant dry bean germplasm. Crop Sci 41:276-7.
Terán H and Singh SP (2002) Comparison of sources and lines se-lected for drought resistance in common bean. Crop Sci 42:64-70.
Villordo-Pineda E, González-Chavira MM, Giraldo-Carbajo P, Acosta-Gallegos JÁ and Caballero-Pérez J (2016) Identifi-cation of novel drought-tolerant-associated SNPs in com-mon bean (Phaseolus vulgaris). Front Plant Sci 6:546.
White JW and Singh SP (1991) Sources and inheritance of earli-ness in tropically adapted indeterminate common bean. Euphytica 55:15-19.
Supplementary material
The following online, material is available for this article: Figure S1 - Distribution of quantitative traits across the RILs.
Table S1 - Descriptive statistics for the quantitative traits evaluated in the AND 277 x SEA 5 population.
Associate Editor: Everaldo Gonçalves de Barros
License information: This is an open-access article distributed under the terms of the Creative Commons Attribution License (type CC-BY), which permits unrestricted use, distribution and reproduction in any medium, provided the original article is properly cited.