Modeling of the shrinkage kinetics of coffee berries during drying
Gabriel Henrique Horta Oliveira1*, Paulo Cesar Corrêa2, Fernando Mendes Botelho3, André Luis Duarte Goneli4, Paulo Cesar Afonso Júnior5 and Sílvia Carvalho Campos6
1Instituto Federal de Brasília, DF-480, Lote 1, Setor de Múltiplas Atividades, 72405-980, Brasília, Distrito Federal, Brazil. 2
Departamento de Engenharia Agrícola, Centro de Ciências Agrárias, Universidade Federal de Viçosa, Viçosa, Minas Gerais, Brazil. 3Universidade Federal de Mato Grosso, Sinop, Mato Grosso, Brazil. 4Faculdade de Ciências Agrárias, Universidade Federal da Grande Dourados, Dourados, Mato Grosso do Sul, Brazil. 5Empresa Brasileira de Pesquisa Agropecuária, Centro Nacional de Pesquisa do Café, Brasília, Distrito Federal, Brazil. 6Empresa Brasileira de Pesquisa Agropecuária, Embrapa Agrossilvipastoril, Sinop, Mato Grosso, Brazil. *Author for correspondence. E-mail: [email protected]
ABSTRACT. The effects of drying conditions on the shrinkage of Coffea arabica L., cultivar Catuaí Vermelho, were studied. An exponential model derived from the kinetic model was used to describe the shrinkage kinetics. In addition, an equation was proposed to describe the relationship between the superficial areas and weights of the coffee berries. Coffee berries were dried at temperatures (T) of 35, 45, 55 and 65ºC and at relative humidities (φ) of 25, 35, 45 and 55%, forming 16 different sets of conditions, with an initial moisture content for all conditions of 2.27 dry basis (d.b.), dried until 0.11 d.b. Changes in the product dimensions were measured continuously during drying. Surface area-to-volume ratio values increased with moisture content decrease. The model was suitable for representing the shrinkage kinetics, as well the empirical equation for predicting surface area. Temperature had a greater influence over the constant rate of change of the characteristic dimension(k values) than φ. Activation energies were also determined to have magnitudes of 39.31, 37.32, 36.28 and 36.22 kJ mol-1 for relative humidities of 25, 35, 45 and 55%, respectively.
Keywords: surface area-to-volume ratio, post-harvest, activation energy, Coffea arabica L, shrinkage.
RESUMO. Modelagem da cinética de contração de frutos de café durante a secagem. Neste trabalho foi estudado o efeito das condições de secagem sobre a contração de frutos de café (Coffea arabica L.), cultivar Catuaí Vermelho. Um modelo exponencial derivado do modelo cinético foi utilizado para descrever a cinética da contração. Ademais, uma equação foi proposta para descrever a relação entre a área superficial e a massa dos frutos de café. Frutos de café foram secos às temperaturas de (T) de 35, 45, 55 e 65ºC, juntamente com umidades relativas (φ) de 25, 35, 45 e 55%, totalizando 16 condições diferentes, com um teor de água inicial de 2,27 base seca (b.s.), secos até 0,11 b.s. As alterações nas dimensões do produto foram mensuradas continuamente durante a secagem. Os valores de relação superfície-volume aumentaram com a diminuição do teor de água. O modelo foi adequado para representar a cinética da contração, bem como a equação empírica para predição da área superficial. A temperatura teve maior influência sobre a taxa constante de mudança da dimensão (k) que φ. Energias de ativação foram obtidas, com magnitudes de 39,31; 37,32; 36,28 e 36,22 kJ mol-1 para umidades relativas de 25, 35, 45 e 55%, respectivamente.
Palavras-chave: relação superfície-volume, pós-colheita, energia de ativação, Coffea arabica L., contração.
Introduction
The drying or dehydration of foods is one of the most common methods for assuring the quality and stability of agricultural products, decreasing the water activity of the material, reducing the biological activity, and reducing the chemical and physical changes of the material during storage. Moisture loss leads to modifications in cellular structure, consequently altering product shape and dimension. This information is particularly important to coffee
because it presents a high level of moisture content during the initial stages of drying.This moisture loss, according to Yan et al. (2007), influence the products’ physical properties and modify the final texture and transport properties of the dry foods.
the superficial area, shape and dimensions of an agricultural product are crucial data for mass and heat transfer studies as well as for airflow within a granular mass of the product. These parameters and additional information, such as moisture content, are used for predicting storage and drying conditions of grain and cereals and quality losses during the post-harvest period.
Agricultural products with high initial moisture contents such as coffee (approx. 60% w.b.) (RESENDE et al., 2009) easily lose moisture via diffusion to the surrounding environment, due to the great water vapor pressure difference between the product and the air. Depending upon the evaporative demand of drying air, the rate of moisture loss contributes to a marked reduction of the moisture content, material dimensions and, consequently, volume.
Shrinkage is the ratio between the initial volume and the volume at a certain time after the moisture loss processes. According to Ramos et al. (2005), this trend is due to the reduction of the product size (macroscopic phenomenon), which is a reflection of the reduction of its cellular dimensions (microscopic phenomena) because of the loss of moisture. Aguilera (2004) reported that shrinkage during the dehydration of agricultural products occurs when the viscoelastic matrix contracts into the space previously occupied by the water removed from the cells.
Bennamoun and Belhamri (2006), Ramos et al. (2005) and Mayor and Sereno (2004) reported that shrinkage is an important phenomenon that is frequently neglected during the development of drying models. Neglect of this phenomenon leads to inefficient machinery and handling. The correct quantification of this trend is vital because it allows for the analysis of drying kinetics and, consequently, of the whole drying process (HASHEMI et al., 2009).
Shrinkage has been correlated linearly to moisture content (DISSA et al., 2008; BATISTA et al., 2007). Hatamipour and Mowla (2002) reported a linear correlation for the volume change in carrots during the drying process. Ramos et al. (1994) studied microstructural changes in grape cells during the first stage of convective air drying and concluded that even though cell dimensions suffered modifications during drying, the cell shapes remained unchanged.
Several authors have studied the influence of different process conditions on the volume change of materials during dehydration. McMinn and Magee (1997) analyzed the effect of temperature on the drying of potatoes; Ratti (1994) investigated the influence of air velocity and relative humidity on the
drying of potatoes, apples and carrots; and Afonso Júnior et al. (2003) examined the effect of varying moisture content on the reduction of superficial area, volume and equivalent sphere diameter of coffee berries. However, these studies have not satisfactorily concluded the different conditions that influence the process of shrinkage.
The aim of this work was to determine the influences of various drying temperatures and relative humidities on the shrinkage of coffee berries during the drying process. These include changes in area and volume, which directly affect the visual attributes of the fruit. In addition to the above-mentioned parameters, a new correlation between the surface area and weight of coffee berries was investigated.
Material and methods
The present work was conducted in the Laboratory of Physical Properties and Quality Evaluation of Agricultural Products at the National Grain Storage Training Center – CENTREINAR, Federal University of Viçosa, Viçosa, Minas Gerais State, Brazil.
Coffee berries (Coffea arabica L.) from Catuaí Vermelho cultivar were purchased from a local farmer. They were manually harvested at the cherry stage with an initial moisture content of 2.27 d.b. Immature, deteriorated or damaged fruits were eliminated, with the purpose of obtaining a more homogeneous material with elevated quality.
Initial moisture contents were achieved by drying the product in an oven at 105 ± 1ºC, until a constant mass was obtained. These were performed in triplicate. The reduction of moisture content over drying time was supervised through weight loss until a final moisture content of 0.11 d.b was reached. To monitor weight loss, a digital chronometer and an analytical balance with a precision of 0.01 were utilized.
The drying treatments were placed in a 4 x 4 factorial scheme, with four temperature levels (35, 45, 55 and 65ºC) and four levels of relative humidities of drying air (25, 35, 45 and 55%) in a completely randomized design. The treatments conditions were achieved using a temperature-controlled chamber, manufactured by Aminco, model Aminco-Aire 150/300 CFM. Removable perforated trays were placed inside the equipment to allow air to pass through the samples, each of which contained 50 g of product. Airflow was monitored with an anemometer with rotating blades and kept at around 10 m3 min-1 m-2. Temperature and air
psychrometer installed next to the trays containing the samples.
Product dimensions were measured across the three orthogonal axes of the coffee berries using digital calipers after weighing the samples over a moisture content range of 2.27 to 0.11 d.b., with ten repetitions for each condition, in order to obtain product volumes (V).
Shrinkage
The association between physical processes and time can be described according to the classic kinetic model (Equation 1), in which P represents the physical characteristic being evaluated (in this case, volume); k is the constant rate of change of the characteristic dimension (h-1) that correlates volume
and time, dependent on the environment conditions in which the process occurs (LESPINARD et al., 2009); and m is the reaction order degree, which is dimensionless.
m
dP kP
dt (1)
For a various number of physical processes, it is difficult to distinguish between zero, first and second order kinetics. This fact can be explained by the small extension of reaction and the small evaluation rate of the studied parameter. Therefore, the m value was considered to be equal to one (first order) to facilitate the calculation procedure, and to linearly analyze the shrinkage phenomenon.
Data was evaluated using a non-linear regression analysis performed via STATISTICA 7.0® software
using an exponential model (Equation 2), which was obtained through Equation 1 after mathematical rearrangements.
1
0 exp
t
k t e
e
V V
V V
(2)
where:
V0: initial volume (cm3);
Vt: volume at a certain time (cm3); Ve: equilibrium volume (cm3); t: time (h).
The equilibrium volume was obtained from the average of the last three volumes. This was adopted since these values were practically constant, indicating that the equilibrium had been reached.
The best fit model was evaluated via calculation of the mean relative error (MRE) and the standard error estimation (SEE), Equations 3 and 4, respectively. The determination coefficient (R2) was
also utilized.
exp pre
1 exp
100 MRE
n
i
X X
n X
(3)
2exp 1
n
pre i
X X
SEE
DF
(4)where:
n: number of observations, dimensionless;
Xexp: experimental values of the equilibrium
moisture content (d.b.);
Xpre: calculated values of the equilibrium moisture content (d.b.);
DF: degrees of freedom.
For practical purposes, values below 10% of the mean relative error indicate a good fit (MOHAPATRA; RAO, 2005).
Activation Energy
Activation energy is defined as the minimum energy necessary to initiate a chemical reaction. In the drying process, the lower the activation energy is, the higher the water diffusivity in the product will be. This means that lower values of activation energy allow for a higher moisture transfer rate and, consequently, lower drying time and cost.
Arrhenius Equation (Equation 5) is widely used to model and evaluate parameters that modify with temperature, including shrinkage, during the drying process of agricultural products. This equation, in addition with STATISTICA 7.0® software,was employed to obtain the values
of activation energy of the cultivar studied in this work. This equation states the relationship between activation energy and the velocity at which the reaction occurs.
0exp
a
abs
E k A
RT
(5)
where:
A0: pre-exponential factor (h-1); Ea: activation energy (kJ mol-1);
R: universal gas constant (8.314 kJ mol-1 K-1); Tabs: temperature (K).
Surface area-to-volume ratio (SVR)
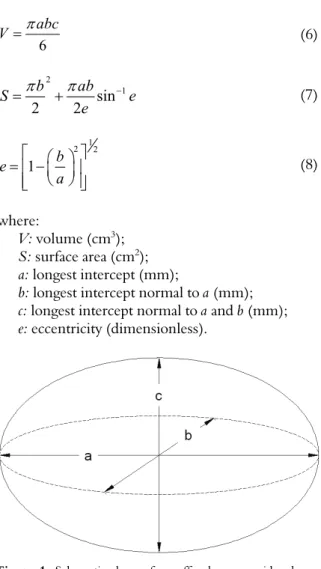
6 abc
V (6)
2
1
sin
2 2
b ab
S e
e
(7)
1 2 2
1 b
e
a
(8)
where:
V: volume (cm3); S: surface area (cm2); a: longest intercept (mm);
b: longest intercept normal to a (mm);
c: longest intercept normal to a and b (mm);
e: eccentricity (dimensionless).
Figure 1. Schematic draw of a coffee berry considered as a prolate spheroid shape type and its characteristics dimensions.
Surface area (S) and weight (W) relationship
Mohsenin (1986) states a relationship between weight and surface area for spheroid products (Equation 9):
d
S
W (9)where:
S: surface area, cm2;
d, ξ: constant, dimensionless; W: weight (g).
Quantifying the superficial area of agricultural products is a difficult process due to the fact that these foodstuffs do not have a uniform and homogeneous form. As a result, a great amount of time and many replicates are required, resulting in a large range of errors. On the other hand, weight measurement is easy to obtain with a simple weighing scale; therefore this equation provides a simple approach for acquiring values of superficial area by means of product weight. This information is essential for developing and
improving drying equipment and helping studies of mass and heat transfer.
Results and discussion
Shrinkage Evaluation
The constant rate values (k) for Catuaí Vermelho cultivar in each T and φ combination are shown in Table 1, in which k values were analyzed varying along with T and φ (Figure 2) in order to assess which factor had the highest influence over k.
0.05 0.10 0.15 0.20 0.25 0.30 0.35
0.25 0.30 0.35 0.40
0.45
0.50
0.55 30 35 40 45 50 55 60
k
(h
-1)
RH (dec
imal )
T (ºC)
Figure 2. Constant rate of change of characteristic dimension (k)
as a function of relative humidity (
φ
) and temperature (T).Equation 10 represents the surface shown in Figure 2. The modeling procedure was carried out by means of the software Table Curve 3D® v.4.0,
which provided a R2 of 0.9996.
2 2
0.0931346875 0.0008935 0.7045
0.000118 0.50625 0.00973
k T RH
T RH T RH
(10)
The figure presented allow us to conclude that k is more dependent on temperature variability, and during the drying process, k values decrease with higher
φ
values and increase with rises in temperature. These results are supported by other researchers. Krokida et al. (2000) considered that the temperature is the parameter with the most influence over food drying kinetics, and Afonso Júnior et al. (2004) also observed this trend for coffee berries. Ramos et al. (1994) found that temperature increased the rate of cellular shrinkage, with an Arrhenius type behavior.b and c values were attained in order to obtain the product volume. Volume values ranged from 10.59 x 10⁻⁷ to 6.43 x 10⁻⁷ m at the beginning and end of drying,
respectively. The total shrinkage was 1.22, 2.23 and 2.18 mm for a, b and c product dimension, respectively.
Figure 3. Total shrinkage representation of coffee berries.
Shrinkage is more relevant at the initial stages of drying. As the drying process occurs, the product tends toward an equilibrium state. As such, it starts to become more difficult for shrinkage to occur, leading to a stability of the product dimension characteristics. In addition, a combination of T and φ that provides a higher drying air potential (high T and low φ) also contributes to a stronger constant rate of change of the characteristic dimension (higher k) during dehydration. However, the product dimensions at equilibrium do not alter with air characteristics, but rather solely with the time to reach the equilibrium, which is diminished.
Activation energy
Activation energies obtained were 39.31, 37.32, 36.28 and 36.22 kJ mol-1 for relative humidities of 25,
35, 45 and 55%, respectively. Corrêa et al. (2006) also obtained the activation energy for coffee fruits; however, due to different cultivars and drying conditions used, their value (22.6 kJ mol-1) differs from
the present study, denoting the importance of evaluating different agricultural products and cultivars.
Figure 4 illustrates the activation energies found in this study. Examining this figure, it can be noticed that at higher φ (45-55%), the activation energy practically remained constant, marked by a breaking point at 45% φ. Furthermore, Ea increased with a decrease in φ. These features mean that at superior φ importance, it is easier to remove superficial moisture and less energy is required to do so. This trend can be explained by the following: higher φ values leads to lower water vapor pressure difference between the product and the drying air and consequently higher moisture content at the product surface (more water availability). Therefore, it becomes more difficult to remove moisture as the drying process occurs. Therefore, the highest k
values are expected for a drying air with the highest potential for decreasing the moisture content of the product (lower φ and higher T), as seen in Table 1.
Ea
(kJ mo
l
-1)
39.5
39.0
38.5
38.0
37.5
37.0
36.5
36.0
0.20 0.25 0.30 0.35 0.40 0.45 0.50 0.55 0.60 RH (decimal)
Figure 4. Activation energy (Ea) as a function of relative
humidity (φ).
Table 1. Estimated constant rates of change of characteristic dimension (k) for Catuaí Vermelho cultivar.
Temperature (ºC)
φ (%) 35 45 55 65
25 0.0826 0.1397 0.2231 0.3338
35 0.0843 0.1362 0.2116 0.3126
45 0.0791 0.1236 0.1890 0.2785
55 0.0670 0.1018 0.1550 0.2309
Surface area-to-volume ratio (SVR)
Figure 5 demonstrates that the SVR tends to decrease with an increase in moisture content (d.b.).
S
V
R
(m
-1)
640
620
600
580
560
540
520
500
0.00 0.50 1.00 1.50 2.00 2.50 X (decimal)
Figure 5. Surface area-to-volume ratio (SVR) as a function of moisture content (X).
As the moisture content increases, both the surface area and volume increase. However, the proportion of the volume increase is higher than that of the surface area, leading to lower SVR values.
Relationship between surface area (S) and weight (W)
and R2 values of 2.077, 0.1392 and 0.9134, respectively.
This indicates that the data fit well to the empirical equation, allowing the use of Equation 11 for predicting surface area using the coffee berry weight, at a moisture content range of 0.11 to 2.27 d.b.
S = 3.982756W0.278892 (11)
Conclusion
The shrinkage phenomenon can be represented through the model here suggested for the Catuaí Vermelho cultivar of coffee berries at the temperatures and relative humidity ranges of 35 to 65ºC and 25 to 55%, respectively. SVR had the tendency to decrease as moisture content increased, and a prediction of surface area using the weight of the coffee berry was satisfactory with respect to the empirical equation formulated in the moisture content range studied in this work. Constant rates of change of the characteristic dimension are more dependent on temperature variability than φ.
Acknowledgements
The authors are grateful to CAPES - Coordination of Improvement of Higher Education of Brazil - for financially supporting this research.
References
AFONSO JÚNIOR, P. C.; CORRÊA, P. C.; GONELI, A. L. D.; VILARINHO, M. C.; FRANÇA, A. S. Dinâmica da contração volumétrica do fruto de café durante o processo de secagem. Revista Brasileira de Armazenamento, Especial Café, n. 8, p. 29-35, 2004.
AFONSO JÚNIOR, P. C.; CORRÊA, P. C.; PINTO, F. A. C.; SAMPAIO, C. P. Shrinkage evaluation of five different varieties of coffee berries during the drying process. Biosystems Engineering, v. 86, n. 4, p. 481-485, 2003. AGUILERA, B. J. M. Quantification of microstructural changes during first stage air-drying of grape tissue. Journal of Food Engineering, v. 62, n. 2, p. 159-164, 2004.
BATISTA, L. M.; ROSA, C. A.; PINTO, L. A. A. Diffusive model with variable effective diffusivity considering shrinkage in thin layer drying of chitosan. Journal of Food Engineering, v. 81, n. 1, p. 127-132, 2007.
BENNAMOUN, L.; BELHAMRI, A. Numerical simulation of drying under variable external conditions: application to solar drying of seedless grapes. Journal of Food Engineering, v. 76, n. 2, p. 179-187, 2006.
CORRÊA, P. C.; RESENDE, O.; RIBEIRO, D. M. Drying characteristics and kinetics of coffee berry. Revista Brasileira de Produtos Agroindustriais, v. 8, n. 1, p. 1-10, 2006.
DISSA, A. O.; DESMORIEUX, H.; BATHIEBO, J.; KOULIDIATI, J. Convective drying characteristics of Amelie mango (Mangifera Indica L. cv. ‘Amelie’) with correction for
shrinkage. Journal of Food Engineering, v. 88, n. 4, p. 429-437, 2008.
HASHEMI, G.; MOWLAB, D.; KAZEMEINI, M. Moisture diffusivity and shrinkage next term of broad beans during bulk drying in an inert medium fluidized bed dryer assisted by dielectric heating. Journal of Food Engineering, v. 92, n. 3, p. 331-338, 2009.
HATAMIPOUR, M. S.; MOWLA, D. Shrinkage of carrots during drying in an inert medium fluidized bed. Journal of Food Engineering, v. 55, n. 3, p. 247-252, 2002.
KROKIDA, M. K.; KIRANOUDS, C. T.; MAROULIS, Z. B.; MARINOS-KOURIS, D. Drying related properties of apple. Drying Technology, v. 18, n. 6, p. 1251-1267, 2000. LESPINARD, A. R.; GOÑI, S. M.; SALGADO, P. R.; MASCHERONI, R. H. Experimental determination and modelling of size variation, heat transfer and quality indexes during mushroom blanching. Journal of Food Engineering, v. 92, n. 1, p. 8-17, 2009.
MAYOR, L.; SERENO, A. M. Modelling shrinkage during convective drying of food materials: a review. Journal of Food Engineering, v. 61, n. 3, p. 373-338, 2004.
McMINN, W. A. M.; MAGEE, T. R. A. Physical characteristics of dehydrated potatoes - Part I. Journal of Food Engineering, v. 33, n. 1-2, p. 37-48, 1997.
MOHAPATRA, D.; RAO, P. S. A thin layer drying model of parboiled wheat. Journal of Food Engineering, v. 66, n. 4, p.513-518, 2005.
MOHSENIN, N. N. Physical properties of plant and animal materials. New York: Gordon and Breach Publishers, 1986.
RAMOS, I. N.; BRANDÃO, T. R. S.; SILVA, C. L. M. Integrated approach on solar drying, pilot convective drying and microstructural changes. Journal of Food Engineering,v. 67, n. 1-2, p. 195-203, 2005.
RAMOS, I. N. A.; SILVA, C. L. M.; SERENO, A. M.; RATTI, C. Shrinkage during drying of foodstuffs. Journal of Food Engineering, v. 23, n. 1, p. 91-105, 1994.
RATTI, C. Shrinkage during drying of foodstuffs. Journal of Food Engineering, v. 23, n. 1, p. 91-105, 1994.
RESENDE, O.; ARCANJO, R. V.; SIQUEIRA, V. C.; RODRIGUES, S. Modelagem matemática para a secagem de clones de café (Coffea canephora Pierre) em terreiro de concreto. Acta Scientiarum. Agronomy, v. 31, n. 2, p. 189-196, 2009.
YAN, Z.; SOUSA-GALLAGHER, J. M.; OLIVEIRA, A. R. F. Shrinkage and porosity of banana, pineapple and mango slices during air-drying. Journal of Food Engineering, v. 83, n. 3, p. 430-440, 2007.
Received on May 15, 2009. Accepted on August 7, 2009.