system with different “paricá” forest component arrangements
Wellington de Azambuja Magalhães(1), Onã da Silva Freddi(1), Anderson Lange(1), Flávio Jesus Wruck(2), Wininton Mendes da Silva(3) and Matheus Bortolanza Soares(1)
(1)Universidade Federal de Mato Grosso, Programa de Pós-Graduação em Agronomia, Instituto de Ciências Agrárias e Ambientais, Avenida Alexandre Ferronato, no 1.200, Setor Industrial, CEP 78557-267 Sinop, MT, Brazil. E-mail: [email protected], [email protected], [email protected], [email protected] (2)Embrapa Agrossilvipastoril, Rodovia MT-222, Km 2,5, Zona Rural, Caixa Postal 343, CEP 78550-970 Sinop, MT, Brazil. E-mail: [email protected] (3)Universidade Federal de Mato Grosso, Programa de Pós-Graduação em Agricultura Tropical, Avenida Fernando Corrêa da Costa, no 2.367, Boa esperança CEP 78060-900 Cuiabá, MT, Brazil. E-mail: [email protected]
Abstract – The objective of this work was to compare the structural quality and water retention curve of a Haplustox under single, double, and triple “paricá” (Ochroma pyramidale) lines in an integrated production system at 50 months of implantation. Soil was collected from five sampling points considering the distances from the tree lines. Undisturbed samples were collected from the 0.00–0.10 and 0.10–0.20-m layers in order to assess porosity, density, soil penetration resistance, soil water retention curve, and the “S” index. The forest arrangement based on three paricá lines promoted better soil physical conditions than the system using single lines. The main changes were recorded in the 0.10–0.20-m layer, with increased microporosity and decreased cryptoporosity and resistance to penetration. The arrangements using single and double paricá lines result in higher volume of available water and greater soil compaction.
Index terms: Ochroma pyramidale, ICLF, physical quality of the soil, retention curve, water in the soil.
Atributos físico-hídricos do solo em sistema integrado de produção
com diferentes arranjos do componente florestal paricá
Resumo – O objetivo deste trabalho foi comparar a qualidade estrutural e a curva de retenção de água de um Latossolo Vermelho-Amarelo sob arranjos de linhas simples, duplas e triplas de paricá (Ochroma pyramidale), em um sistema integrado de produção com 50 meses de implantação. O solo foi coletado em cinco pontos de amostragem em relação à distância do renque das árvores. Foram coletadas amostras indeformadas nas camadas de 0,00–0,10 e 0,10–0,20 m para avaliar porosidade, densidade, resistência do solo à penetração, curva de retenção de água no solo e índice “S”. O arranjo florestal com três linhas de paricá promoveu melhores condições físicas ao solo em comparação ao renque de linha simples. As principais alterações ocorreram na camada de 0,10–0,20 m, com aumento da microporosidade e diminuição da criptoporosidade e da resistência à penetração. Os arranjos com paricá em linhas simples e dupla resultam em maiores volumes de água indisponíveis e compactação ao solo.
Termos para indexação: Ochroma pyramidale, ILPF, qualidade física do solo, curva de retenção, água do solo.
Introduction
The integration of trees into integrated agricultural production systems has been growing in the last few years, aiming to mitigate environmental impacts and to
promote system sustainability and land-use efficiency,
as already done in other systems commonly used, such as the no-tillage and the crop-livestock integration
systems. One of the benefits of integrated production
systems is the development of an edaphic environment more favorable for root development and growth, due
to soil physical or chemical qualities (Santos et al., 2008; Mendonça et al., 2013; Costa et al., 2015).
crop-livestock integration. However, the topic has been broadly discussed (Diel et al., 2014; Souza Neto et al., 2014; Assis et al., 2015; Nogueira et al., 2016), given the potential to recover degraded areas, mainly those covered with pasture.
“Paricá” or “Pau-de-balsa” or “paricá” [Ochroma pyramidale (Cav. ex Lam.) Urb.] stands out among the forest species most used in agrosilvopastoral systems, due to its great potential for use in intense forestry (Reis & Paludzyszyn Filho, 2011). Its inclusion in integrated production systems is favored by its fast growth, which allows animals to enter the area in a short period of time, also providing them with shade. However, to date, this forest species has been used mainly for paper and cellulose manufacturing, as well as for shipbuilding.
Tree-crop integrated production systems, especially in the different environments created by them, show
benefits and limitations. Souza Neto et al. (2014)
reported greater carbon contribution in tree-crop integrated production systems, but lower soybean yield in sites shaded by trees due to lower solar incidence. According to Paciullo et al. (2011), the tree component in integrated systems may affect pasture characteristics depending on the tree line distances. However, little is known about the effect of such component on soil physical properties and about the appropriate spacing between tree rows, which is important since the system dynamics includes agricultural, livestock, and forest components.
Currently, the use of machinery and implements in agriculture often causes soil compaction, destructuring it and diminishing its porosity (Spera et al., 2011; Silva et al., 2014). This also happens when the number of animals per hectare is increased or if the pasture is not recovered or reformed. Because of these factors, both the dynamics and management of integrated production systems become complex and require studies about their effects on the environment.
Plant production characteristics (Paciullo et al., 2011) and soil physical quality are also affected by tree shading (Souza Neto et al., 2014; Assis et al., 2015). However, there are few studies on the changes in soil attributes under forest arrangements depending on tree line distances (Souza Neto et al., 2014; Assis et al., 2015).
The objective of this work was to compare the structural quality and water retention curve of a
Haplustox under single, double, and triple “paricá” lines in an integrated production system at 50 months of implantation.
Materials and Methods
The study was conducted at the technological reference unit of Embrapa Agrosilvopastoril, in the municipality of Nova Canaã do Norte, in the state of Mato Grosso, Brazil (10°24'10"S, 55°43'22"W, at an
altitude of 280 m). According to Köppen’s classification,
the region presents Awi climate, rainy tropical, with a
well-defined dry season. Annual temperature variations
were between 20 and 38°C, with mean temperature of
26°C. The soil in the experimental site was classified as a Latossolo Vermelho-Amarelo distrófico, i.e.,
a Haplustox, with sandy clay loam texture, and the granulometric composition in the 0.00–0.20-m layer was: 340±4.42 g kg-1 clay and 540±4.72 g kg-1 sand;
there was no statistic difference between the assessed sites. The chemical characteristics of the 0.00–0.20-m layer, before the experiment was installed, were: pH 5.7 in H2O; 2.5 mg dm-3 P (Mehlich-1); 111 mg dm-3 K
(Mehlich-1); 1.56 cmolc dm-3 Ca; 0.44 cmolc dm-3 Mg; 0
cmolc dm-3 Al; 3.2 cmolc dm-3 H; and 17 g dm-3 organic
matter (OM).
The site was opened in 1998 for Brachiaria pasture implantation, which lasted for two years. Next, annual crops were cultivated during six consecutive years: two years with rice (Orzya sativa L.) and four years with soybean [Glycine max (L.) Merr.] and corn (Zea mays L.) as the first and second crops, respectively.
After these six years, the crop was replaced by Brachiaria pasture for two more years. The forest species was planted in 2009 after pasture desiccation with 1,260 g ha-1 a.i. glyphosate herbicide. A subsoiler
(with three stems) was used to cut 0.4-m grooves, spaced at 0.5 m from each other, in order to manually plant the forest species. This was done from east to west in order to allow better penetration of solar radiation between tree lines. The agricultural and livestock activities were implemented in an area of 20 m between tree lines, where the soil was not previously prepared mechanically.
Paricá II, in double line, 3x2 m between trees and 20 m between lines, totaling 434 trees per hectare; and Paricá III, in triple line, 3x3x2 m between trees and 20 m between lines, totaling 577 trees per hectare.
The 20-m strip between paricá lines was planted with the following crops in the initial years: rice in January 2009, followed by Urochloa brizantha
(Syn. Brachiaria brizantha) 'Xaraés' as ground
cover; soybean and rice as first and second crops,
respectively, in the 2009/2010 crop year; and soybean and corn (Zea mays L.) as first and second crops,
respectively, in the 2010/2011 crop year. From March 2011 onwards, pasture was introduced among the corn crop (intercropping), which was grazed starting in June 2011, after corn harvest. A mean stocking rate of three animal units (AU) per hectare was adopted: 4 AU ha-1 in the rainy season and 2 AU ha-1 in the dry
season.
On May, 2013, soil was collected at five sampling
points, at the following distances from the tree lines: 10 m from the southern side, 5 m from the southern side, on the central line under the tree canopy, 5 m from the northern side, and 10 m from the northern side. This was done in order to assess variations in soil physical property in the different environments created by the tree arrangements and by the movement of the animals.
For this, in each sampling point, trenches were opened to collect undisturbed samples from the core of the 0.00–0.10 and 0.10–0.20-m layers; this procedure was repeated three times in each tree arrangement, totaling 90 volumetric rings measuring approximately 100 cm3 (0.049 m in diameter and 0.05 in height).
The undisturbed samples were saturated through gradual water blade elevation for 24 hours and then
subjected to the following matric potentials (Ψ): 0.001,
0.003, 0.006, 0.008, and 0.01 MPa on the pressure table (Soilmoisture Equipment Corp., Goleta, CA, USA); and 0.03, 0.06, 0.1, 0.3, and 0.5 MPa in Richards chamber (Klute, 1986). Samples disturbed in Richards chamber were used to measure water content at a tension of 1.5 MPa. Subsequently, the volumetric humidity was calculated at this same tension by taking into account the soil density in all soil treatments. The water content of each sample was obtained after equilibrium was reached. Next, the samples were oven-dried at 105°C for 48 hours in order to determine soil density and total
porosity through the method proposed by Claessen (1997).
Soil penetration resistance (PR) was measured using a static electronic penetrometer at a constant penetration speed of 10 mm per minute, with cone angle of 30° and base area of 0.070 cm2. The readings
were performed on the undisturbed samples with water contents retained at a tension of 0.01 MPa. The mean PR was obtained from the 180 central values; the
first and the last centimeters of the samples were not
considered.
The volume of the pores was determined through the matrix tension, which allows classifying the pores according to their diameters. In the present study, macropores were considered those with a diameter equal to or greater than 0.03 mm, at a tension of 0.01 MPa; cryptopores, with a diameter lower than 0.0002, at a tension of 1.5 Mpa; and micropores, with a diameter between 0.03 and 0.0002 mm, considering the difference between the tensions of 0.01 and 1.5 MPa, as adapted from Klein & Libardi (2002).
Soil water retention curves (WRCs) were adjusted through the model proposed by Genuchten
(1980), with the restriction m = 1 - 1/n in the first
equation, minimizing the sum of the squared deviations. The SWRC software (Dourado-Neto et
al., 2001) was used to find the empirical adjustment parameters α, m, and n, and to fix saturation humidity (θs) in the value corresponding to total
porosity. For this, the following equation was used:
θ θ= r+
(
θs−θr)
(
1+(
α×Ψm)
)
n1−1 nwhere θ is the volumetric humidity (m3 m-3); θr is the
residual humidity (m3 m-3); θs is the saturation humidity
(m3 m-3); Ψ is the matric potential (MPa); and α (MPa-1)
and nare the empirical parameters of the equation. The
WRCs were used to find the available water in the soil
(AW), which was calculated through the difference
between θ in Ψ, equivalent to the field capacity (FC)
of 0.01 MPa and to the permanent wilting point (PWP) of 1.5 MPa.
After the WRCs were adjusted, the area under the retention curve (AUC) was determined based on the trapezoidal rule for more than one segment, according to the equation:
AUC k k j
k n
=
(
+ − ÷)
×=
∑
θ θ 11
where AUC is the area under the WRC (m3 m-3 MPa); θ is humidity (m3 m-3); and Ψ is the matric potential
(MPa).
The S index, which describes the structural quality
of the soil according to the slope in the WRC inflection
point (Dexter, 2004), was obtained based on the parameters recorded for the retention curve through the equation:
S = −n
(
θs−θr)
[
2n−1n−1]
[1n−2]where n and m are the parameters ruling the shape
of the curve; θs is the saturation humidity (kg kg-1); and θr is the residual humidity (kg kg-1). Although the
results of the S index were always negative, the S (S+) module, proposed by Dexter (2004) was used in the discussion.
The means were separated through the bootstrap technique, with 1,000 random resampling trials with replacement, following the method described by Christie (2004). This technique allows estimating parameters of interest, such as average, variance, and
confidence interval, among others, and is called
non-parametric bootstrap, since its estimates are based on data only; therefore, the probability distribution for these data is not expected (Efron & Tibshirani, 1993; Melo Filho et al., 2002). Based on the universe of 1,000 values, it was possible to determine the upper
and lower limits of the confidence interval of the
mean at 95% probability. This procedure was useful to further compare means (Mello et al., 2015): when
there were common values within the confidence
intervals (indicated by error bars), means did not differ from each other; however, when there was the absence
of common values, they differed significantly, at 5%
probability.
Results and Discussion
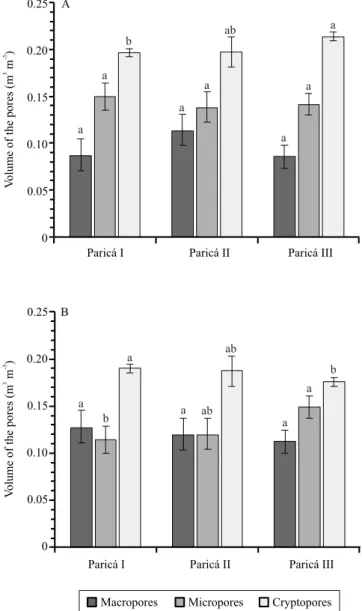
The attributes macropore, micropore, and cryptopore did not differ from each other between sampling sites in both layers, regardless of the tree line. The variables macro- and microporosity also did not differ between tree component arrangements in the 0.00–0.10-m layer (Figure 1). However, for Paricá II, the mean macropore values between tree arrangements in the layer of 0.00–0.10 m were higher than 0.10 m3 m-3, which is the limit for oxygen to flow to the root system of the plants
(Tormena et al., 1998).
Macroporosity in the 0.10–0.20-m layer presented values above 0.10 m3 m-3 in all arrangements, indicating a good aeration condition. There was also a significant
increase in microporosity in this same layer in Paricá II, compared with Paricá I. This allows inferring that increasing the number of tree lines in the row may help
Figure 1. Macropores, micropores, and cryptopores in the 0.00–0.10 (A) and 0.10–0.20-m layers (B) under forest component arrangements with paricá (Ochroma pyramidale) in an integrated production systems. Paricá I, planted in single line; Paricá II, in double line; and Paricá III, in triple line. Bars represent the confidence interval of the means. Means followed by equal letters do not differ by the bootstrap test, at 5% probability.
V
olume of the pores (m
3 -3 m ) 0 0.05 0.10 0.15 0.20 0.25
Paricá I Paricá II Paricá III
b ab a a a a a a a
Paricá I Paricá II Paricá III
ab a a a b a ab a b 0 0.05 0.10 0.15 0.20 0.25 V
olume of the pores (m
3
-3
m
)
Macropores Micropores Cryptopores
A
increase water retention in the plants, since micropores are fundamental for soil humidity retention between FC limits and PWP (Oliveira, 1968).
The volume of cryptopores differed in the 0.00–0.10-m layer, being greater for the Paricá III arrange0.00–0.10-ment, which differed from Paricá I. The lowest volume of cryptopores was found in the 0.10–0.20-m layer of Paricá III, also differing from Paricá I, which showed the highest volume of cryptopores. Silva et al. (2005) pointed out that the increased volume of cryptopores may be associated with soil compaction, which allows
pores with a greater diameter to be filled with the clay
dispersed in water.
According to Klein (2014), the cryptopores store water unavailable to plants above the limit of the PWP (1.5 MPa). The results obtained for micro and cryptoporosity in the 0.10–0.20-m layer allow inferring that after 50 months of installation, the increase in the number of paricá tree lines may promote changes in pore distribution, also aiding in the increase of water storage in the soil.
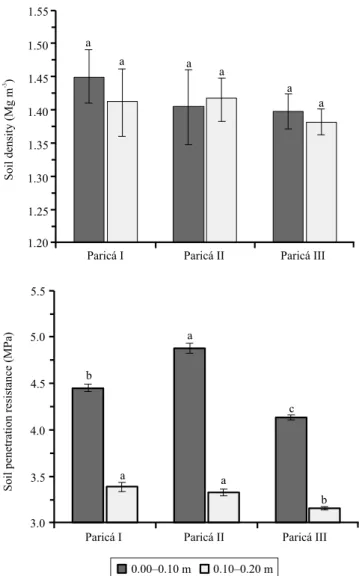
There were no differences between sampling sites regarding the variables soil density (Sd) and penetration resistance (PR) in the 0.00–0.10 and 0.10–0.20-m layers,
regardless of the tree line. No significant differences
were observed for Sd between paricá tree arrangements, although there were small variations between treatments in the layers of 0.00–0.10 and 0.10–0.20 m. Unlike Sd, PR differed between forest arrangements in both layers (Figure 2), indicating the better accuracy of this variable in distinguishing environments (Silva et al., 2016). The Paricá III forest arrangement presents the lowest restriction for root development in both layers, differing from Paricá I and Paricá II.
These results show that PR is more appropriate to differentiate the structural conditions of the soil in management systems, making it possible to better classify the structural conditions of forest component arrangements. Tree arrangements presented PR values above 3.0 MPa in both soil layers, which is considered a restrictive value for root development in most crops, according to Tormena & Roloff (1996). However, Paricá III had the lowest PR values, minimizing the compaction effects, mainly in the layer of 0.10–0.20 m. This arrangement also showed the highest volume of micropores and a reduction in cryptoporisity,
confirming its best soil structure. It is probable that
the higher root volume improved soil structure due to
the highest tree density in Paricá III. Assis et al. (2015) also reported greater changes in soil density and pore distribution in the layer of 0.10–0.20 m, in integrated systems.
In the present study, the obtained data were not compared with that of a reference area (for example, an exclusive pasture or a native vegetation); however, Assis et al. (2015), in 2012, assessed soil
physical attributes in the same site where the current experiment was conducted and found that eucalyptus forest arrangements led to better recovery of soil physical quality than degraded pasture. Therefore, this evidences the potential of integrated systems to improve the structural quality of such sites.
Humidity at FC, PWP, and available water did not differ between tree arrangements in the layer of 0.00–0.10 m (Figure 3). However, the overall mean of these attributes was higher in the 0.00–0.10-m layer, possibly because of the greater volume of grass roots and tree roots in this layer, which may have contributed to increase water retention in the soil. There was no difference between forest arrangements in the layer of 0.10–0.20 m regarding the variables FC and PWP. However, the content of available water in
the Paricá III arrangement was significantly higher
than that in Paricá I. This indicates that the triple tree line arrangement helped improve water storage due to the increase in microporisity and the decrease in cryptopore volume (Figure 1).
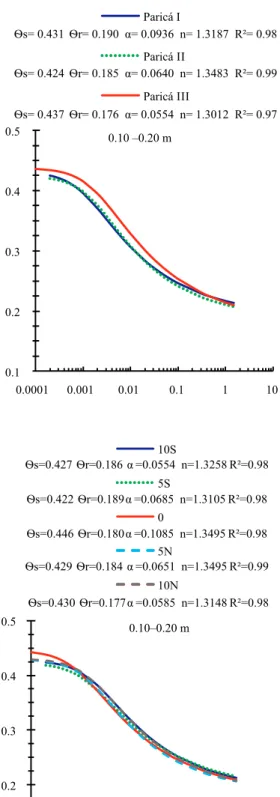
Forest arrangements changed the shape of the WRCs in the soil (Figure 4). Soil water retention was better in the Paricá III arrangement in both layers, but was more
expressive in the layer of 0.10–0.20 m, where there was a greater volume of available water and microporosity, besides a lower volume of cryptopores (Figures 1 and 3). It is likely that the greater number of trees in this system triggered changes in soil pore distribution and structural environment, as well as the increase in water retention. Silva et al. (2005) attributed the changes in water retention in the soil to a single matric potential and especially to pore diameter distribution, since pores are affected by the crop system.
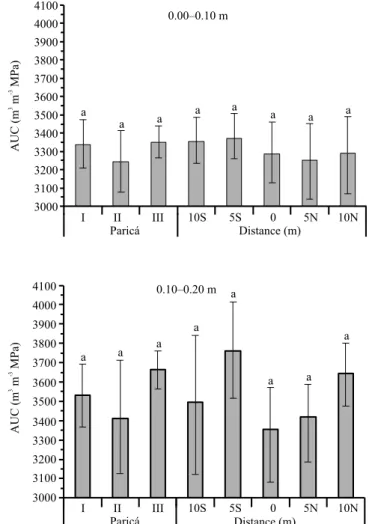
Although there were significant differences between
WRCs, which were expressed by the AUC (Figure 5), the results obtained for PR and AW showed that planting paricá in triple line may help improve soil physical quality.
The greatest variation in water content, between the matric potentials from 0.001 to 1 MPa, was recorded in the 0.00–0.10-m layer, when the WRC in the soil was assessed in each sampling site, regardless of the tree arrangement. Therefore, despite the cultivation of forest species from east to west, in order to allow more solar radiation in the system and to favor crop development, the soil physical-hydraulic attributes did not differ between sampling sites. However, it should
be noted that the soil sampled in the tree lines presented lower water retention capacity, mainly between matric potentials from 0.001 to 1 MPa.
With regard to the different sampling sites, no differences were observed for AUC, PR, and Sd, regardless of the tree row treatment.
These results make are indicative that there was no difference in the soil structural condition under the
tree canopies and between tree rows. Souza Neto et al. (2014) and Paciullo et al. (2010) also found differences in Sd in different sampling sites when evaluating eucalyptus tree lines grown in integrated systems.
There were no significant differences in the S
index values between tree arrangements and between sampling sites in both assessed layers (Figure 6). The mean values ranged from 0.031 to 0.040 and may evidence low structural quality under cerrado soil conditions (Andrade & Stone, 2008).
Figure 5. Area under the retention curve (AUC) in the 0.00–0.10 and 0.10–0.20-m layers under forest component arrangements with paricá (Ochroma pyramidale) and at five sampling points in an integrated production system. Paricá I, planted in single line; Paricá II, in double line; Paricá III, in triple line. Distances from the tree lines: 10S, 10 m from the southern side; 5S, 5 m from the southern side; 0, on the central line under the tree canopy; 5N, 5 m from the northern side; and 10N, 10 m from the northern side. Bars represent the confidence interval of the means. Means followed by equal letters do not differ by the bootstrap test, at 5% probability.
Although the S index values indicated low structural quality in different tree arrangements, the microporosity, cryptoporosity, and PR values are indicative of the better physical quality of the soil in the Paricá III arrangement than in Paricá I, in the 0.10–0.20-m layer.
Conclusions
1. The forest arrangement with three paricá (Ochroma pyramidale) tree lines results in lower soil penetration resistance values.
2. Paricá arrangements in single and double lines result in a greater volume of available water and soil compaction.
Acknowledgments
To Fundação de Amparo à Pesquisa do Estado de
Mato Grosso (Fapemat), for financial support; and to
Embrapa Agrossilvipastoril and to Gamada Farm, for providing the experimental site.
References
ANDRADE, R. da S.; STONE, L.F. Índice S como indicador da qualidade física de solos do cerrado brasileiro. Revista Brasileira de Engenharia Agrícola e Ambiental, v.13, p.382-388, 2008. DOI: 10.1590/S1415-43662009000400003.
ASSIS, P.C.R.; STONE, L.F.; MEDEIROS, J.C.; MADARI, B.E.; OLIVEIRA, J. de M.; WRUCK, F.J. Atributos físicos do solo
em sistemas de integração lavoura-pecuária-floresta. Revista Brasileira de Engenharia Agrícola e Ambiental, v.19, p.309-316, 2015. DOI: 10.1590/1807-1929/agriambi.v19n4p309-316.
BALBINO, L.C.; CORDEIRO, L.A.M.; PORFÍRIO-DA-SILVA, V.; MORAES, A.; MARTÍNEZ, G.B.; ALVARENGA, R.C.; KICHEL, A.N.; FONTANELI, R.S.; SANTOS, H.P. dos; FRANCHINI, J.C.; GALERANI, P.R. Evolução tecnológica e arranjos produtivos de sistemas de integração
lavoura-pecuária-floresta no Brasil. Pesquisa Agropecuária Brasileira, v.46, p.1-12, 2011. DOI: 10.1590/S0100-204X2011001000001.
CHRISTIE, D. Resampling with Excel. Teaching Statistics, v.26, p.9-14, 2004. DOI: 10.1111/j.1467-9639.2004.00136.x.
CLAESSEN, M.E.C. (Org.). Manual de métodos de análise de solo. 2.ed. rev. e atual. Rio de Janeiro: Embrapa-CNPS, 1997. 212p. (Embrapa-CNPS. Documentos, 1).
COSTA, N.R.; ANDREOTTI, M.; LOPES, K.S.M.; YOTOBATAKE, K.L.; FERREIRA, J.P.; PARIZ, C.M.; BONINI, C. dos S.B.; LONGHINI, V.Z. Atributos do solo e acúmulo de carbono na integração lavoura-pecuária em sistema plantio direto.
Revista Brasileira de Ciência do Solo, v.39, p.852-863, 2015. DOI: 10.1590/01000683rbcs20140269.
DEXTER, A.R. Soil physical quality: part I. Theory. Effects of soil texture, density, and organic matter, and effects on root growth. Geoderma, v.120, p.201-214, 2004. DOI: 10.1016/j. geoderma.2003.09.004.
DIEL, D.; BEHLING, M.; FARIAS NETO, A.L. de; ISERNHAGEN, E.C.C. Distribuição horizontal e vertical de fósforo em sistemas de cultivos exclusivos de soja e de integração
lavoura-pecuária-floresta. Pesquisa Agropecuária Brasileira, v.49, p.639-647, 2014. DOI: 10.1590/S0100-204X2014000800008.
DOURADO-NETO, D.; NIELSEN, D.R.; HOPMANS, J.W.; REICHARDT, K.; BACCHI, O.O.S.; LOPES, P.P. Soil water retention curve. Version 3.0 beta. Piracicaba: Universidade de São Paulo, 2001.
EFRON, B.; TIBSHIRANI, R.J. An introduction to the bootstrap. London: Chapman and Hall: CRC, 1993. 436p.
GENUCHTEN, M.T. van. A closed-form equation for predicting the hydraulic conductivity of unsaturated soils. Soil Science Society of America Journal, v.44, p.892-898, 1980. DOI: 10.2136/sssaj1980.03615995004400050002x.
KLEIN, V.A. Física do solo. 3.ed. Passo Fundo: Ed. da UPF, 2014. 263p.
KLEIN, V.A.; LIBARDI, P.L. Densidade e distribuição do diâmetro dos poros de um Latossolo Vermelho, sob diferentes sistemas de uso e manejo. Revista Brasileira de Ciência do Solo, v.26, p.857-867, 2002. DOI: 10.1590/S0100-06832002000400003.
KLUTE, A. Water retention: laboratory methods. In: KLUTE, A. Methods of soil analysis: Part 1 – Physical and mineralogical methods. Madison: American Society of Agronomy, 1986. p.635-660. DOI: 10.2136/sssabookser5.1.2ed.c26.
MELLO, J.M.; COUTO, E.G.; AMORIN, R.S.S.; JOHNSON, M.S.; LOBO, F.A. Dinâmica dos atributos físico-químicos e variação sazonal dos estoques de carbono no solo em diferentes
fitofisionomias do pantanal norte mato-grossense. Revista Árvore, v.39, p.325-336, 2015. DOI: 10.1590/0100-67622015000200012.
MELO FILHO, J.F.; LIBARDI, P.L.; LIER, Q.J. van; CORRENTE, J.E. Método convencional e “bootstrap” para estimar o número
de observações na determinação dos parâmetros da função K(Θ).
Revista Brasileira de Ciência do Solo, v.26, p.895-903, 2002. DOI: 10.1590/S0100-06832002000400006.
MENDONÇA, V.Z. de; MELLO, L.M.M. de; ANDREOTTI, M.; PEREIRA, F.C.B.L.; LIMA, R.C.; VALÉRIO FILHO, W.V.; YANO, E.H. Avaliação dos atributos físicos do solo em consórcio de forrageiras, milho em sucessão com soja em região de cerrados.
Revista Brasileira de Ciência do Solo, v.37, p.251-259, 2013. DOI: 10.1590/S0100-06832013000100026.
NOGUEIRA, A.K. da S.; RODRIGUES, R. de A.R.; SILVA, J.J.N. da; BOTIN, A.A.; SILVEIRA, J.G. da; MOMBACH, M.A.; ARMACOLO, N.M.; ROMEIRO, S. de O. Fluxos de óxido nitroso
em sistema de integração lavoura-pecuária-floresta. Pesquisa Agropecuária Brasileira, v.51, p.1156-1162, 2016. DOI: 10.1590/ S0100-204X2016000900015.
OLIVEIRA, L.B. de. Determinação da macro e microporosidade pela “mesa de tensão” em amostras de solo com estrutura indeformada.
PACIULLO, D.S.C.; CASTRO, C.R.T. de; GOMIDE, C.A. de M.; FERNANDES, P.B.; ROCHA, W.S.D. da; MÜLHER, M.D.; ROSSIELLO, R.O.P. Soil bulk density and biomass partitioning of Brachiaria decumbens in a silvopastoral system.
Scientia Agricola, v.67, p.598-603, 2010. DOI: 10.1590/S0103-90162010000500014.
PACIULLO, D.S.C.; GOMIDE, C.A.M.; CASTRO, C.R.T. de; FERNANDES, P.B.; MÜLHER, M.D.; PIRES, M. de F.Á.; FERNANDES, E.N.; XAVIER, D.F. Características produtivas e nutricionais do pasto em sistema agrossilvipastoril, conforme a distância das árvores. Pesquisa Agropecuária Brasileira, v.46, p.1176-1183, 2011. DOI: 10.1590/S0100-204X2011001000009.
REIS, C.A.F.; PALUDZYSZYN FILHO, E. Estado da arte de plantios com espécies florestais de interesse para o Mato Grosso. Colombo: Embrapa Florestas, 2011. 65p. (Embrapa Florestas. Documentos, 215).
SANTOS, H.P. dos; SPERA, S.T.; TOMM, G.O.; KOCHANN, R.A.; ÁVILA, A. Efeito de sistemas de manejo de solo, de rotação de culturas na fertilidade do solo, após vinte anos. Bragantia, v.67, p.441-454, 2008. DOI: 10.1590/S0006-87052008000200020.
SILVA, A.J.N. da; CABEDA, M.S.V.; LIMA, J.F.W.F. Efeito de sistemas de uso e manejo nas propriedades físico-hídricas de um Argissolo Amarelo de Tabuleiro Costeiro. Revista Brasileira de Ciência do Solo, v.29, p.833-842, 2005. DOI: 10.1590/S0100-06832005000600001.
SILVA, F.R. da; ALBUQUERQUE, J.A.; COSTA, A. da. Crescimento inicial da cultura da soja em Latossolo Bruno
com diferentes graus de compactação. Revista Brasileira de Ciência do Solo, v.38, p.1731-1739, 2014. DOI: 10.1590/S0100-06832014000600008.
SILVA, W.M. da; BIANCHINI, A.; CUNHA, C.A. da. Modeling and correction of soil penetration resistance for variations in soil moisture and soil bulk density. Engenharia Agrícola, v.36, p.449-459, 2016. DOI: 10.1590/1809-4430-Eng.Agric. v36n3p449-459/2016.
SOUZA NETO, E.L. de; ANDRIOLI, I.; ALMEIDA, R.G. de; MACEDO, M.C.M.; LAL, R. Physical quality of an Oxisol under an integrated crop-livestock-forest system in the Brazilian Cerrado. Revista Brasileira de Ciência do Solo, v.38, p.608-618, 2014. DOI: 10.1590/S0100-06832014000200025.
SPERA, S.T.; ESCOSTEGUY, P.A.V.; KLEIN, V.A.; DENARDIN, J.E.; SANTOS, H.P. dos. Atributos físicos de um Latossolo
Vermelho distrófico sob tipos de manejo de solo e rotação de
culturas. Revista Agrarian, v.4, p.313-323, 2011.
TORMENA, C.A.; ROLOFF, G. Dinâmica da resistência à penetração de um solo sob plantio direto. Revista Brasileira de Ciência do Solo, v.20, p.333-339, 1996.
TORMENA, C.A.; SILVA, A.P.; LIBARDI, P.L. Caracterização do intervalo hídrico ótimo de um Latossolo Roxo sob plantio direto. Revista Brasileira de Ciência do Solo, v.22, p.573-581, 1998. DOI: 10.1590/S0100-06831998000400002.
VILELA, L.; MARTHA JR, G.B.; MARCHÃO, R.L. Integração
lavoura-pecuária-floresta: alternativa para intensificação do uso
da terra. Revista UFG, ano 13, p.92-99, 2012.