www.ambi-agua.net E-mail: [email protected]
Rev. Ambient. Água vol. 12 n. 6 Taubaté – Nov. / Dec. 2017
Evaluation of soil water storage in native forest and eucalyptus areas
doi:10.4136/ambi-agua.2195
Received: 04 Oct. 2017; Accepted: 22 Oct. 2017
Marcelo dos Santos Targa1*; Getulio Teixeira Batista2;
Ana Aparecida da Silva Almeida1; Emilson Pohl1; Geberson Ricardo de Paula3
1Universidade de Taubaté (UNITAU), Taubaté, SP, Brasil
Programa de Pós-graduação em Ciências Ambientais, Departamento de Ciências Agrárias E-mail: [email protected], [email protected], [email protected]
2Universidade de Taubaté (UNITAU), Taubaté, SP, Brasil
Instituto de Pesquisas Ambientais em Bacias Hidrográficas, Departamento de Ciências Agrárias E-mail: [email protected]
3Secretaria da Educação do Estado de São Paulo, Taubaté, SP, Brasil
Secretaria de Educação Estadual, Diretoria de Taubaté. E-mail: [email protected]
*Corresponding author
ABSTRACT
In the region of the Paraíba do Sul river valley in the State of São Paulo, Brazil, pasture areas have been replaced by eucalyptus plantations, which can modify the dynamics of water in the soils of the region. The objective of this work was to evaluate the behavior of water in a Red-Yellow Latosol in two vegetative coverings, a six-year-old eucalyptus plantation, and a native forest, in the process of regeneration which began twenty years ago. The study was developed in the Una River basin from June 2009 to April 2011. The soil water potential was measured by 96 sensors (Watermark ™) at the depths of 20, 60 and 120 cm. The Available Water Capacity (AWC) and weekly residual soil storage for each layer were calculated. It was observed that the three layers reacted to the processes of rainfall and evapotranspiration and that there was a difference between the storage of water in the soil in the eucalyptus and native forest areas. There was no water restriction in the studied period; however, the variations in native forest storage were smoother than the variations occurring for eucalyptus. In the mean of the whole period and for the three layers, the storage in the native forest and eucalyptus were 88% and 64% of Available Water Capacity (AWC = 183 mm), respectively. These results show the native forest water conservation capacity in watersheds.
Keywords: watersheds, tensiometer, water use, forest.
Avaliação do armazenamento de água no solo em áreas de floresta
nativa e de eucalipto
RESUMO
Rev. Ambient. Água vol. 12 n. 6 Taubaté – Nov. / Dec. 2017
há vinte anos. O estudo foi desenvolvido na bacia hidrográfica do rio Una, no período de junho de 2009 a abril de 2011. Foram medidas semanalmente o potencial matricial de água no solo em 96 sensores (Watermark™), instados nas profundidades de 20, 60, e 120 cm. Foram calculados a Capacidade de Água Disponível (CAD) e semanalmente o armazenamento residual do solo para cada camada. Foi observado que, as três camadas reagiram aos processos de precipitação pluvial e evapotranspiração e que houve diferença entre o armazenamento de água no solo nas áreas de eucalipto e de floresta nativa. Não houve restrição de água no período estudado, contudo, as variações no armazenamento em floresta nativa foi mais suave que as variações ocorridas para eucalipto. Na média de todo o período e para as três camadas o armazenamento na floresta nativa e eucalipto respectivamente foram de 88% e 64% da Capacidade de Água disponível (CAD = 183 mm) Esses resultados mostram a capacidade de conservação de água da floresta nativa em bacias hidrográficas.
Palavras-chave: bacias hidrográficas, tensiômetro, uso da água, floresta.
1. INTRODUCTION
The region of the Paraíba Valley, in the State of São Paulo, has potential for expanding eucalyptus cultivation due to its climate and the availability of large areas occupied by degraded pastures. This change in the vegetative cover of the pasture to eucalyptus may have an impact on the landscape, regional economy and water dynamics in the soil-plant-atmosphere system (Lima, 1996).
Water is extremely important to plant production, and its rational management, as a way to avoid its lack or excess, is decisive for the full development of plants and for the preservation of the environment. Because it is stored in the soil, a reservoir open to the atmosphere and to the horizons or deeper layers, it is important to quantify elements of the terrestrial phase of the hydrological cycle, such as storage capacity, flows occurring both on the surface and the infiltration and the evaporation, as well as in the deeper layers of the soil.
It is fundamental to analyze the behavior of water in the soil with eucalyptus cover and other vegetative cover, especially of native forest, since there is a great discussion in relation to water availability in watersheds with extensive areas planted with eucalyptus. Another important aspect to consider in the water consumption of a region is the modification of the use and occupation of the soil by extension of one economic activity to the detriment of others. In this sense, Arguello et al. (2010) estimated that there was an increase of 32.2% in the eucalyptus plantation area from 2001 to 2007 in the Paraíba Valley region and that this increase was mainly due to the substitution of pasture. According to Carriello and Vicens (2011) silviculture developed over pasture areas (55%), secondary vegetation (15%), gallery forest (9%) and areas with exposed soil (7%).
The reduction of soil water content and the lowering of the water table are problems attributed to eucalyptus monoculture. Lima and Zakia (2006) agree that cutting the eucalyptus causes problems of overuse of water at the beginning of the crop to return, because in the drier months natural forests draw water from the deeper layers of the soil, while the forest Eucalyptus plantation under development (regrowth or new planting) removes water from the soil surface, making it even drier.
Rev. Ambient. Água vol. 12 n. 6 Taubaté – Nov. / Dec. 2017
2. MATERIAL AND METHODS
2.1. Characterization of the study area
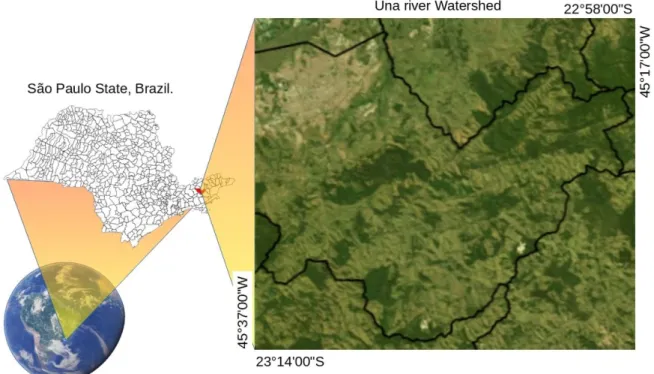
The present study was carried out in eucalyptus forest and native forest, both located in the Una River basin (URB) affluent on the right bank of the Paraíba do Sul River, between the parallels 23º14'00" S and 22º58'00" S and and the meridians 45°37'00" W and 45°17'00" W (Figure 1). This basin is formed by the union of the Almas River with the Rocinha River and its tributaries, totaling an area of 476 km², which corresponds to more than 80% of the area of the municipality of Taubaté (SP), which is 115 km from São Paulo-SP and 350 km from the city of Rio de Janeiro-RJ (Batista et al., 2005). The URB altitudes oscillate between 500 and 1,000 meters, with a boundary to the northeast by the Quebra Cangalha Mountain and to the southeast by the Jambeiro Mountain (CPTI, 2004).
Figure 1. Location of the Una River Basin (URB).
Source: adapted from Batista et al. (2005).
The climate in the Taubaté region is of the humid mesothermic type with drought in the months of June to August and precipitation from November to February (Fisch, 1999). Topographically, the region influences the variation of temperature and precipitation. In the mountains, winter temperatures are often below zero, while in the lower parts of the river basin average January temperatures of 32°C may occur.
According to Horikoshi and Fisch (2007) the soil water balance for Taubaté with data from 1992 to 2005 revealed a surplus of 263 mm, since the total annual precipitation is 1336 mm and Evapotranspiration is 1073 mm. They also observed a deficit of 34 mm in a 4-month period, but the surplus is 5 months, totaling 297 mm.
Rev. Ambient. Água vol. 12 n. 6 Taubaté – Nov. / Dec. 2017
Soil analyzes were carried out at the Soil Laboratory of the Department of Agrarian Sciences of the University of Taubaté. In order to determine the specific mass of the soil and to survey its water retention curve, undisturbed soil samples were collected at depths of 20, 60 and 120 cm by means of 50 cm3 volume metal rings.
The granulometric analysis was performed by the pipette method (Gee and Bauder, 1986; Kiehl, 1979), using sodium hydroxide (NaOH; 1N) as the chemical dispersant. For the mechanical dispersion of the sample, a low-speed rotary agitator (35 RPM) was used, with stirring time of the soil samples of 16 hours.
The soil (ds) and particle (dp) densities were determined by the volumetric ring and anhydrous alcohol methods, respectively, according to the recommendations of Ferreira et al. (1990). The total soil porosity (p) was obtained from the specific masses of the soil and the particles, according to Reichardt and Timm (2004).
2.2. Water tension in soil
In the field, soil water content was determined indirectly using WatermarkTM sensors (Figure 2), which measure the soil water matrix potential in kPa, which is converted to water content based on volume (m3. m-3) by means of a soil water retention equation (Tracom, 2004).
The Watermark sensor (Figure 2a) consists of an electric resistance-type groundwater voltage measurement system composed of two concentric electrodes inserted in a granular matrix material. These electrodes connected to the external wiring are connected to a reader (Figure 2b) which, as a function of soil moisture, transforms this reading of electrical resistance into groundwater potential. The tensiometers were constructed in ¾ "PVC tubes in lengths of 30, 70 and 130 cm with the voltage sensors positioned at the lower end. Wiring connects the sensors through the inside of the PVC pipes to the upper end, where they can be connected to the voltage meter.
Soil water retention curves relate the soil water potential (Ψm) and their volumetric water contents (θ) were determined in the Soil Physics Laboratory of the Agricultural Sciences Center of the Federal University of São Carlos, located in Araras, SP. In this determination the undisturbed soil samples were saturated with distilled water and placed in the Richards moisture extractors (Klute, 1986) at tensions of 10, 20, 30, 50, 100, 500, 1000 and 1500 kPa.
(a) (b)
Figure 2. (a) WatermarkTM soil tension sensor and (b) WatermarkTM equipment for reading soil water potential (Ψm).
Rev. Ambient. Água vol. 12 n. 6 Taubaté – Nov. / Dec. 2017
Figure 3. Distribution model of soil water tension sensors in the 0-20 cm (A), 20-60 cm (B) and 60-120 cm (C) layers.
2.3. Climatological water balance
The Climatological Water Balance was performed according to the methodology of Thornthwaite and Mather (1955), from the electronic data sheet GD V.3.2-2002 (D'Angiolella and Vasconcellos, 2002), which uses information of average temperature, precipitation and available soil water that serves a wide variety of crops and diverse hydrological applications.
According to Thornthwaite and Mather (1955), the available water capacity (WC), regardless of the type of soil used for forest species, ranges from 150 to 300 mm (Pereira et al., 2002).
The meteorological data of precipitation (mm) and air temperature (ºC) were collected at the Automatic Weather Station-A740, operated by the National Institute of Meteorology (INMET, 2009), located in the municipality of São Luiz do Paraitinga (SP), at 20 km of the experimental area, at an altitude of 870 m and coordinates 23º13'67" S and 45º25'00" W.
The reference evapotranspiration data were calculated by the Penman-Monteith method, following the procedures proposed by Smith (1991) and Allen et al. (1998).
3. RESULTS AND DISCUSSION
3.1. Soil characteristics of the experimental area
The predominant soil in both the eucalyptus forest and the native forest is a Red-Yellow Latosol (EMBRAPA, 1999) with distribution of the granulometric fractions that allowed for it to classify as a clayey texture.
The values determined for soil density (ds), soil particle density (dp) and total porosity (p) in the native forest and eucalyptus areas for the different layers are presented in Table 1, where it is verified that both areas have similar characteristics in terms of these parameters. In general, the two areas are similar in terms of chemical characteristics, which can be explained by the accumulation of plant material on the surface and nutrient cycling (Paula et al., 2013).
Table 1. Soil and particle densities in g. cm-3 and total soil porosity in % in native forest and eucalyptus
areas.
layer native forest eucalyptus
(cm) ds dp p ds dp p
0 - 20 1.16 2.47 52.8 1.24 2.37 47.9
20 - 60 1.27 2.42 47.7 1.29 2.48 47.9
60 - 120 1.14 2.54 55.2 1.12 2.52 55.7
Average 1.19 2.48 51.9 1.22 2.46 50.5
Rev. Ambient. Água vol. 12 n. 6 Taubaté – Nov. / Dec. 2017
potential type, between volumetric water content (θ) in m3.m-3 and the matric potential of soil
water (Ψm) in kPa for the native forest area and eucalyptus, with their respective coefficients of (R2) are given in Table 2.
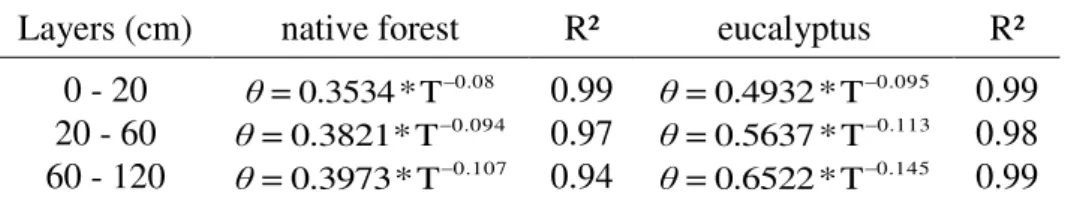
Table 2. Equations of matric potential (Ψm) and volumetric moisture (θ) for the 0-20 cm layers; 20 - 60 cm and 60 - 120 cm in the native forest and eucalyptus areas.
Layers (cm) native forest R² eucalyptus R² 0 - 20 0.3534*T0.08
=
θ 0.99 0.4932*T0.095
=
θ 0.99
20 - 60 0.3821*T0.094
=
θ 0.97 0.5637*T0.113
=
θ 0.98
60 - 120 θ=0.3973*T0.107 0.94 θ=0.6522*T0.145 0.99
The available water capacity (CWA) in the soil for the layers (z) from 0 to 20 cm; 20 - 60 cm and 60 - 120 cm for the native forest and the eucalyptus areas were calculated by the difference between the water content of the soil based on volume in the field capacity and the permanent wilting point multiplied by the difference of the upper depth and of the layer by
means of Equation 1. The residual water storage in the soil was also calculated by Equation 2. 𝐶𝑊𝐴 = (𝜃𝐹𝐶− 𝜃𝑃𝑊𝑃) ∗ 𝑍𝑢− 𝑍𝑙 (1)
𝑅𝑊𝑆 = (𝜃𝑎− 𝜃𝑃𝑊𝑃) ∗ 𝑍𝑢− 𝑍𝑙 (2)
Where:
CWA is the available soil water capacity in mm, considered as the maximum soil water storage capacity;
RWS is the residual water storage in mm, considered as the maximum soil water storage capacity;
𝜃𝐹𝐶 is the Volumetric water content at the field capacity in cm3 .cm-3;
𝜃𝑃𝑊𝑃 is the Volumetric water content at the wilting point permanent in cm3 .cm-3;
𝜃𝑎 is the Current or residual volumetric water content in cm3 .cm-3;
Z
ue Z
lare the Upper (u) and lower depths (l) of the layer considered.The values of the volumetric water content (cm3.cm-3) in the Field Capacity (𝜃
𝐹𝐶) and the
Rev. Ambient. Água vol. 12 n. 6 Taubaté – Nov. / Dec. 2017
Figure 4. Characteristic soil water curves for the 0-20 cm layers; 20 - 60 cm and 60 - 120 cm in the native forest (NF) and eucalyptus areas (EU).
Table 3. Volumetric water content in cm3.cm-3 in the field capacity and Permanent wilting point
for the layers of 0 - 20 cm; 20 - 60 cm; 60 - 120 cm and 0 - 120 cm in the areas of native forest and eucalyptus.
Áreas native forest eucalyptus
Layers
(cm) (FC) (PWP)
CWA
(mm) (FC) (PWP)
CWA (mm)
0 - 20 0.267 0.136 26.14 0.354 0.247 21.56
20 - 60 0.275 0.125 60.21 0.381 0.247 53.37
60 - 120 0.274 0.111 97.50 0.393 0.226 100.25
0 - 120 0.272 0.124 183.85 0.376 0.240 175.25
3.2. Hydric balance
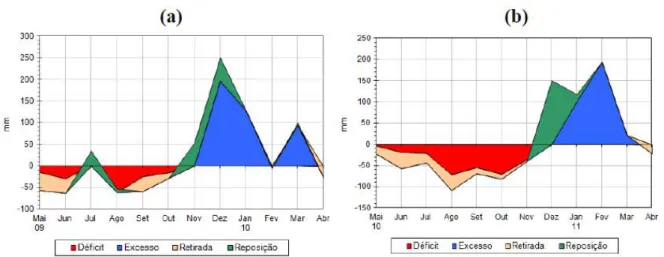
Figure 5 shows the climatological water balance in the soil for the period from May 2009 to February 2011. In this balance, the CWAvalue of 183.85 mm was adopted, corresponding to the maximum storage value determined for the 0 - 120 cm layer in the native forest area.
Figure 5a shows the climatological water balance for the period from May 2009 to April 2010, where it can be observed that in the months of May to September 2009, characterized as dry period, the water balance in the region was deficit; however, 284 mm of precipitation occurred in that period, which constituted a replacement of water in the soil as of June 2009.
Rev. Ambient. Água vol. 12 n. 6 Taubaté – Nov. / Dec. 2017
Figure 5. Climatological water balance 2009 to 2010 (a) and 2010 to 2011 (b).
3.3. Variation of soil water storage
Figure 6a shows the positive balance during the study period between precipitation and monthly evapotranspiration. The data collected indicate that there was a surplus of 516 mm of water in the soil during the study period. The total precipitation in the period was 3194.5 mm, and it should be noted that in the two periods from November to February it rained about 65% of the total in the period studied. The accumulated evapotranspiration in the period was 2677.8 mm, (83.82%) of the total precipitation.
Figures 6b and 6c show soil storage values in the 0-20 cm layers; 20 - 60 cm and 60 - 120 cm in the native forest and eucalyptus areas, respectively. It can be observed that there was a difference in soil water storage for the two vegetable groups during the studied period. In general, storage variations accompanied the precipitation regime, indicating that water penetrated and was stored in the soil, but also accompanied the evapotranspiration regime, demonstrating that the greater loss of water occurred at times of low occurrence of precipitation. Figure 6b and 6c also show the maximum storage capacities in each layer, respectively, established by the Available Water Capacity (CWA) values of each layer. Throughout the profile, the CWA calculated by Equation 1 of the native forest area (183 mm) was slightly higher than the eucalyptus area.
Figure 6b shows that the variations in the residual water storage in the soil of the native forest area were smoother and remained in most of the study period at values below the maximum storage in the three layers, but on average the values were very close to the maximum of each layer. In the 60 - 120 cm layer, the mean residual storage of the entire study period was of the order of 23 mm against 26 mm of the maximum. The storage exceeded the maximum at three times, mainly due to the occurrence of high rains that added more than 600 mm in November and December of 2009, and in December of 2010, when the rain reached 300 mm. On the other hand, the residual storage in the layers of 0 - 20 cm and 20 - 60 cm reached the maximum on 9 occasions. In the 20 - 60 cm layer, the average residual storage during the whole period was of the order of 55 mm against 60 mm of the maximum in this layer and at 6 times exceeded the maximum. The mean residual storage (25 mm) was more uniform and close to the maximum (26 mm) in the 0 - 20 cm layer and at 10 times reached the maximum.
Rev. Ambient. Água vol. 12 n. 6 Taubaté – Nov. / Dec. 2017
Rev. Ambient. Água vol. 12 n. 6 Taubaté – Nov. / Dec. 2017
Figure 6c shows that the variations in the residual water storage in the soil of the eucalyptus area over time were more pronounced, averaging for the whole period only 64% of the maximum storage for the three layers studied. However, only once, in December 2009, in the three layers, the residual storage exceeded the maximum, which coincided with an excessive precipitation of more than 400 mm and in most was always below. The storage of the 60 - 120 cm layer effectively declined so much that during a period of 2 months it was close to 53 mm; maximum storage of the layer of 20 - 60 cm was below that limit for 7 months. In the 20-60 cm layer, the mean residual storage value was 35 mm versus 53 mm of the maximum for this layer. In the 0-20 layer, the mean residual storage was 14 mm versus 21 mm (maximum storage value in that layer).
In forest systems, whether planted forest, such as eucalyptus, or native forest, the root system can supply water at greater depths. The mean residual storage of the native forest area in relation to the eucalypt forest was 51 mm higher. The variations in the storage of the layer up to 20 cm and from 20 to 60 cm in the eucalyptus crop may be due to the fact that the root system, composed of fine roots (<2 mm), is concentrated up to 50 cm deep, with a predominance of almost 58 (Witschoreck et al., 2003) and, also, due to the 0 to 20 cm layer, the soil-air interface is formed (Paula et al., 2013).
Another important aspect, as already observed (Paula, et al., 2013), conditions of higher temperature at the soil surface and lower temperature in the crown of eucalyptus trees may result in greater water loss due to transpiration in the eucalyptus area compared to native forest area in the same soil condition.
The results of this study demonstrated the conservation capacity of native forest water to the detriment of eucalyptus. However, the average residual storage of 64% of the maximum storage for eucalyptus cultivation is normal, since in irrigated systems it is common to irrigate when the water reserve in the soil reaches values of 50 to 70% of the maximum storage.
4. CONCLUSION
The use of water content sensors proved to be efficient for the measurement in different layers in a practical and fast way, reflecting the entry and exit of soil water in times of precipitation and drought.
The native forest area had a greater storage capacity (88% of maximum) of water in the soil than the eucalyptus area (64% of the maximum) at the three depths during the studied period. These differences demonstrate the importance of native forest in the conservation of water in watersheds.
5. ACKNOWLEDGMENTS
To the CNPq for the support to the Behavior of Water in Soil under Eucalyptus Vegetable Cover and Native Forest Essences, Process No. 480990 / 2007-7. To the company Fibria S.A. for the access to the study area, Fazenda Una.
6. REFERENCES
ARGUELLO, F. V. P. et al. Distribuição espacial de plantios de eucalipto no trecho paulista da bacia hidrográfica Rio Paraíba do Sul, SP, Brasil. Revista Ambi-Água, v. 5, n. 3, p. 133-146, 2010. http://dx.doi.org/10.4136/ambi-agua.158
Rev. Ambient. Água vol. 12 n. 6 Taubaté – Nov. / Dec. 2017
BATISTA, G. T.; TARGA, M. S.; DIAS, N. W.; CATELANI, C. S. Modelo de banco de dados ambientais georreferenciados voltado à recuperação e preservação de recursos hídricos de uma bacia de médio porte, o modelo da bacia do rio Una, Paraíba do Sul, SP. In: SIMPÓSIO BRASILEIRO DE RECURSOS HÍDRICOS, 16., 2005, João Pessoa. Anais.... Rio de Janeiro: ABRH, 2005. v. 1. p. 1-16.
CARRIELLO, F.; VICENS, R. S. Silvicultura de eucalipto no vale do Paraíba do Sul/SP no período entre 1986 e 2010. In: SIMPÓSIO BRASILEIRO DE SENSORIAMENTO REMOTO – SBSR, 15., 2011, Curitiba. Anais... São José dos Campos: INPE, 2011. p. 6403.
COOPERATIVA DE SERVIÇOS, PESQUISAS TECNOLÓGICAS E INDUSTRIAIS - CPTI. Plano das Bacias hidrográficas do rio Paraíba do Sul. Osasco, 2004.
D’ANGIOLELLA, G. L. B.; VASCONCELLOS, V. L. D. Cálculo do balanço hídrico climatológico com diferentes métodos para estimativa da evapotranspiração potencial, em planilhas ExcelTM. In: CONGRESSO BRASILEIRO DE METEOROLOGIA, 12,
2002. Anais... Foz do Iguaçu: SBMET, 2002. 1 CD-Rom.
EMBRAPA. Centro Nacional de Pesquisa de Solo. Sistema Brasileiro de Classificação de Solos. Rio de Janeiro, 1999. 412 p.
FERREIRA, M. E.; CRUZ, M. C. P.; FERREIRA Jr., M. E. Avaliação da Fertilidade empregando o sistema IAC de análise de Solo. Jaboticabal: UNESP, FCAV, 1990. FISCH, G. F. Distribuição da precipitação em Taubaté, Vale do Paraíba (SP). Revista
Biociências, v. 5, n. 2, p. 7- 11, 1999.
GEE, G. W.; BAUDER, J. W. Particle-size analysis. In: KLUTE, A. (Ed.). Methods of soil analysis. Part 1. Physical and mineralogical methods. Madison: American Society of Agronomy, 1986. p. 383-411.
HORIKOSHI, A. S.; FISCH, G. Balanço hídrico atual e simulações para cenários climáticos futuros no município de Taubaté, SP. Brasil. Revista Ambi-Água, v. 2, n. 2, p. 33-46. 2007. http://dx.doi.org/10.4136/ambi-agua.25
INSTITUTO NACIONAL DE METEOROLOGIA – INMET. Dados meteorológicos. Plataforma de Coleta de Dados A740. 2009. Available in http: www.inmet.gov.br. Access: mar. 2011.
KIEHL, E. J. Manual de edafologia: relações solo-planta. São Paulo: Ceres, 1979. 264p. KLUTE, A. (Ed). Methods of soil analysis. Part 1. Physical and mineralogical methods.
Madison: American Society of Agronomy, 1986. p. 1188.
LIMA, W. P. Impacto ambiental do eucalipto. 2. ed. São Paulo: EdUSP, 1996. 301 p. LIMA, W. P.; ZAKIA, M. J. B. As florestas plantadas e a água. São Carlos: Rima, 2006.
226p.
LIMA, W. de P. et al. Forest plantations and water consumption: a strategy for hydrosolidarity. International Journal of Forestry Research, 2012. Available in: http://dx.doi.org/10.1155/2012/908465. Access: 15 jul. 2017.
Rev. Ambient. Água vol. 12 n. 6 Taubaté – Nov. / Dec. 2017
PEREIRA, A. R. ANGELOCCI, L. R.; SENTELHAS, P. C. Agrometeorologia: fundamentos e aplicações práticas. Guaíba: Agropecuária, 2002.
REICHARDT, K.; TIMM, L. C. Solo, planta e atmosfera: conceitos, processos e aplicações. 2. ed. Barueri: Manole, 2004. 478 p.
SMITH, M. Report on the expert consultation on procedures for revision of FAO guidelines for predictions of crop water requirements. Rome: FAO, 1991. 45p. THORNTHWAITE, C. W.; MATHER, J. R. The water balance: publications in climatology.
New Jersey: Drexel. Institute of Technology, 1955. 104 p.
TRACOM IMP. EXP. E COM LTDA. Watermark sensores para monitoramento da umidade do solo. Available in: http://www.tracom.com.br/Irrometer/pdf/watermark.pdf. 2004. Access in: 21 maio 2009.
WITSCHORECK, R.; SCHUMACHER, M. V.; CALDEIRA, M. V. W. Estimativa da biomassa e do comprimento de raízes finas em Eucalyptus urophylla S.T. Blake no