XVIII IMEKO WORLD CONGRESS Metrology for a Sustainable Development September, 17 – 22, 2006, Rio de Janeiro, Brazil
ANALYSIS OF A NON-ITERATIVE ALGORITHM FOR THE AMPLITUDE AND PHASE
DIFFERENCE ESTIMATION OF TWO ACQUIRED SINEWAVES
Fernando M. Janeiro 1, Pedro M. Ramos 2, Mouhaydine Tlemcani 3, A. Cruz Serra 4
1 Instituto de Telecomunicações, Departamento de Física, Universidade de Évora, Évora, Portugal, [email protected] 2 Instituto de Telecomunicações, Instituto Superior Técnico, DEEC, Lisbon, Portugal, [email protected] 3 Instituto de Telecomunicações, Departamento de Física, Universidade de Évora, Évora, Portugal, [email protected]
4 Instituto de Telecomunicações, Instituto Superior Técnico, DEEC, Lisbon, Portugal, [email protected]
Abstract: In this paper, a non-iterative algorithm for
amplitude and phase difference estimation of two acquired sinewaves is presented and analyzed. The method is based on the least-squares fitting of ellipses where the common signal frequency is eliminated from the algorithm.
Keywords: Sine-fitting, ellipse fitting, amplitude and phase
difference estimation, least-squares method.
1. INTRODUCTION
Amplitude and phase measurements are essential for the characterization of the frequency characteristics of linear circuits [1] and can also be used to accurately measure impedances [2]. The numerical methods used to determine the amplitudes and phases of two acquired records corresponding to common frequency sinewaves include: zero-crossing detection, frequency domain algorithms (e.g., FFT and IpDFT) and sine-fitting algorithms.
All these methods require determination of the common frequency to accurately determine the phase difference and sine amplitudes. However, the frequency in itself is not needed since in most applications, it is imposed by the user. For example, in impedance measurement, the frequency is selected by the user and applied to the impedance under test.
In this paper a non-iterative algorithm to determine the sine amplitudes and phases is presented. The method does not require nor determine the signal frequency since it is based on the elliptical fit of the acquired records. The elliptical fitting method was presented in [3] and improved for implementation in [4]. The method best fits the acquired data with a conical, imposing the restriction that the returned parameters must correspond to an ellipse.
2. SINE-FITTING ALGORITHMS
Sine-fitting algorithms best fit the acquired records with the generic algebraic equation of a sine signal [5]. By minimizing the least-squares error for all the acquired samples, the sine amplitude, phase, frequency and DC component are estimated, this is called the four-parameter sine-fitting algorithm. This is an iterative method which
requires the strict definition of the convergence criteria to stop the iterative method.
When two common frequency signals are acquired, for example for impedance measurements as described in [2] and applied in [6], it is necessary to apply two four-parameter sine-fitting algorithms (one to each channel). Although the frequency is the same, the algorithms will produce slightly difference frequencies due to the iterative nature of the algorithms and different signal to noise ratio (SNR) of the two channels.
One way to assure common frequency is to apply the four-parameter algorithm to the highest amplitude channel (actually, highest SNR would be preferable, but this would requires extra calculations), and then apply the simpler non-iterative three-parameter algorithm to the other channel forcing the frequency obtained from the other algorithm. Although this approach works relatively well, half the acquisition points (the ones from the lowest amplitude channel) are not used for the common frequency estimation.
In [7] a different method was proposed, which uses all the acquired data points. This is the seven-parameter algorithm which determines in one iterative method, the sine amplitudes, phases and DC components of both channels as well as the common frequency.
All these methods are based on the time-fitting of sine signals to the acquired data – Fig. 1. They are iterative methods since the frequency makes the least-squares method nonlinear requiring the Taylor linearization around a given frequency and the consequent iterative method to accurately estimate the sine parameters.
-1 -0.5 0 0.5 1 0 0.25 0.5 0.75 1 1.25 1.5 1.75 2 Time/Period Voltages /V
Acquired Points for CH1 Acquired Points for CH2 Best Fitted Sine for CH1 Best Fitted Sine for CH2
Fig. 1. Time-domain fitting of two acquired noisy sine signals with common frequency and fS/f = 18.5.
3. LEAST SQUARES FITTING OF ELLIPSES
The frequency dependence of the time-domain fitting can be eliminated by re-writing the time-domain channel amplitude functions
( )
(
)
( )
(
)
1 1 2 2 sin 2 sin 2 = = + u t D ft u t D ft π π φ (1) in the form( )
( )
2 2 2 1 2 1 2 1 2 1 2 2 cos sin ⎛ ⎞ ⎛ ⎞ ⎛ ⎞ + − − ⎜ ⎟ ⎜ ⎟ ⎜ ⎟ ⎝ ⎠ ⎝ ⎠ ⎝ ⎠ u u u u D D D D φ φ =0. (2)The general conic is
(
)
2 2 1, 2 1 1 2 2 1 2 0 F u u =au +bu u +cu +du +eu + =f . (3) When , (4) 2 4 b − ac< 0the conic form represents an ellipse. For the two sine signals situation, this corresponds to
( )
2
cos φ <1. (5)
This means that the two sine signals can be represented by
an ellipse except if the phase is kπ with (in phase or
in opposition). In these situations, the XY representation of the sines corresponds to a straight line segment.
k∈ ]
The conic equation can be written in the form
(
1, 2)
= ⋅ =0 F u u x a , (6) where (7)[
]
2 2 1 1 2 2 1 2 1 . ⎡ = ⎣ = T u u u u u u a b c d e f x a ⎤⎦ The minimization of 2(
)
1, 2F u u must include the
restriction (4) to ensure a ellipse. The numerical method for ellipse fitting was presented in [3] and optimized for implementation in [4].
In Fig. 2, the results of the ellipse fitting applied to the acquired data presented in Fig. 1 are shown.
-1 -0.5 0 0.5 1 -1 -0.5 0 0.5 1 CH1 /V CH 2 /V
Best Fitted Ellipse Acquired Points
Fig. 2. Ellipse fitting of the data points from Fig. 1.
4. NUMERICAL SIMULATIONS
To assess the algorithm performance, extensive numerical simulations were performed. In order to match the experimental situation, the sampling frequency was set to
50209.2 S/s =
S
f in the range with 16 bit
resolution. The signal frequency is set to 10 V
±
1kHz =
f and
white Gaussian noise was added to the signals before the AD conversion.
In Fig. 3, four different situations are depicted. The sampling points are shown together with the fitting ellipse. For this case, only 51 points were considered which corresponds to approximately one period.
-3 -2 -1 0 1 2 3 -3 -2 -1 0 1 2 3 u1 /V u2 /V A -3 -2 -1 0 1 2 3 -3 -2 -1 0 1 2 3 u1 /V u2 /V B -3 -2 -1 0 1 2 3 -3 -2 -1 0 1 2 3 u1 /V u2 /V C -3 -2 -1 0 1 2 3 -3 -2 -1 0 1 2 3 u1 /V u2 /V D
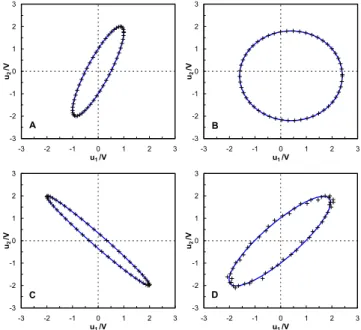
Fig. 3. Examples of ellipse fitting from numerical simulations: A) D1 = 1 V, D2 = 2 V, φ = 30 º, noise standard deviation of 1 mV;
B) D1 = 2 V, D2 = 2 V, C1 = 0.4 V, C2 = – 0.2 V, φ = 30 º, noise standard deviation of 1 mV; C) D1 = 2 V, D2 = 2 V, φ = 170 º, noise standard deviation of 1 mV; D) D1 = 2 V, D2 = 2 V, φ = 30 º, noise standard deviation of 50 mV.
In Fig. 4, the phase error standard deviation as a function of the input amplitudes is shown. These results were obtained with 502 samples, noise standard deviation of 1 mV and 10000 different simulations for each amplitude combination. For each simulation, the signals phase difference is randomly selected from the interval
[
−180º ;180º]
(uniform distribution).Clearly, as the signal amplitudes increases, the phase error standard deviation decreases. This result is similar to the results obtained with the seven-parameter sine fitting algorithm [7]. The main difference is that these results are obtained much faster since the algorithm used is non iterative and does not require the determination of the signal frequency.
For signals with amplitudes near the AD full scale range, the phase error standard deviation is only 0.00074º for 10 periods of sampled data.
Fig. 4. Standard deviation of phase error as function of amplitudes Di.
5. EXPERIMENTAL RESULTS
In this section the experimental setup used to test the ellipse fitting algorithm is described and all the experimental results are presented.
To test the algorithm in all the quadrants and with all possible amplitude combinations, a Tektronix AFG320 dual output arbitrary function generator was used. It allows locking of the two outputs and definition of the phase difference with 1º resolution and independent amplitude and offset channel selection. For the acquisition system a National Instruments DAQ USB-9215A was used. It has 4 input channels, maximum sampling rate of 100 kS/s and 16
bit resolution in the range. The two channels are
acquired simultaneously. This DAQ has an internal clock of 12 MHz and the possible sampling rates are
10 V ± 12 MHz = S f n , (8)
with . With the sampling rate is set to
. 120 ∈ >` n n=239 50209.2 S/s = S f
In Fig. 5, the experimental results obtained for the situations depicted in Fig. 3 are shown. These results correspond to only one period of sampled data from both channels.
To assess the influence of the number of acquired periods on the algorithm precision, the average value of the estimated amplitudes and the corresponding uncertainty
intervals at 2σ as a function of the acquired periods is
shown in Fig. 6. The situation depicted corresponds to with
1= 2 =5 V
D D φ=45º and the average and standard
deviation values are obtained from 1000 acquisitions. As the number of periods increase, the standard deviation is reduced. However, the results for acquisitions above 30 periods fail to further improve the standard deviation. This means that, for this situation, acquiring more than 30 periods does not reduce the standard deviation of the estimated amplitudes. The amplitude mismatch is caused by the arbitrary waveform generator since with the same signal at both inputs, the estimated amplitude is the same.
-3 -2 -1 0 1 2 3 -3 -2 -1 0 1 2 3 u1 /V u2 /V A -3 -2 -1 0 1 2 3 -3 -2 -1 0 1 2 3 u1 /V u2 /V B -3 -2 -1 0 1 2 3 -3 -2 -1 0 1 2 3 u1 /V u2 /V C -3 -2 -1 0 1 2 3 -3 -2 -1 0 1 2 3 u1 /V u2 /V D
Fig. 5. Experimental results of the ellipse fitting for the situations shown in Fig. 3. 5.016 5.017 5.018 5.019 0 10 20 30 40 50 6 Number of Periods D1 /V 0 4.999 5 5.001 5.002 0 10 20 30 40 50 6 Number of Periods D2 /V 0
Fig. 6. Average values of the estimated signal amplitudes and the
corresponding uncertainty intervals (2σ) as a function
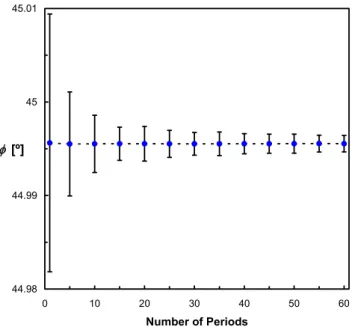
In Fig. 7, the average estimated phase difference and the
corresponding uncertainty interval at 2σ as a function of
the number of acquired periods is shown. Contrarily to the amplitude situation depicted in Fig. 6, the phase difference uncertainty is further reduced for acquisitions with more than 30 periods. 44.98 44.99 45 45.01 0 10 20 30 40 50 6 Number of Periods φ [º] 0
Fig. 7. Average values of the estimated phase difference and the
corresponding uncertainty intervals (2σ) as a function
of the number of acquired periods.
For 60 periods, the relative standard deviation of the phase is 0.00044º while the relative standard deviation of
is 0.0016 % and 0.0012 % for . In Fig. 8, the relative
standard deviations of the amplitudes are shown as a function of the number of acquired periods. Again, it is visible that there isn’t much improvement beyond 30 periods. 1 D D2 0.001 0.01 0.1 0 10 20 30 40 50 6 Number of Periods 0 [ ] 1 1 % D D σ [ ] 2 2 % D D σ
Fig. 8. Relative standard deviation of the estimated amplitudes as a function of the number of acquired periods for D1=D2=5 V.
To analyze the influence of the signal amplitude, another situation was experimentally characterized. In this situation,
1=5 V
D , D2=50 mV and φ=45º. In Fig. 9, the relative standard deviation of the estimated amplitudes is shown. Clearly, the standard deviation has increased for both channel amplitudes. Unlike the seven-parameter fitting, where the amplitude reduction of one channel does not influence greatly the standard deviation of the other channel amplitude estimative, in the ellipse fitting the reduction of one amplitude affects the estimation of both amplitudes. However, for 60 periods, the relative standard deviation of
is only 0.011 % and 0.019 % for .
1 D D2 0.01 0.1 1 0 10 20 30 40 50 Number of Periods 60 [ ] 2 2 % D D σ [ ] 1 1 % D D σ
Fig. 9. Relative standard deviation of the estimated amplitudes as a function of the number of acquired periods for D1=5 V and D2=50 mV.
In Fig. 10 the comparison between the standard deviation of the phase error as a function of the number of acquired periods is shown.
0.0001 0.001 0.01 0.1 1 0 10 20 30 40 50 6 Number of Periods σφ[º] 0 1 2 5 V 5V D D = = 1 2 5V 50 mV = = D D
Fig. 10. Standard deviation of the phase error as a function of the number of acquired periods for two different amplitude combinations.
On average, the standard deviation of the phase error for
and is 25 times higher than the
standard deviation of the phase error for
1=5 V
D D2 =50 mV
1=5 V
D and
. However, for 60 periods of acquired data, the standard deviation of the phase error is only 0.013 º for
and .
2 =5 V
D
1=5 V
D D2 =50 mV
In normal situations, the function generator will introduce several lower amplitude harmonics. Since the input signal includes other harmonics, the XY representation is no longer an ellipse. To test the algorithm under these circumstances a low cost function generator was used to supply voltage to the series connection of two impedances like the setup used for impedance measurements [2].
The circuit is composed by a 200 Ω resistor in series
with a 20 nF capacitor. The DAQ channel 1 acquires the function generator voltage while channel 2 acquires the much lower voltage across the resistor.
In Fig. 11, the normalized average power spectrum of the function generator (channel 1) is depicted. It can be seen that the THD is very poor and that the highest harmonic is actually the second which is an indication of the lack of symmetry of the sine signal.
-120 -100 -80 -60 -40 -20 0 0 5 10 15 20 25 f /kHz Ave rag e P o w er Spec trum /dB c
Fig. 11. Normalized average power spectrum of the low cost function generator output.
In Fig. 12, 100 sample points corresponding to one period (for this test the sampling frequency is
) are shown together with the best fitted ellipse. Notice that near the maximum of (X-axis) there are fewer points. This is a clear indication of sine distortion. The function generator also introduces a small negative DC component. 100 kS/s = S f 1 u
Further investigation of this aspect is still required to assure non bias estimates are obtained even in the presence of sine harmonics that distort the ideal XY plane ellipse. However, from the results shown in Fig. 12, the ellipse fit appears to correctly fit the acquired sample points.
-0.1 -0.05 0 0.05 0.1 -4 -2 0 2 4 u1 /V u2 /V
Fig. 12. Sampled points and the fitted ellipse. u1 corresponds to the function generator voltage while u2 is the voltage across a 200 Ω
resistor which is connected in series with a 20 nF capacitor.
6. CONCLUSIONS
In this paper an efficient, non-iterative method for estimating the amplitudes and phase difference of two acquired sine signals was presented. The method is very fast since no iterative process is required. When applied to impedance measurements, it will require less computational time and increase the number of impedance measurements per unit of time.
The method is particularly suited for situations where the excitation signals are very pure sine signals.
Further work will include a comparison with the seven-parameter sine fitting, focusing on the parameter estimation accuracy and uncertainty as well as the influence of ADC number of bits, sampling rate, number of acquired points, SNR ratio for both channels, phase difference and algorithm time consumption.
ACKNOWLEDGMENTS
Work sponsored by the Portuguese national research project reference POSC/EEA-ESE/57708/2004 entitled “Fast and accurate power quality measurements using analog to digital converters and digital signal processing techniques”.
REFERENCES
[1] M. Krumpholc and M. Sedlacek, “Measurement of Phase Difference Using DSP Algorithms by Non-Coherent Sampling”, 14th IMEKO Symposium on New Technologies in Measurement and Instrumentation, Gdynia, Poland, pp. 229-235, Sept. 2005.
[2] Pedro M. Ramos, M. Fonseca da Silva and A. Cruz Serra, “Low frequency impedance measurement using sine-fitting”, Measurement, vol. 35, n. 1, pp. 89-96, Jan. 2004.
[3] A. Fitzgibbon, M. Pilu and R. Fischer, “Direct least squares fitting of ellipses”, Proc. of the 13th International Conference on Pattern Recognition, pp. 253–257, Vienna, Sept. 1996.
[6] Tomáš Radil, Pedro M. Ramos and A. Cruz Serra, “DSP based portable impedance measurement instrument using sine-fitting algorithms”, IMTC 2005 – Instrumentation and Measurement Technology Conference, Ottawa, Canada, vol. 2, pp. 1018-1022, May 2005.
[4] R. Halir and J. Flusser, "Numerically Stable Direct Least Squares Fitting of Ellipses," Proc. WSCG’98, pp 125-132, University of West Bohemia, Campus Bory, Plzen - Bory, Czech Republic, Feb. 1998.
[5] IEEE Std. 1057-1994, Standard for Digitizing Waveform Records, The Institute of Electrical and Electronics Engineers, NewYork, December 1994.
[7] Pedro M. Ramos, Fonseca da Silva and A. Cruz Serra, “Improving sine-fitting algorithms for amplitude and phase measurements”, XVII IMEKO World Congress, Dubrovnik, Croatia, pp. 614-619, June 2003.