www.ann-geophys.net/29/1197/2011/ doi:10.5194/angeo-29-1197-2011
© Author(s) 2011. CC Attribution 3.0 License.
Annales
Geophysicae
Meteor head echo polarization at 930 MHz studied with the EISCAT
UHF HPLA radar
G. Wannberg1, A. Westman2, and A. Pellinen-Wannberg1,3
1Swedish Institute of Space Physics, P.O. Box 812, 98128 Kiruna, Sweden 2EISCAT Scientific Association, P.O. Box 812, 98128 Kiruna, Sweden 3Ume˚a University, 90187 Ume˚a, Sweden
Received: 11 January 2011 – Revised: 25 May 2011 – Accepted: 16 June 2011 – Published: 30 June 2011
Abstract. The polarization characteristics of 930-MHz me-teor head echoes have been studied for the first time, using data obtained in a series of radar measurements carried out with the tristatic EISCAT UHF high power, large aperture (HPLA) radar system in October 2009. An analysis of 44 tri-static head echo events shows that the polarization of the echo signal recorded by the Kiruna receiver often fluctuates strongly on time scales of tens of microseconds, illustrating that the scattering process is essentially stochastic. On longer timescales (>milliseconds), more than 90 % of the recorded events show an average polarization signature that is inde-pendent of meteor direction of arrival and echo strength and equal to that of an incoherent-scatter return from underdense plasma filling the tristatic observation volume. This shows that the head echo plasma targets scatter isotropically, which in turn implies that they are much smaller than the 33-cm wavelength and close to spherically symmetric, in very good agreement with results from a previous EISCAT UHF study of the head echo RCS/meteor angle-of-incidence relation-ship.
Significant polarization is present in only three events with unique target trajectories. These all show a larger effective target cross section transverse to the trajectory than parallel to it. We propose that the observed polarization may be a signature of a transverse charge separation plasma resonance in the region immediately behind the meteor head, similar to the resonance effects previously discussed in connection with meteor trail echoes by Herlofson, Billam and Browne, Jones and Jones and others.
Keywords. Interplanetary physics (Interplanetary dust) – Radio science (Waves in plasma; Instruments and tech-niques)
Correspondence to:G. Wannberg ([email protected])
1 Introduction
Meteor head echoes at UHF frequencies have now been sys-tematically observed by high power, large aperture (HPLA) radar systems for more than 20 years. But even after this time, our understanding of the detailed characteristics of the plasma targets that create the head echoes is still inconclu-sive and there is not much substantive data on their actual size and shape. This is so primarily because the targets are much smaller than the spatial resolution of the radar systems and therefore remain unresolved. As an example, scattering cross sections observed by the EISCAT UHF system span a range of more than three decades (≈1 mm2to 40 cm2), thus putting an approximate upper limit to the effective plasma target diameter at 33 cm wavelength at about 7 cm – but the best range resolution that the radar can deliver is in the order of 100 m!
It has however been long recognised that the polarization of a radar echo will contain information about the shape and orientation of the radar target even when individual scatterers are much smaller than the radar wavelength. The meteoro-logical community has been making operational use of this fact for decades to determine the type and amount of precip-itation (raindrops, sleet, snowflakes. . . ) detected by weather radar, and the literature abounds with publications on polari-metric S- and X-band weather radar systems and the results from these (e.g. Raghawan, 2003; Illingworth, 2003; Hogan et al., 2002).
Zenith
East
South
164 k m
279 k m
Kiruna, Sweden 67.9°N, 20.4°E
Sodankylä, Finland 67.4°N, 26.6°E Tromsø, Norway
69.6°N, 19.2°E
161 k m 96 k
m
199 k
m
132 k m
391 km
Ground projection 68.9°N, 21.9°E Common
volume Q
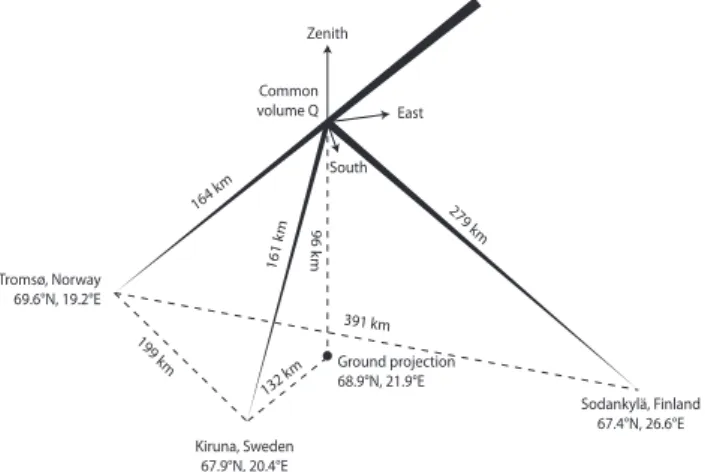
Fig. 1.Schematic illustration of the experimental geometry. Radar pulses are transmitted from the Tromsø, Norway radar site and scat-tered from targets in the common scattering volume atQ. The scat-tered signals are received at Tromsø, Kiruna and Sodankyl¨a.
echo polarization. The only direct head echo polarization measurements at VHF and UHF published so far are those made with the ALTAIR 160-MHz and 422-MHz systems in 1998 (Close et al., 2000, 2002, 2011).
Currently, the only other polarimetry-capable HPLA sys-tem in the world is the tristatic EISCAT UHF (Folkestad et al., 1983). Its two 32-m receive-only antennas at Kiruna, Sweden and Sodankyl¨a, Finland are fitted with dual orthog-onal linear (V/H) polarization feed systems that enable the antennas to be dynamically configured to match the polar-ization of the received incoherent-scatter signal. In a mea-surement series carried out in October 2009, we made use of this feature, together with the capability of the tristatic sys-tem to uniquely determine the vector velocities of head echo targets, to study the polarization of 930-MHz meteor head echoes for the first time.
2 The experiment
When the UHF radar is used in its “standard”, i.e. incoherent-scatter (IS), mode, the polarization of the incoherent-incoherent-scatter signals received at the Kiruna and Sodankyl¨a sites can take on any value from right-hand circular (RHC) via elliptical and linear to left-hand circular (LHC), depending on the lo-cation of the common scattering volume. In order to enable the Kiruna and Sodankyl¨a 32-m antennas to recover as much as possible of the available echo power, their feed systems are fitted with waveguideorthomode transformers(OMTs) that split the intercepted signals into two orthogonal, lin-early polarized components, oriented respectively along the local horizontal (H) and at right angles to the horizontal and the optical axis of the antenna (somewhat inappropriately la-belled “V”). The V and H component signals are amplified in separate LNA systems. In the IS system configuration the
amplified signals are then recombined into a single signal containing all the received power by a computer-controlled phase-shifting/summing passive four-port network (the “Po-larizer”), which is set to make the polarization response of the antenna match that of the scatter signal.
Our observations employed the polarimetric capabilities latent in this front-end configuration for the first time in EISCAT history: the Polarizers were bypassed and the Kiruna and Sodankyl¨a receiver systems reconfigured to pro-cess the H and V signals independently. After amplifica-tion and down-conversion to an intermediate frequency in the 10 MHz range in two separate but phase-coherent RF/IF chains, the H and V IF signals were sampled coherently by a dual-channel ADC and the two complex amplitude sample streams recorded to disk, so allowing subsequent sample-by-sample analysis. From these data, the V/H amplitude ratio and V-H phase difference of the received echo signal and, indirectly, the target polarization were determined.
The radar code used for our observations was a modified version of the “standard IRF meteor experiment” employed by the IRF radar meteor group since 2002 (Wannberg et al., 2008). The experiment geometry is shown in Fig. 1. A com-mon scattering volume (in the following section referred to as Q), located at 96.0 km altitude vertically above (68.876◦N,
21.880◦E), is illuminated by left-handed circularly polarized
(LHC) RF pulses transmitted from the UHF transmitter at Tromsø, Norway. In each 1656-µs radar cycle, a single low-sidelobe 32×2.4 µs pseudo-random BPSK pulse sequence is transmitted at 929.6 MHz. Target returns are observed by all three receivers and the received signals are sampled, digi-tised and recorded at 0.6-µs time resolution, corresponding to a range resolution of 90 m.
3 Theory
In a bi-static radar measurement, the polarization vector of the EM wave intercepted by the receiving antenna,PRX, can be expressed as:
PRX=kG(θ,φ,h,ref)ST (1)
The polarization of the signal transmitted by the Tromsø EISCAT UHF antenna can be freely selected by adjusting two high-power waveguide phase-shifters that are part of the antenna feed system. The system is normally set up to trans-mit a pure IEEE left-handed circularly polarized (LHC) sig-nal, but if the phase-shifters are not accurately adjusted, the transmitted signal will also contain a small cross-polarized (RHC) component. Assuming that the transmitted signal is pure LHC, it can be expressed in Jones notation as a column vector whose upper element represents the H-component and the lower element the V-component of the transmitted signal: TLHC=
1 √ 2
1 exp−iπ2
=√1
2 1 −i . (2)
We now consider the polarization of the scattered signal re-ceived at one of the receiver sites. For a path from Tromsø to Kiruna via our common observing volume atQ,
GT QK=
−0.5857−0.1720 0.5792 0.5947
To establish a reference, we first consider a situation where the common volume contains only normal ionospheric E-region plasma. With a typical density of ≈1010m−3 the plasma electrons are uncorrelated and the scattered signal is incoherent.
Uncorrelated electrons scatter isotropically, so the pola-rization of the incident wave is conserved in the scattering process, i.e.SIS=1. The polarization of the scattered wave reaching the Kiruna antenna is thus entirely determined by the scattering geometry (Faraday rotation along the path from Qto the Kiruna receiver is estimated at <5◦ and therefore
neglected): PK=
1 √
2GT QK·1·
1 −i
=√1
2
−0.5857+0.1720i 0.5792−0.5947i
(3) or in polar form (with the argument in degrees):
PK=
0.4316 6 163.6 0.58706 −45.8
=(0.43166 163.6)
1 6 0 ρ6 ϕ
(4) where the V/H amplitude ratioρ=0.5870/0.4316=1.360 and the relative (V-H) phase angle φ= −45.8−163.6= −209.4 or 150.6 (mod 360).
The polarization of a received head echo signalPHEcan now be determined as
PHE=(0.43166 163.6)
1
hEV(t ) EH(t )i
(5) whereEVandEH are the complex-valued V and H signals and the averaging is over all radar returns recorded during the passage of a meteor target through the common vol-ume. Head echoes received at Kiruna withρ≈1.360 and φ≈150.6◦ will represent almost isotropic targets.
Con-versely, significant deviations from the isotropic values in
either parameter imply that the target has polarized the scat-tered wave. In this case, the target scattering matrixStarget
can be determined by noting thatStargetandPK are related
through Starget 1 −i
=√2G−T QK1 PK (6)
such that the elements ofStarget can be found by fully ex-panding both members of Eq. (5) and identifying real and imaginary terms on the two sides of the equation. As will be-come apparent in the following, however, our experimental data turned out to be of such a nature that it could for the most part be understood in straightforward physical terms without going through a detailed analysis procedure.
For completeness, it should be pointed out that while the UHF antennas themselves exhibit exceptionally low crosstalk between the H and V polarizations (<−48 dB), such that measurements made in the main lobe can safely be assumed to be unbiased by cross-polarization effects, the two receiver channels used to process the V and H signals have slightly different gains and group delays. Consequently, the apparent polarization of the processed signal,PK,app, is also slightly different fromPK:
PK=CKPK,app (7)
whereCKis the inverse of the Kiruna receiver system
differ-ential transfer function. In the present case,CK was
deter-mined by an independent measurement two days before the actual observation and found to be very close to unity:
CK=
1 0
0 1.056
This says that the gain of the H receiver channel is about 5.6 percent greater than the gain of the V channel, such that the V amplitudes must be corrected by an equal amount, but that the phase lengths of the two channels are practically iden-tical, such that no phase angle correction is required. The amplitude correction is taken care of in the data-averaging step.
4 Observations and data
β δ
γ
Tromsø (T)
Kiruna (K) Q
met eor tr
ajec tory
v
er
tical
Bg
H ”V” TQK mirror plane
Z
E
S
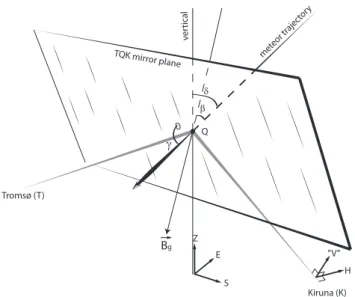
Fig. 2.Showing the relationships between the target trajectory and the most important cardinal directions, viz. the vertical, the local geomagnetic field, the T-K mirror plane and the H and “V” probes in the Kiruna antenna feed.
phase results presented below are thus derived from Kiruna data only.
To avoid interpretation problems caused by noisy data, a very high detection threshold was employed. Only those echoes whose signal power rose above the receiver noise baseline by more than four times the baseline standard de-viation were accepted as genuine. Our rationale for this was that clear signatures of polarization were expected to be seen only in the stronger echoes if any polarization existed in the first place. Weak echoes would either be associated with small targets, whose cross-sections would be well within the Rayleigh regime and which would therefore by definition scatter isotropically, or possibly be the result of scattering off extended volumes of enhanced but underdense plasma, in which case it is not clear if they should be classified as true head echoes. In either case, random noise would make the interpretation difficult. While it could be argued that this selection procedure introduces a systematic bias, it is also indisputable that it gives a correct representation of the po-larization characteristics of the strong signal part of the head echo population to within the statistical accuracy of the avail-able data.
Using the 4-σ detection criterion, about 900 head echoes were identified in the 18 h of monostatic (Tromsø) data. About 67 % of these were detected above and below the com-mon scattering scattering volume (the Tromsø system was programmed to have about three times the range coverage of Kiruna and Sodankyl¨a). Of the remaining 300 events, only 44 exceeded the 4-σ threshold also in the Kiruna and Sodankyl¨a data. These tristatic events have been analysed as follows: for each event, target range information and
Table 1.Derived parameters and their symbols.
Derived parameter Symbol
Angle between target trajectory and vertical δ
Angle between target trajectory and magnetic field β
Angle between target trajectory and TQK mirror plane γ
Peak signal power pwr
Target speed v
Angle between target trajectory and horizontal feed probe H
Angle between target trajectory and “vertical” feed probe V
Doppler velocity components (vT QT,vT QK andvT QS)are
extracted from the data by the cross-correlation/matched-filter method described by Wannberg et al. (2008). The aver-age echo amplitude ratioρ= |EV/EH|, the average phase an-gleφ= 6 (EV−EH)and echo peak power are also extracted. To simplify the interpretation of the data, the velocity com-ponents are then transformed into a right-handed Cartesian system with its origin at the centre of the common scattering volume,Q, and its axes oriented due south, due east and to-wards zenith. Following this transformation, the target speed (v), the angle between the target trajectory and the vertical (δ), the angle between the target trajectory and the magnetic field atQ(β)and the angle between the trajectory and the TQK mirror plane (γ )are computed. The derived parame-ters and their symbols are listed in Table 1 and the relation-ships between the target trajectory andβ,δandγ are shown graphically in Fig. 2.
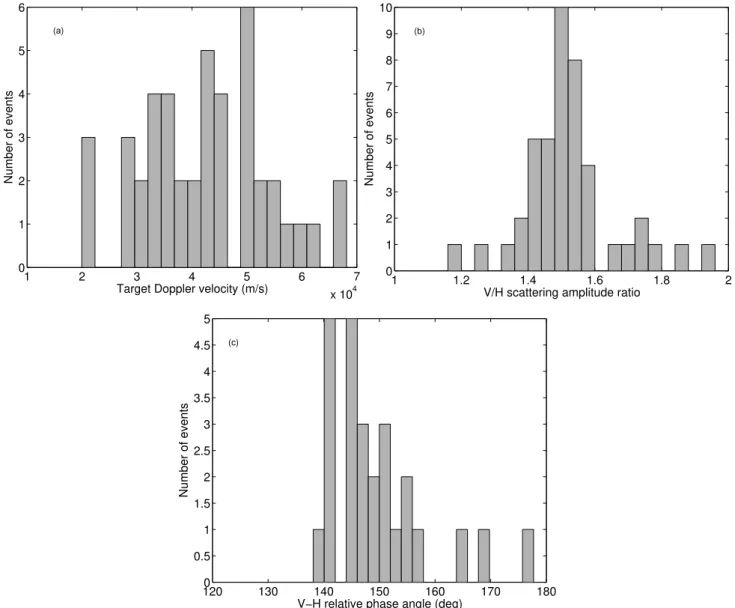
Figure 3 presents histograms of observed velocities (a), amplitude ratios (b) and V-H phase differences (c). The velocity distribution spans the range from 20 km s−1 to 68 km s−1. It does not show the clear bimodal characteris-tic seen in previous EISCAT UHF head echo observations (Kero et al., 2008a), but instead peaks broadly at about 40 km s−1, which is consistent with the distribution contain-ing only morncontain-ing-side data measured at a comparatively low altitude (96 km). The amplitude ratioρis very narrowly dis-tributed, peaking atρ=1.53±0.14; only three events exhibit an amplitude ratio deviating from the mean by more than 2σ. The phase distribution of the full dataset is surprisingly broad and not very informative, but when the two observing sessions are handled separately, things become clearer. The 7 October phase distribution (26 events) is found to be well-behaved and narrow, peaking atφ=(150.6±9.3) degrees. Two events deviate strongly from the mean, by respectively 1.8σ and 2.0σ; these are in fact two of the three amplitude ratio outliers!
1 2 3 4 5 6 7
x 104
0 1 2 3 4 5 6
Target Doppler velocity (m/s)
Number of events
(a)
1 1.2 1.4 1.6 1.8 2
0 1 2 3 4 5 6 7 8 9 10
V/H scattering amplitude ratio
Number of events
(b)
1200 130 140 150 160 170 180
0.5 1 1.5 2 2.5 3 3.5 4 4.5 5
V−H relative phase angle (deg)
Number of events
(c)
Fig. 3. Histograms showing(a)target Doppler velocities,(b)V/H scattering amplitude ratios and(c)V-H relative phase angles. (a)and
(b)show results from all 44 resolved events, while(c)shows only the 26 events from 7 October 2009.
shifted by some 46 degrees and the standard deviation in-creased to nearly three times the predicted value. A subse-quent investigation of the Kiruna receiver system suggests that these large changes are most probably the result of in-strumental drift and phase jitter suffered during the observing session, rather than indications of a physical process. Ac-cordingly, we have chosen to exclude the 8 October phase data from the data analysis. However, since phase fluctua-tions of the magnitude observed do not affect the Doppler velocity determination or the average V/H amplitude ratio, these 8 October quantities are retained in the analysis.
5 Discussion
5.1 Short timescale behaviour
The availability of synchronously sampled pairs of amplitude data from both linear polarizations allows us to study the fine structure of individual head echo events. On a pulse-to-pulse (millisecond) time scale, most events are found to be well behaved in the sense that the signal amplitudes trace out a quasi-Gaussian that replicates the shape of the spatial overlap of the Tromsø and Kiruna antenna beams. We interpret this as indicating that the targets have remained compact during the whole traversal of the beam overlap volume.
2.88 2.89 2.9 2.91 2.92 2.93 2.94 2.95
x 105 0
2000 4000 6000 8000 10000
12000 Sample voltage magnitude vs. time
Sample no.
Voltage magnitude: Green = V, blue = H
2.9038 2.904 2.9042 2.9044 2.9046 2.9048 2.905 2.9052 2.9054
x 105 0
1000 2000 3000 4000 5000 6000 7000 8000 9000 10000
Sample voltage magnitude vs. time
Sample no.
Voltage magnitude: Green = V, blue = H
2.9038 2.904 2.9042 2.9044 2.9046 2.9048 2.905 2.9052
x 105 0
0.5 1 1.5 2 2.5 3
V/H amplitude ratio vs. time
Sample no.
AV/AH
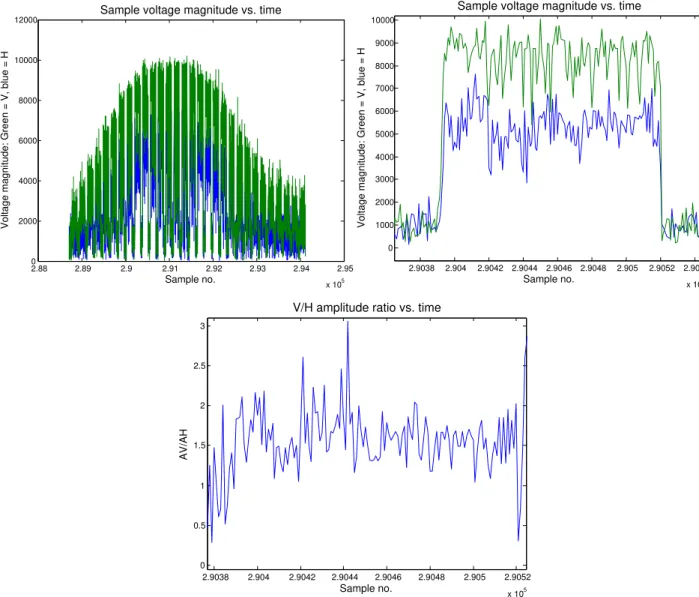
Fig. 4. Showing the passage of a typical head echo target through the common scattering volume at Q in 0.6-µs time resolution. Panel(a)shows the full event in raw amplitude format. The time interval between successive radar pulses is 1656 µs and the event lasts for 30 pulses or about 50 ms (the first four pulses are not shown). Panel(b)shows the development of the scattered signal during a single 76.8 µs radar pulse (pulse number 10, counting from the left). Panel(c)shows the V-H amplitude ratio during the same pulse.
section. This procedure is justified and necessary because of an effect illustrated by Fig. 4a, which shows a typical, fairly strong event in which the variances of both the V and the H amplitude signals are more than twice as high as the noise baseline variance and therefore dominate the total variance. Inspecting the return from an individual radar pulse in full 0.6-µs time resolution (Fig. 4b and c) we see that even though both the V and the H signals are strong, the amplitude ratio varies randomly around a mean value of about 1.5 with at least one interval exceeding 1.9 and another dipping to about 1.35 for several consecutive samples each. This shows that the scattering process is essentially stochastic on a microsec-ond time scale, such that the concept of echo polarization is only meaningful in an average sense.
5.2 The main population – isotropic scattering
0 10 20 30 40 50 60 70 80 1.1
1.2 1.3 1.4 1.5 1.6 1.7 1.8 1.9 2
V/H amplitude ratio
Angle β between target trajectory and magnetic field (deg) < 1σ
1σ..2σ
> 2σ
(a)
0 20 40 60 80 100
1.1 1.2 1.3 1.4 1.5 1.6 1.7 1.8 1.9 2
V/H amplitude ratio
Angle δ between target trajectory and vertical (deg) < 1σ
1σ..2σ
> 2σ (b)
−20 0 20 40 60 80
1.1 1.2 1.3 1.4 1.5 1.6 1.7 1.8 1.9 2
V/H amplitude ratio
Angle γ between target trajectory and TQK mirror plane (deg) < 1σ
1σ..2σ > 2σ
(c)
1 2 3 4 5 6 7
x 104 1.1
1.2 1.3 1.4 1.5 1.6 1.7 1.8 1.9 2
V/H amplitude ratio
Target speed (m/s) < 1σ
1σ..2σ > 2σ
(d)
100 101 102
1 1.1 1.2 1.3 1.4 1.5 1.6 1.7 1.8 1.9 2
V/H amplitude ratio
Signal power < 1σ
1σ..2σ > 2σ
(e)
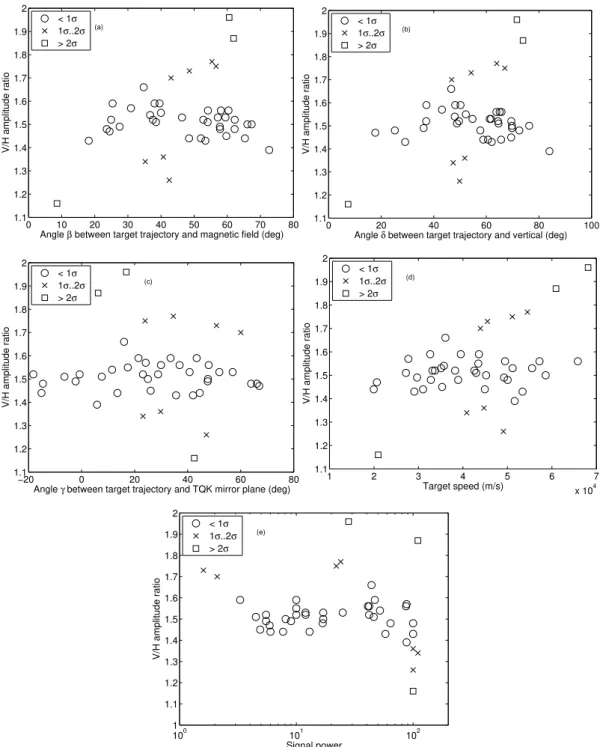
Fig. 5. Scatter plots of the relationships between the V/H amplitude ratioρ and five other derived target parameters, viz.(a)the angleβ
between target trajectory and magnetic field,(b)the angleδbetween target trajectory and vertical,(c)the angleγbetween target trajectory and the TQK mirror plane,(d)the target speedvand(e)the peak signal powerP.
was based only on total power measurements, it still implies that the scatterers must be close to isotropic and exhibit little or no polarization.
In order to test the isotropic scatterer hypothesis against our data, the relationships between the amplitude ratioρ, the phase angleφand the seven experimental observables listed in Table 1 have been investigated. Scatter plots ofρversus
Table 2. Statistical correlations betweenρand other observables, Student’s t-values and non-directional null hypothesis probabilities. All events included.
Variable Correlation t Non-directional null coefficient hypothesis probability
δ 0.387 2.687 0.010
β 0.329 2.231 0.031
γ −0.091 −0.585 0.560
pwr −0.294 −1.970 0.056
v 0.482 3.522 0.001
V −0.103 −0.663 0.511
H −0.218 −1.430 0.160
30 50 70 90 110 130 150 170
10 20 30 40 50 60 70 80 90
Azimuth (deg)
Elevation (deg)
Fig. 6.Scatter plot showing the distribution of the points of origin of the observed events in azimuth-elevation space. 0◦azimuth is due north, 90◦is due east and 180◦due south.
Normalizedρcorrelation coefficients, associated t-values and null hypothesis probabilities for the full dataset are listed in Table 2. The dependencies betweenρandδ,β, pwr and v are all seen to be statistically significant at the 5 % level. On the other hand,ρis seen to be only weakly dependent on the orientation of the trajectory relative to the directions of the V and H probes in the Kiruna antenna feed and clearly statistically independent ofγ.
Removing the three “+2σ” events from the dataset and repeating the exercise, the (ρ−β), (ρ−δ)and (ρ−v) cor-relations all drop to very low values, such that all dependen-cies betweenρ and the target geometry are no longer sta-tistically significant (Table 3). This demonstrates that theρ distribution of the 40-event head echo population contained in the (ρ=1.53±0.14) interval is essentially independent of target-radar geometry and target speed.
Figure 6 shows how the directions of arrival of the ob-served targets are distributed in azimuth-elevation space. The
Table 3. Same as Table 2 but with the three>2σ outlier events removed from the dataset.
Variable Correlation t Non-directional null coefficient hypothesis probability
δ 0.084 0.520 0.60
β 0.068 0.420 0.68
γ 0.066 0.408 0.68
pwr −0.441 −3.030 0.004
v 0.197 1.239 0.22
V −0.042 −0.259 0.80
H −0.162 −1.012 0.32
Table 4. Statistical correlations betweenφand other observables, Student’s t-values and non-directional null hypothesis probabilities for the 7 October events.
Variable Correlation t Non-directional null coefficient hypothesis probability
δ −0.301 −1.546 0.135
β −0.239 −1.206 0.240
γ −0.377 −1.994 0.058
pwr 0.701 4.815 0.000
v −0.175 −0.871 0.392
V 0.452 2.482 0.020
H 0.439 2.394 0.024
distribution is fairly uniform over a solid angle slice from 50◦to 160◦azimuth, covering about one-third of the visible
hemisphere. Referring to Fig. 5c, we find that the associ-ated aspect angles at Kiruna range from−20◦to 70◦– but more than two-thirds of the echoes still display V/H ampli-tude ratios within±10 % of the observed mean,ρobs,mean= 1.53. The observed amplitude ratio is clearly almost in-dependent of the direction of arrival and aspect angle, in good agreement with the isotropic target hypothesis. It is slightly greater than the theoretically predicted V/H ampli-tude ratio for isotropic scattering in a TQK bistatic geometry, ρiso=1.36, but the fact that the observed values are so nar-rowly clustered around ρobs,mean with a standard deviation of only 0.14 suggests that the 1.2σ difference is an experi-mental bias, caused by the transmitted signal being slightly elliptically polarized rather than accurately circular. Recall-ing that the Tromso system can in fact transmit any arbitrary polarization, this is an entirely plausible hypothesis; in fact, it would only take an admixture of 0.4 % (−24 dB) RHC to explain the observed discrepancy!
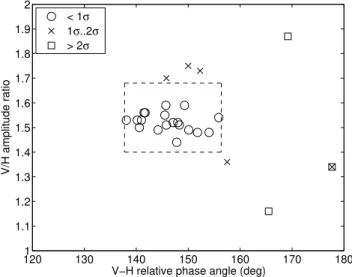
1201 130 140 150 160 170 180 1.1
1.2 1.3 1.4 1.5 1.6 1.7 1.8 1.9 2
V/H amplitude ratio
V−H relative phase angle (deg) < 1σ
1σ..2σ
> 2σ
Fig. 7.Scatter plot showing the distribution of the 7 October 2009 events inρ−φspace. Most events show essentially the same V/H amplitude ratio andEV−EHphase difference irrespective of direc-tion of arrival and aspect angle; 19 events out of a total of 26 are clustered within less than 0.11 units fromρmeanand less than 10◦ fromφmean.
andβandvare also fairly significant. Interestingly, all these correlations remain at about the same level of significance even after removing the two “+2σ” events from the dataset.
However, with a standard deviation of only 9.3 degrees (i.e. less than 3 % of a full period) the phase distribution is very narrow indeed, which further strengthens the case for isotropy. Figure 7 shows how the 7 October events are dis-tributed inρ−φspace. Of the 26 resolved tristatic events, 19 are clustered within (ρmean±σρ,φmean±σφ)! Three events
deviate by a little more in amplitude ratio (up to 1.5σρ)but at
the same time they are within 0.5σφof the mean phase. Only
three events are genuine outliers. Thus 90 % of the target re-turns show essentially the same V/H amplitude ratio and the sameEV−EHphase difference, independent of direction of arrival and aspect angle.
The only explanation consistent with these results is that a majority of the observed head echo targets do indeed scatter isotropically and impart no target-specific polarization sig-nature to the scattered signal regardless of aspect angle. For that to be the case, the effective size of the scatterers must be in the Rayleigh regime, i.e. much smaller than half the radar wavelength (0.16 m), in good agreement with earlier estimates of 930-MHz effective target cross sections (Kero et al., 2008a, b).
In this context, we note that the strongly significant corre-lations between signal power andρ andφcannot very well be manifestations of a target-related process. For that to be the case, such a cross-section-dependent process would have to be spatially isotropic but at the same time also control the amplitudes and phases of the signals received on the V and
H probes, which are fixed in the lab system. This is a self-contradiction. Instead, we interpret these correlations as sig-natures of a systematic experimental error, probably caused by differential non-linearity in the two analogue channels of the Kiruna receiver as the echo signal amplitudes approach the upper limit of the receiver dynamic range.
5.3 The outliers – polarized echoes
As explained in Sect. 3, radar returns with V/H amplitude ratios much greater or smaller than the isotropic scattering value are clear signatures of target polarization. Our dataset contains three such events, whose amplitude ratios deviate by more than plus or minus 2σρfrom the mean/isotropic value,
viz.ρ=1.87,ρ=1.96 andρ=1.16.
Referring to Fig. 5b and c, we note that the trajectories of the two high-ρevents are very close to the horizontal and the TQK bistatic mirror plane, while the trajectory of the low-ρ event is very close to the vertical and the magnetic field. Since the H probe of the Kiruna antenna is approximately parallel to the horizontal through Q, these measured V/H amplitude ratios can be directly interpreted in terms of the ratio of the transverse and longitudinal cross sections. The high-ρ events, whose trajectories are close to parallel to the H probe direction, show vertical amplitudes that exceed the isotropic value by 22 and 28 %, while the low-ρevent, which is almost orthogonal to the H probe, shows about 32 % ex-cess horizontal amplitude. These observations demonstrate that some head echo targets do in fact show signs of polar-ization, but the effects are relatively weak and only likely to be noticed when the targets are observed under close to opti-mal conditions to begin with, i.e. in a geometry approaching the classical normal incidence trail echo case or in the same plane as one of the receiver antenna probes.
In all three cases, the effective transverse-to-trajectory scattering cross section is 50–70 % greater than the longitudinal-to-trajectory cross section. This is surprisingly similar to the classical transverse cross section enhance-ment effect first predicted by Herlofson (1951), experimen-tally verified in trail echo experiments in the 1950s (Clegg and Closs, 1951; Billam and Browne, 1956; Greenhow and Neufeld, 1956), revisited by numerical methods in 1968– 1969 (Lebedinec and Sosnova, 1967) and more recently dis-cussed in the context of oblique scattering by Jones and Jones (1991); the observed enhancement is in the right direction and the magnitude is of the right order.
The classical transverse cross section enhancement effect is caused by a charge-separation plasma resonance, which can be excited in bounded plasma. In the classical meteor trail case the required boundary conditions are fairly well met in the radial direction at early times, when the plasma has just expanded to the initial radiusr0. For underdense trails the effect maximises as the plasma dielectric on the trail axis goes throughεpl≈ −1.4 (Kaiser and Closs, 1952). The
(a)
(b)
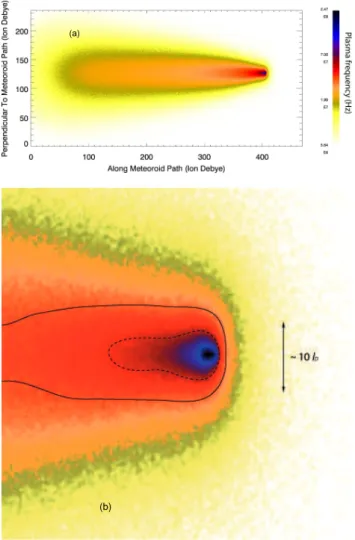
Fig. 8. Results from a simulation of early time meteor plasma, reproduced from Dyrud et al. (2007) by permission. The meteor simulated here was moving against the surrounding atmosphere at 40 km s−1, i.e. at about the average speed of our event popula-tion, and was producing 1012 ions/meter. The axes are in units of local ion Debye lengthlD; in the ionosphere near 96 km al-titudelD is of the order of 0.5. . . 1 cm. The electron densityne is represented in terms of equivalent plasma frequency: orange
↔ne≈5×10¹³m−3, violet↔ne≈6×10¹⁴m−3and black↔
ne≈7.5×10¹⁵m−3. Part(a)shows the plasma density distribution out to 400lDbehind the meteoroid, while panel(b)is a magnifica-tion of the region in the immediate vicinity of the meteoroid; the full contour line corresponds tone≈2×10¹⁴m−3.
radially confined tor0< λrad/2π, but as the plasma expands to larger radii it will be progressively suppressed by radiative damping.
r0 is defined as the rms transverse separation of the me-teor atoms from the parent meme-teor trajectory at the point where they have reached themal equilibrium with the neu-trals. Estimates of r0 range from three neutral free paths or about 16 cm at 96 km altitude (Manning, 1958) to more than one metre ( ¨Opik, 1958; Bronshten, 1983).
Thermalisa-tion is often taken to be complete after about ten collisions or (2...8)×10−4s at 95 km altitude and 40 km s−1 meteor speed. At this time the trail is already several tens of me-ters long, so the boundary conditions necessary for the res-onance to be excited are not present in the lengthwise direc-tion and no cross secdirec-tion enhancement will occur for a wave with E-field vector parallel to the trail. Accordingly, all the early attempts to observe the plasma resonance effect experi-mentally (Clegg and Closs, 1951; Billam and Browne, 1956; Greenhow and Neufeld, 1956) were made at wavelengths in the (4–6 m) range, such thatλrad/2π≥0.64 m, and transverse cross section enhancement was indeed observed.
By contrast, the three polarized events discussed here have been recorded at a wavelength of 0.33 m, such thatλrad/2π= 5.3×10⁻²m or less than one-third ofr
0at the interaction al-titude. They are similar to the generic head echo in most aspects: they are instantaneous, their cross sections are in the order of at most a few times 10−4m2and no traces of a trail echo can be detected. This implies that the characteris-tic size of the effective plasma target is in the order of a few centimetres, in accordance with the cross section data pre-viously reported by e.g. Kero et al. (2008b). However, the clear signatures of transverse polarization indicate that these targets do not scatter isotropically, the most likely explana-tion being that the plasma distribuexplana-tion immediately behind the meteoroid is non-spherical with a transverse extent small enough to sustain a (λrad=0.33 m) plasma resonance.
The currently best available data on the development of meteor plasma at very early times is probably Dyrud et al. (2007). A subpart of their Fig. 3, which presents re-sults from a numerical simulation of plasma generated by a 40 km s−1meteor producing 1012electrons m−1, is repro-duced by permission here as Fig. 8. We see that the plasma distribution in the immediate vicinity of the meteoroid is drop-shaped and elongated along the trajectory. Next to the meteoroid thefpl=4.0×10⁷Hz isodensity contour falls at a
radial distance of about ten Debye lengths or 5.0. . . 10.0 cm, but in the tailward direction the same isocontour extends to more than thirty Debye lengths or 15. . . 30 cm behind the me-teoroid (Debye lengths in the ionosphere near 100 km alti-tude are of the order of 0.5. . . 1 cm). Assuming a larger me-teoroid producing several times 1013e−m−1and further as-suming that the head plasma generated by this meteor would develop in approximately the same way as in Fig. 8, the plasma should be marginally able to sustain a charge sepa-ration resonance at 930 MHz in the transverse direction, but in the longitudinal direction the resonance would be more strongly damped, leading to a relative enhancement of the transverse cross section in qualitative agreement with our ob-servations. Collisional damping would be insignificant for either polarization since the EISCAT UHF frequency is more than two orders of magnitude higher than the plasma-neutral collision frequency.
targets are actually anisotropic to some degree. Since the above analysis demonstrates that transverse charge separa-tion plasma resonance in the plasma cloud moving with the ablating meteoroid is possible, this could give reason for con-cern when attempting to derive meteor size and mass from observed head echo cross sections. But our observations in-dicate that, at least at 930 MHz, resonant cross section en-hancement only seems to be observable when the meteor tra-jectory is either within some 15ofrom normal to the scatter-ing vector, i.e. close to Bragg conditions, or close to the ver-tical. Most events will therefore be unaffected and appear as isotropic targets, in excellent agreement with the conclusions from previous head echo aspect sensitivity studies (Dyrud et al., 2007; Kero et al., 2008b).
It is also interesting to note that close-in polarization ef-fects may only be readily detectable at frequencies in the (800–1600) MHz range. If the Fig. 8 plasma were illumi-nated at 422 MHz (ALTAIR), longitudinal damping would only just begin to set in, such that some resonant longitu-dinal cross section enhancement would also be present – but this would reduceρ and make the target look closer to isotropic. Conversely, at wavelengths much less than 20 cm even the transverse charge separation resonance would be damped out.
6 Summary and conclusions
This paper presents the first-ever direct measurements of the polarization of 930-MHz radar meteor head echoes, per-formed with the tristatic EISCAT UHF radar system in an oblique scattering geometry. Amplitudes and phases of two orthogonal, linearly polarized components (V and H) of head echo signals recorded with the Kiruna UHF receiver have been used to determine the V/H amplitude ratio and (V-H) phase difference and both quantities have then been corre-lated with the target aspect angle, 3-D target velocities and a range of other parameters.
While the 44 analysed events are relatively uniformly spread over one-third of the visible hemisphere, more than 90 % of them still show essentially the same amplitude ra-tio and phase difference that would have been observed if the radar target had instead been an incoherent plasma. No significant correlation is found to exist between the observed amplitude ratio and phase difference and target aspect angle, direction of arrival and echo strength.
Only three events, two of which are observed under close to Bragg conditions and the third coming in on an almost vertical trajectory, show clear signatures of polarization. In all three cases, the effective transverse-to-trajectory scatter-ing cross section is 50–70 % greater than the longitudinal cross section. We propose that this could be a signature of a transverse charge-separation resonance in the plasma im-mediately behind the meteoroid, similar to the classical trail echo transverse cross section enhancement first discussed
and observed in the 1950s. We show that the densest part of the ablated plasma column is small enough to support a transverse plasma resonance at the EISCAT UHF frequency, 930 MHz and note that the effect may only be readily ob-servable over a relatively narrow range of wavelengths that includes the EISCAT UHF but not ALTAIR and other low-UHF systems.
We conclude that a majority of the tristatic high-SNR head echoes observed by us appear isotropic in backscatter. This suggests that, at least at 930 MHz, strong and compact (i.e. non-fragmenting) head echo events can in general be safely assumed to represent isotropic scatterers, in good agreement with previous polarization work at 422 MHz and EISCAT UHF cross-section vs. aspect angle studies. We postulate that this also holds true for compact low-SNR targets, such that polarization effects should not play a significant role when deriving meteoroid sizes and masses from the observed head echo radar cross sections.
Acknowledgements. We thank the EISCAT staff and Markku Pos-tila, Sodankyl¨a Geophysical Observatory, for their assistance during the experiments. We also thank the referees for valuable comments. EISCAT is supported by China (CRIPR), Finland (SA), Germany (DFG), Japan (NIPR and STEL), Norway (NFR), Sweden (VR) and the UK (NERC).
Topical Editor P.-L. Blelly thanks J. Fentzke and another anony-mous referee for their help in evaluating this paper.
References
Billam, E. R. and Browne, I. C.: Characteristics of radio echoes from meteor trails IV: Polarization effects, P. Phys. Soc. B, 69, 98–113, 1956.
Bronshten, V. A.: Physics of meteoric phenomena, ISBN 90-277-1654-4, D. Reidel Publishing Company, Dordrecht, 1983. Clegg, J. A. and Closs, R. L.: Plasma oscillations in meteor trails,
P. Phys. Soc. B, 64, 718–719, 1951.
Close, S., Hunt, S., Minardi, M. J., and McKeen, F. M.: Meteor Shower Characterization at Kwajalein Missile Range, Lincoln Laboratory Journal, 12, 33–44, 2000.
Close, S., Oppenheim, M., Hunt, S., and Dyrud, L.: Scattering characteristics of high-resolution meteor head echoes detected at multiple frequencies, J. Geophys. Res.-Space, 107, 9-1. . . 9-12, doi:10.1029/2002JA009253, 2002.
Close, S., Kelley, M., Vertatschitsch, L., Colestock, P., Oppen-heim, M., and Yee, J.: Polarization and scattering of a long-duration meteor trail, J. Geophys. Res.-Space, 116, A01309, doi:10.1029/2010JA015968, 2011.
Dyrud, L., Wilson, D., Boerve, S., Trulsen, J., Pecseli, H., Close, S., Chen, C., and Lee, Y.: Plasma and electromagnetic wave simulations of meteors, Adv. Space Res., 42, 136–142, doi:10.1016/j.asr.2007.03.048, 2007.
Greenhow, J. S. and Neufeld, E. L.: Phase changes and resonance effects in radio echoes from meteor trails, P. Phys. Soc. B, 69, 1069–1076, 1976.
Herlofson, N.: Plasma resonance in ionospheric irregularities, Ark. Fys., 3(15), 247–297, 1951.
Hogan, R. J., Field, P. R., Illingworth, A. J., Cotton, R. J., and Choularton, T. W.: Properties of embedded convection in warm-frontal mixed-phase cloud from aircraft and polarimetric radar, Q. J. Roy. Meteorol. Soc., 128, 451–476, 2002.
Illingworth, A. J.: Improved Precipitation rates and data quality by using polarimetric measurements, in: Advanced Applications of Weather Radar, Springer-Verlag, 2003.
Jones, R. C.: A new calculus for the treatment of optical systems, I. Description and Discussion of the Calculus, J. Opt. Soc. Am., 31(7), 488–493, doi:10.1364/JOSA.31.000488, 1941.
Jones, J. and Jones, W.: Oblique–scatter of radio waves from meteor trains: full-wave calculations, Planet. Space Sci., 39(9), 1289– 1296, 1991.
Kaiser, T. R. and Closs, R. L.: Theory of radio reflections from meteor trails I, Philos. Mag., 43, 1, 1952.
Kero, J., Szasz, C., Pellinen-Wannberg, A., Wannberg, G., West-man, A., and Meisel, D. D.: Determination of meteoroid phys-ical properties from tristatic radar observations, Ann. Geophys., 26, 2217–2228, doi:10.5194/angeo-26-2217-2008, 2008a.
Kero, J., Szasz, C., Wannberg, G., Pellinen-Wannberg, A., and Westman, A.: On the meteoric head echo radar cross sec-tion angular dependence, Geophys. Res. Lett., 35, L07101, doi:10.1029/2008GL033402, 2008b.
Lebedinec, V. N. and Sosnova, A. K.: Radio reflections from meteor trails, Physics and Dynamics of Meteors, IAU Symposium no. 33, Tatranska Lomnica, Czechoslovakia, 4–9 September 1967, pp. 27–44, D. Reidel, Dordrecht, 1967.
Manning, L. A.: The initial radius of meteoric ionization trails, J. Geophys. Res., 63, 181–196, 1958.
¨
Opik, E. J.: Physics of meteor flight in the atmosphere, LCC 58-12727, Interscience Publishers, Inc., New York, 1958.
Raghawan, S.: Radar Meteorology, ISBN 1-4020-1604-2, pp. 153– 160, Kluwer Academic, 2003.