Vol.52, n. 3: pp. 755-764, May-June 2009
ISSN 1516-8913 Printed in Brazil BRAZILIAN ARCHIVES OF
BIOLOGY AND TECHNOLOGY
A N I N T E R N A T I O N A L J O U R N A L
Limnological Patterns in Northern Pantanal Lagoons
Monica Elisa Bleich, Roberto Moraes Lima Silveira
*and Flávia Maria Barros Nogueira
Instituto de Biociências; Universidade Federal de Mato Grosso; Cuiabá - MT - BrasilABSTRACT
The aim of this work was to correlate the limnological patterns recorded among ten lagoons in the northern part of the Pantanal of Mato Grosso with some aspects of the lagoons related to their physical and biological characteristics. Some lagoon characteristics, such as connection with the river and the presence of floating macrophytes were important to group similar lagoons into categories. Attempts were also made to determine which kind of the nutrients could be limiting phytoplankton productivity in the lagoons of the northern Pantanal. Data was collected in nine lagoons during the flooding stage in January 2004, and nutrient and chlorophyll a was followed in a tenth lagoon from June 2004 to October 2004. The phytoplankton biomass was significantly associated with the nitrogen concentration during the flooding and drought periods. All the studied lagoons were potentially limited by the nitrogen concentration with a strong negative relationship between the chlorophyll a biomass and ammonium concentration during the drought season. The drought season also had nearly three times more chlorophyll a biomass when compared to the flooding period.
Key words: Nutrient, Lagoon, Pantanal, Phytoplankton
*Author for correspondence: [email protected]
INTRODUCTION
The temporal variation of the physical, chemical, and biotic factors in the river-flood plain systems in the tropical regions is mainly associated with the changes in the hydrometric levels. The pronounced temporal variations have been observed, and ecological and limnological processes were controlled by the flooding pulse (Junk, 1980; Junk et al., 1989; Putz and Junk, 1997).
Flooding favors the homogenization of the limnological characteristics of the marginal lagoons, since all of them are close to the river and are periodically flooded in the same period by the waters from the same source (Carvalho et al., 2001). However, some physical and biological
As a first step for an understanding of the possible limnological patterns in the lagoons of the Northern Pantanal, a detailed analysis was adopted of the fate of nutrients. The objective was to verify whether the limnological patterns could be related to the physical characteristics of the marginal lagoons located on the Cuiabá River flood plain, and to determine what type of the nutrient was limiting to the primary producers. These are facts about the fate of the nutrients in the Pantanal, characterized by high concentrations in the drought period and later dilution during the flood period (Heckman, 1994; 1998; Da Silva and Esteves, 1995; Pinto-Coelho and Greco, 1999;
Carvalho et al., 2001; Nogueira et al., 2002; Abdo
et al., 2004).There is the hypothesis of a possible limitation in the primary productivity by the nitrogen, as observed by Trevisan (2001) and Takamura et al. (2003) in the lakes.
In addition to increasing the scientific knowledge about the river-flood plain systems in the Northern Pantanal of Mato Grosso, the establishment of such limnological patterns and the indication of the nutrients that limit primary producers could also be useful for the management of the marginal lagoons under study, which are located in a conservation unit used for the controlled tourism.
MATERIALS AND METHODS
The data were collected in the lagoons located in an area belonging to the Ecological Station SESC Pantanal, comprising leisure and lodging infra-structure (Parque Baía das Pedras), next to a natural reservation area, recently certified as Reserva Particular de Patrimônio Natural (RPPN – Private Natural Heritage Reserve). Ten marginal lagoons, connected or not with the main channel, were selected on a stretch of approximately 75 km along the Cuiabá River, running on the west border of the RPPN. Three of the lagoons studied were located in the area of Parque Baía das Pedras (Baía Aguapé, Baía Desassoreada, and Baía Biguá), on the right bank of the Cuiabá River. The other seven lagoons selected (Baía Cambará, Baía Biueiro, Baía Assombrada, Baía do Ribeirão, Baía Boa, Baía do Mané, and Lagoa Santa Rosa) are located in the RPPN on the left bank.
The influence of the Cuiabá River on the limnological characteristics of the lentic and lotic
systems associated with it took place by its flooding. The flooding of the adjacent areas established the communication of the river with some lagoons by the means of the channels in the very beginning of the flooding period. During the drought period, these channels dryed up completely or maintained stretches with the stagnant water. The plant cover in the area was a cerrado with various vegetation physiognomies in the areas either subject to flooding or not (Da Silva et al., 2000). The fauna was diversified and abundant, including the occurrence of endangered species (Da Silva et al., 2001). The shallow and poor soils occurred in an active sedimentary plain, resulting from the alluvial spreading of the quaternary sediments (Sánchez, 1992; Assine and Soares, 2004). The hot and semi-humid climate reflects the seasonal condition of the rains and droughts, typical of the Pantanal. A pronounced drought season occurred from May to September, with a rainy season from October through April. During the drought period, a shift occurred from aquatic to terrestrial habits in many places (Heckman, 1994); intermediate flooding and ebbing seasons also occurred. The mean monthly temperature around Cuiabá ranged from a maximum of 27.4 °C in December to a minimum of 21.4 °C in July.
The ten marginal lagoons studied were selected based on the current images of the region (Landsat TM), and those with easier access were given
priority. The sampled lagoons were grouped into
three main sets, considering their physical characteristics. The first set was formed by the lagoons that remained temporarily connected with the river and presented aquatic macrophytes (Aguapé, Boa, do Ribeirão, and Santa Rosa). The second set was represented by the lagoons isolated from the main channel, and showing aquatic macrophytes (Biguá, Biueiro, Cambará, do Mané, and Desassoreada); the third consisted of the lagoons isolated from the river without aquatic macrophytes (Assombrada) (Fig. 1). The most commonly observed aquatic macrophytes in the lagoons studied were Eichhornia crassipes Mart., Eichhornia azurea (Sw.) Kunth, Salvinia auriculata Aubl., Azzola sp., and Lemna valdiviana Phil.
Pantanal. The objective of the first stage was to determine the existence of the limnological patterns among nine out of the ten lagoons selected, besides a possible relation between the
concentration of the nutrients and the
concentration of chlorophyll a. The information
was obtained with three replicates at a central point of each lagoon in the morning on the surface of the water column.
Desassoreada Lagoon
Bigu Lagoon Aguap é Lagoon
Biueiro Lagoon
Mané Lagoon
Boa Lagoon
Assombrada Lagoon
Ribeirão Lagoon N
56° 30’
56 °30 ’ 56 °21 ’
56 °21’ 16°29’ 16°29’
16°45’ 16 °45 ’
Santa Rosa Lagoon
RPPN S ESC Pantanal
Cambará Desassoreada Lagoon
á Lagoon Aguap é
Biueiro Lagoon
Mané Lagoon
Boa Lagoon
Assombrada Lagoon
Ribeirão Lagoon N
2000 m 4000 m Scale
56° 30’
56 °30 ’ 56 °21 ’
56 °21’ 16°29’ 16°29’
16°45’ 16 °45 ’
Santa Rosa Lagoon
RPPN S ESC Pantanal
Santa Rosa Lagoon
RPPN S ESC Pantanal
Cambará Cambará Lagoon
Brazil
Panta nal
Figure 1 - Spatial distribution of the ten lagoons studied in the Estância Ecológica SESC Pantanal in northern Pantanal (from SESC – Pantanal, Private Biological Reserve).
Samplings in the second stage were made in only one of the ten lagoons selected, known as Santa Rosa lagoon. The objective was to confirm the type of limiting nutrient by tracking the nutrient concentration process during the drought season
and observing the phytoplankton chlorophyll a
response to that concentration. In order to track the chlorophyll a response, a temporal analysis of
chlorophyll a concentrations was made, since it
was an effective instrument in indicating the relation between the amount of the nutrients that entered a water body and primary producers response to the inflow of the nutrients (Wetzel, 2001). Information was obtained with three replicates in the lagoon on the surface in the
morning and the sampling was made every two weeks.
In both the stages the water column depth (m) in the field for all the samples was determined with a graded rope. The water transparency (m) was determined with Secchi’s disk; the electric conductivity (µS.cm-1), pH and dissolved oxygen
(mg.L-1) were determined with the specific
electrodes (WTW LF 340, Lutron DO-5510, and Lutron pH-206, respectively). The water
temperature (oC) was determined with a thermistor
connected to a conductivity meter. A Van
analyses were carried out in the laboratory in non-filtered aliquots the dissolved nutrients analyses were made in aliquots filtered through Schleicher and Schuell GF 52-C fiber glass filters. These filters were used to determine the concentration of the nutrients in the suspension and the concentration of the chlorophyll a.
Orthophosphate (mg.L-1) and suspended
phosphorus concentrations (mg.L-1) were
determined by the ascorbic acid method (APHA, 1998), after digestion with lithium sulfate, selenium, hydrogen peroxide, and sulfuric acid
(Allen, 1989); total phosphorus (mg.L-1) was
determined according to Mackereth et al. (1978).
Ammonia (mg.L-1) and suspended nitrogen
concentration (mg.L-1) was determined using the
phenate method (APHA, 1998) after digestion
according to Allen (1989); total nitrogen (mg.L-1)
was determined using a Multi N/C, Analitik Jena
AG device. The material in the suspension (mg.L
-1) was quantified according to Teixeira et al.
(1965), and chlorophyll a concentration (µg.L-1)
was determined after extraction with ethanol (90%) heated to 80°C according to Nush (1980). The results obtained in the first sampling stage were analyzed by the Principal Components Analysis (PCA) to verify whether the nine lagoons would be clustered into limnological categories,
and if these categories could be related to the physical characteristics of the lagoons, as previously described. In addition, the PCA analysis helped to explore the relationship between the concentration of the phytoplankton biomass (chlorophyll a) and concentration of the nutrients
in the water. The data used in the analysis were those of concentration of the nutrients, suspended material, and chlorophyll a.
The results obtained for the Santa Rosa lagoon, in the second sampling stage, were logarithm transformed (log10 (x +1)), where x corresponded
to the actual value of the concentration obtained in the laboratory. The chlorophyll a data were later
analyzed by the Stepwise Multiple Regression against all other nutrient variables. The statistical analyses were performed using the Systat software (Wilkinson, 1990).
RESULTS
The nine lagoons sampled in the first stage of the work demonstrated to be very shallow, with high transparency and low concentrations of the
nutrients and chlorophyll a. The waters were
slightly acidic and showed low dissolved oxygen concentration (Tables 1 and 2).
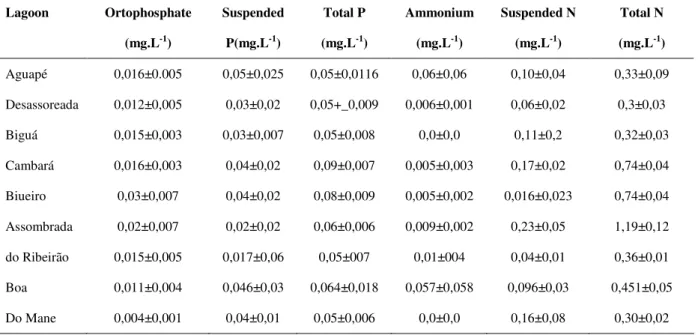
Table 1 - Mean values and standard deviation of nutrients dissolved in water of the nine Lagoons sampled during the flooding period.
Lagoon Ortophosphate
(mg.L-1)
Suspended
P(mg.L-1)
Total P
(mg.L-1)
Ammonium
(mg.L-1)
Suspended N
(mg.L-1)
Total N
(mg.L-1)
Aguapé 0,016±0.005 0,05±0,025 0,05±0,0116 0,06±0,06 0,10±0,04 0,33±0,09
Desassoreada 0,012±0,005 0,03±0,02 0,05+_0,009 0,006±0,001 0,06±0,02 0,3±0,03
Biguá 0,015±0,003 0,03±0,007 0,05±0,008 0,0±0,0 0,11±0,2 0,32±0,03
Cambará 0,016±0,003 0,04±0,02 0,09±0,007 0,005±0,003 0,17±0,02 0,74±0,04
Biueiro 0,03±0,007 0,04±0,02 0,08±0,009 0,005±0,002 0,016±0,023 0,74±0,04
Assombrada 0,02±0,007 0,02±0,02 0,06±0,006 0,009±0,002 0,23±0,05 1,19±0,12
do Ribeirão 0,015±0,005 0,017±0,06 0,05±007 0,01±004 0,04±0,01 0,36±0,01
Boa 0,011±0,004 0,046±0,03 0,064±0,018 0,057±0,058 0,096±0,03 0,451±0,05
Table 2 - Mean values and deviation of limnological variables in the water of the nine lagoons sampled during the flooding period.
Lagoon Depth
(m)
Chlorophyll
A(µg.L-1)
Suspended Matter
(mg.L-1)
Transparency (m)
Dissolved Oxygen
(mgL-1)
Water Temperature
(0C)
Conductivity
(µS.cm-1) pH
Aguapé 4.0 11.2±1.5 9.5±3.2 0.71 1.1±0.01 29.8±0.01 61.1±0.4 6.7±0.01
Desassoreada 3.5 17.3±1.8 8.0±0.5 0.59 2.8±0.32 29.7±0.01 45.2±0.01 6.6±0.02
Biguá 3.4 11.4±1.3 12.3±0.3 0.52 2.0±0.01 31.7±0.06 48.6±0.01 6.7±0.03
Cambará 1.2 15.6±2.3 8.2±0.6 0.61 1.9±0.01 30.2±1.8 49.8±0.03 6.5±0.08
Biueiro 1.4 22.9±5.1 9.7±0.4 0.57 1.9±0.04 32.3±1.2 47.2±0.03 6.5±0.02
Assombrada 1.8 25.8±3.5 18.8±2.6 0.49 1.2±0.02 32.1±0.01 48.6±0.01 7.3±0.01
do Ribeirão 3.0 6.3±1.9 13.1±0.2 0.45 2.2±0.52 31.2±0.5 51.2±0.01 6.9±0.02
Boa 3.6 14.8±2.2 10.6±0.1 0.62 1.6±0.01 33.5±0.6 66.5±0.8 6.5±0.05
do Mané 3.5 19.3±2.7 8.5±0.2 0.71 1.3±0.02 30.9±0.01 54.8±0.01 6.2±0.07
Chlorophyll a concentration was negatively
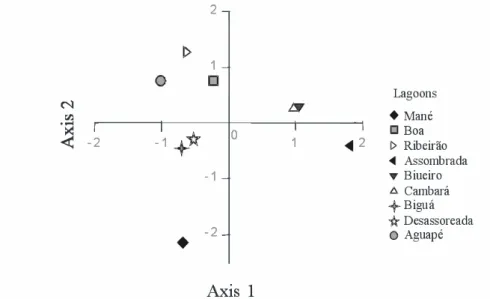
correlated with the water level. In the PCA analysis result, the three axes considered represented 72.6% of all the data variability. A limnological cluster for the lagoons was obtained (Fig. 2) and a strong positive relationship between
the chlorophyll a and suspended nitrogen
concentration was observed.
This relationship was confirmed by the biweekly data obtained at the Santa Rosa lagoon in the second sampling stage. During the study period, the depth and transparency decreased. The water became warmer and more alkaline and the concentrations of the nutrients showed a tendency to increase; the same occurred with the chlorophyll
a concentration (Fig. 3).
With regard to data obtained during the second sampling stage at the Santa Rosa lagoon, the multiple regression analysis between the
chlorophyll a and nutrients, materials in the
suspension and depth (r2= 0.83, n= 54 standard
error = 0.07) also showed a significant positive
relationship between the chlorophyll a
concentration and orthophosphate concentration (p<0.001), total phosphorus (p<0.001) suspended nitrogen (p<0.03) and total nitrogen (p<0.001), and a significant negative relationship between the
chlorophyll a concentration and ammonia
concentration (p<0.001).
Figure 3 - Limnological variables of the drought period for Santa Rosa lagoon
0 10 20 30 40 50 60 70 80 90100110120 130 days 0.30 0.45 0.60 0.75 0.90 1.05 1.20 1.35 1.50 1.65 1.80 1.95 2.10 2.25 2.40 2.55 20 40 60 80 100 120 Depth Chlorophyll a D ep th (m ) C hl or op hy ll a (µ g/ L )
0 10 20 30 40 50 60 70 80 90100110120 130 days 0.30 0.45 0.60 0.75 0.90 1.05 1.20 1.35 1.50 1.65 1.80 1.95 2.10 2.25 2.40 2.55 20 40 60 80 100 120 Depth Chlorophyll a D ep th (m ) C hl or op hy ll a (µ g/ L )
0 10 20 30 40 50 60 70 80 90100110120 130 days 0.30 0.45 0.60 0.75 0.90 1.05 1.20 1.35 1.50 1.65 1.80 1.95 2.10 2.25 2.40 2.55 20 40 60 80 100 120 Depth Chlorophyll a D ep th (m ) C hl or op hy ll a (µ g/ L )
0 10 20 30 40 50 60 70 80 90100110120 130 days 0.30 0.45 0.60 0.75 0.90 1.05 1.20 1.35 1.50 1.65 1.80 1.95 2.10 2.25 2.40 2.55 20 40 60 80 100 120 Depth Chlorophyll a D ep th (m ) C hl or op hy ll a (µ g/ L )
0 10 20 30 40 50 60 70 80 90 100110 120130 days 40 50 60 70 80 90 100 5 6 7 8 9 10 p H Conductivity pH C on du ct iv it y (µ S/ cm )
0 10 20 30 40 50 60 70 80 90 100110 120130 days 40 50 60 70 80 90 100 5 6 7 8 9 10 p H Conductivity pH C on du ct iv it y (µ S/ cm )
0 10 20 30 40 50 60 70 80 90 100110 120130 days 40 50 60 70 80 90 100 5 6 7 8 9 10 p H Conductivity pH C on du ct iv it y (µ S/ cm )
0 10 20 30 40 50 60 70 80 90 100110 120130 days 40 50 60 70 80 90 100 5 6 7 8 9 10 p H Conductivity pH C on du ct iv it y (µ S/ cm )
0 10 20 30 40 50 60 70 80 90 100110 120130 days 2 3 4 5 6 7 8 20 24 28 32 36 (° C ) Dissolved oxygen Water temperature D is so lv ed ox yg en (m g/ L ) W at er te m pe ra tu re
0 10 20 30 40 50 60 70 80 90 100110 120130 days 2 3 4 5 6 7 8 20 24 28 32 36 (° C ) Dissolved oxygen Water temperature D is so lv ed ox yg en (m g/ L ) W at er te m pe ra tu re
0 10 20 30 40 50 60 70 80 90 100110 120130 days 2 3 4 5 6 7 8 20 24 28 32 36 (° C ) Dissolved oxygen Water temperature D is so lv ed ox yg en (m g/ L ) W at er te m pe ra tu re
0 10 20 30 40 50 60 70 80 90 100110 120130 days 2 3 4 5 6 7 8 20 24 28 32 36 (° C ) Dissolved oxygen Water temperature D is so lv ed ox yg en (m g/ L ) W at er te m pe ra tu re
0 10 20 30 40 50 60 70 80 90100110120130 days 0.010 0.100 0.010 0.100 Orthophosphate Ammonium O rt ho ph os ph at e (m g/ L ) A m m on iu m (m g/ L )
0 10 20 30 40 50 60 70 80 90100110120130 days 0.010 0.100 0.010 0.100 Orthophosphate Ammonium O rt ho ph os ph at e (m g/ L ) A m m on iu m (m g/ L )
0 10 20 30 40 50 60 70 80 90100110120130 days 0.010 0.100 0.010 0.100 Orthophosphate Ammonium O rt ho ph os ph at e (m g/ L ) A m m on iu m (m g/ L )
0 10 20 30 40 50 60 70 80 90100110120130 days 0.010 0.100 0.010 0.100 Orthophosphate Ammonium O rt ho ph os ph at e (m g/ L ) A m m on iu m (m g/ L )
0 10 20 30 40 50 60 70 80 90 100110 120130
days 0.2 0.4 0.6 0.8 0.2 0.4 0.6 0.8 Suspended Phosphorus Suspended Nitrogen 0 0 Su sp en de d P ho sp h or us (m g/ L ) S us pe nd ed N itr og en (m g/ L )
0 10 20 30 40 50 60 70 80 90 100110 120130
days 0.2 0.4 0.6 0.8 0.2 0.4 0.6 0.8 Suspended Phosphorus Suspended Nitrogen 0 0 Su sp en de d P ho sp h or us (m g/ L ) S us pe nd ed N itr og en (m g/ L )
0 10 20 30 40 50 60 70 80 90 100110 120130
days 0.2 0.4 0.6 0.8 0.2 0.4 0.6 0.8 Suspended Phosphorus Suspended Nitrogen 0 0 Su sp en de d P ho sp h or us (m g/ L ) S us pe nd ed N itr og en (m g/ L )
0 10 20 30 40 50 60 70 80 90 100110 120130
days 0.2 0.4 0.6 0.8 0.2 0.4 0.6 0.8 Suspended Phosphorus Suspended Nitrogen 0 0 Su sp en de d P ho sp h or us (m g/ L ) S us pe nd ed N itr og en (m g/ L
) Total Phosphorus
Total Nitrogen
0 10 20 30 40 50 60 70 80 90100110 120130 days 0.2 0.4 0.6 0.8 1.0 0.6 0.8 1.0 1.2 1.4 1.6 1.8 2.0 T o ta lP ho sp ho ru s (m g/ L ) T ot al N itr og en (m g/ L) Total Phosphorus Total Nitrogen
0 10 20 30 40 50 60 70 80 90100110 120130 days 0.2 0.4 0.6 0.8 1.0 0.6 0.8 1.0 1.2 1.4 1.6 1.8 2.0 T o ta lP ho sp ho ru s (m g/ L ) T ot al N itr og en (m g/ L) Total Phosphorus Total Nitrogen
0 10 20 30 40 50 60 70 80 90100110 120130 days 0.2 0.4 0.6 0.8 1.0 0.6 0.8 1.0 1.2 1.4 1.6 1.8 2.0 T o ta lP ho sp ho ru s (m g/ L ) T ot al N itr og en (m g/ L) Total Phosphorus Total Nitrogen
DISCUSSION
The cluster yielded by the PCA analysis (Fig. 2) indicated that the limnological patterns were
related to the physical and biological
characteristics of the marginal lagoons studied, validating the initial cluster prepared based on the field observations. The lagoons connected with the river and with the presence of aquatic macrophytes occupied the upper left quadrant; disconnected lagoons with the macrophytes occupied the lower left and upper right quadrants, and the lagoon without connection and without macrophytes occupied the lower right quadrant. It was still not clear why lagoons Biueiro and Cambará were clustered away from others with the same physical attributes, but their proximity probably imparted them some very similar particular trait, at least explaining the fact that they were clustered together (Fig. 2). The nine lagoons studied in the first sampling stage were typical of the region, repeating the characteristics previously observed in other lagoons of the Pantanal (Pinto da Silva, 1991; Heckman, 1994; 1998; Da Silva and Esteves, 1995; Hamilton et al., 1996; Pinto et al. 1999; Nogueira et al., 2002; Abdo et al., 2004). The major source of chlorophyll a in this study
came from the phytoplankton assemblage. Pantanal phytoplankton assemblages are know to have 17 species of Cyanophyceae, 28 species of Bacillariophyceae, 230 species of Chlorophyceae and 62 species of Euglenophyceae (De-Lamonica-Freire and Heckman, 1996). The relative proportion of each group could vary along the year with a greater proportion of Cyanophyceae at the end of the drought season due its ability to survive in this environment conditions (Margalef, 1983). This could be the case for the sampled Northern Pantanal lagoons due to the low dissolved oxygen.
Among the nutrient and limnological
characteristics observed in the sampled lagoons,
the negative correlation between the chlorophyll a
concentration and the water level was observed. This pattern was also identified in the Paraná River flood plain by Thomaz et al. (1997) and Izaguirre et al. (2001). In the first study, the
authors observed that the chlorophyll a
concentrations higher than 15 g.L-1 occurred
exclusively when the mean hydrometric levels were lower than 3.5 m; in the second study, however, the authors observed that the maximum
concentration of chlorophyll a recorded in the
low-water period was 18 g.L-1. In the nine lagoons
studied here, the mean concentration of chlorophyll a was 15 g.L-1, certainly as a result of
the high water volume that had already accumulated during the flooding period. An inverse pattern in the detailed study of the Santa
Rosa lagoon was observed where the
concentration of chlorophyll a increased
progressively until the end of the drought period
(from 27.7to 69.1 g.L-1, Fig. 3), when the water
volume reduced by the evaporation. The increased
concentration of the chlorophyll a observed during
the drought period at the Santa Rosa lagoon was also observed by other authors in similar places. Garcia (2000), who studied the lagoons in the Upper Paraguay River Basin, Trevisan (2001) in Amazonian lakes, Carvalho et al. (2001) studying the flood plains in the South America, and Dellamano-Oliveira et al. (2003) at Caçó lake (MA) found the same pattern.
Together with the decrease in the depth and increase in the chlorophyll a concentration, an
increase in the concentrations of most nutrients and a decrease in transparency was observed (Fig. 3). These characteristics suggested eutrophication at the Santa Rosa lagoon during the drought period. According to threshold values for the
trophic categories by OECD (1982) apud
Mercante and Tucci-Moura (1999) the lagoon was hypertrophic. According to the trophic state index (TSI), which used an equation involving the
variables phosphorus, chlorophyll a, and water
transparency (Toledo et al., 1983 apud Mercante
and Tucci-Moura, op cit.), the lagoon was
eutrophic. Whatever it could be, the chlorophyll a
concentration was higher than in other lagoons in Brazil. For example, the Itapeva Lagoon, a subtropical lagoon in the south of Brazil presented
a mean concentration of 34.7 g.L-1 chlorophyll a
in the spring and a mean value of 7.7 g.L-1
chlorophyll in the summer (Cardoso and Marques, 2004) and the Carapebus Lagoon in Rio de Janeiro
which showed a mean concentration of 19.9 g.L-1
at pollution-free points (Attayde and Bozelli, 1999).
In addition, the lack of the connection of the lagoons with the river during the drought in the Northern Pantanal temporarily isolates the cycling processes. This would result in a nutrient renovation rate sufficiently high to sustain the chlorophyll a levels recorded during the drought,
observed during the flooding.
The chlorophyll a concentration at the Santa Rosa
Lagoon showed significant and positive relations with the orthophosphate, total phosphorus, total nitrogen, and suspended nitrogen, and a negative relation with ammonia. In Amazonian lagoons studied by Trevisan (2001) in the drought period the phytoplankton biomass was highly influenced by the total nitrogen concentration, as also recorded by Takamura et al. (2003) in Japanese lagoons with similar limnological conditions. Based on the N:P (Nitrogen:Phosphorus) ratio suggested by Koerselman and Meuleman (1996), growth was limited by the nitrogen when the N:P ratio was smaller than 14, and limited by the phosphorus when the N:P ratio was higher than 16. During the flooding period in all the lagoons studied, the N:P ratio was smaller than 5, with the exception of the total forms (Ntotal:Ptotal <10).
During the drought period, in 75% of the samplings, the N:P ratio of all the forms analyzed (ammonia / orthophosphate, suspended nitrogen / suspended phosphorus, total nitrogen / total phosphorus) was smaller than 2. While the areas subject to flooding in the subtropical regions were frequently limited by the phosphorus (Pan et al., 2000; Rai, 2000; Newman et al., 2004; Qiu et al., 2004), in the northern part of the Pantanal of Mato Grosso the ten marginal lagoons studied seemed to be limited by nitrogen.
The data indicated that ammonia was the most important nitrogen form. During the flooding period, the mean concentration of ammonia in the
nine lagoons was 0.006 mg.L-1. During the drought
period at the Santa Rosa lagoon, after a sudden increase in ammonia concentration, a strong decrease was recorded with later stabilization of the concentration around 0.004 mg.L-1 (Fig. 3).
The decrease in ammonia concentration coincided with an increase in the concentration of the chlorophyll a, which could be understood as the
result of direct assimilation (Hutchinson, 1975). The stabilization of a minimal concentration of ammonia, in turn, seemed to determine the
maximum concentration of the chlorophyll a (Fig.
3) supported by the system. The mean value recorded during the flooding period remained in the same order of magnitude, which reinforced the importance of ammonia to maintain the phytoplankton chlorophyll a levels.
It is also interesting to point out that the phytoplankton densities also depended on regular seasonal changes such as light, temperature, and
grazing pressure (Sorokin, 1999; Kufel, 2001). In the lagoons studied here, the nutrient availability could be the limiting factor for the phytoplankton populations, but other biotic interactions could also be important or even determinative. The luminosity and predation, for example, were important mechanisms that were not analyzed in this research. These variables still must be better understood in the marginal lagoons on the Northern Pantanal flood plains.
ACKNOWLEDGEMENTS
We dedicate this paper to limnologist Vangil Pinto Silva, as a form of paying homage to a great friend and connaisseur of Pantanal systems, who lost his life in teaching. We thank CNPq for providing the means for this work to be performed with incentive from the PELD site 12 Research Program, a master’s scholarship for the student Monica Bleich, and an DCR fellowship for Dr. Roberto Silveira. We also thank RPPN SESC-Pantanal for providing all the logistic support in the field and especially to technician Enésio Fransisco and Park Rangers Joaquim and
Alessandro for their dedication and
professionalism during the field activities.
RESUMO
amônia durante a estação seca. O período de seca também apresentou aproximadamente 3 vezes mais biomassa de clorofila a do que o período das chuvas.
REFERENCES
Abdo, M. S. A.; Da Silva, C. J. (2004), Limnological characteristics of the water bodies of the Corutuba Nesting Site in Brazil’s Pantanal. Acta Limnologica Brasiliensia., 16 (4), 359-368.
Allen, S. E. (1989), Chemical analysis of ecological materials. Blackwell Scientific Publications. London.
American Public Health Association – APHA. (1998). Standart methods for the examination of water and wastewater. 20 ed. Baltimore, APHA, AWWA,
WEF.1220 p.
Assine, M. L.; Soares, P. C. (2004). Quaternary of the Pantanal, wet-central Brazil. Quaternary International, 114, 23-34.
Attayde, J. L.; Bozelli, R.L.(1999), Environmental heterogeneity patterns and predictive models of chlorophyll a in a Brazilian coastal lagoon. Hydrobiologia, 390, 129-139.
Cardoso, L. S.; Marques, D. M. (2004), The influence of hydrodinamics on the spatial and temporal variation of phytoplankton pigments in a large, sub-tropical coastal lake (Brazil). Brazilian Archives of Biology and Technology, 47 (4), 587-600.
Carvalho, P.; Bibi, L. M.; Thomaz, S. M.; Oliveira, L. G.; Robertson, B.; Tevechio, W. L.; Darwisch, A. J. (2001), Comparative limnology of South America floodplain lakes and lagoons. Acta Scientiarum, 3 (2),
265-273.
Da Silva, C. J.; Esteves, F. A. (1995), Dinâmica das características limnológicas das Baías Porto de Fora e Acurizal (Pantanal de Mato Grosso) em função do nível da água. Oecologia Brasiliensis, 1, 47-60.
Da Silva, M. P.; Mauro, R.; Mourão, G.; Coutinho, M. (2000), Distribuição e quantificação de classes de vegetação do Pantanal através de levantamento aéreo.
Revista Brasileira de Botânica., 23 (2), 143-152.
Da Silva, C. J., Wantzen, K. M., Nunes, da Cunha, C. and Machado, F., de A. (2001), Biodiversity in The Pantanal Wetland, Brazil. – In- Biodiversity in Wetlands: assessment, function and conservation,
Volume 2. - Backhuys Publishers, Leiden, Netherlands.
De-Lamonica-Freire, E. A. and Heckman, C. W. (1996), The seasonal sucession of biotic communities in wetlands of the tropical wet-and-dry climatic zone: III The algal Communities in the Pantanal of Mato Grosso, Brazil, with a comprehensive list of the know species and revision of two desmid taxa. Int. Revue ges. Hydrobiol.81 (2), 253-280
Dellamano-Oliveira, M. J.; Senna, P. A. C.; Taniguchi, G. M. (2003), Limnological characteristics and seasonal changes in density of the phytoplanktonic community at the Caçó pond, Maranhão state, Brazil.
Brazilian Archives of Biology and Technology, 46 (4), 641-651.
Garcia, F. C. (2000), Fatores controlando a concentração de clorofila em lagos de várzea da bacia do alto Paraguai, Cáceres, MT. Masters thesis, Instituto Nacional de Pesquisas da Amazônia, Manaus, Brazil.
Hamilton, S. K.; Sippel, S. J.; Melack, J. M. (1996), Inundation patterns in the Pantanal wetland of South America determined from passive microwave remote sensing. Archive für Hydrobiology., 137, 1-23.
Heckman, C. W. (1994), The seasonal succession of biotic communities in wetlands of the tropical wet-and-dry climatic zone: I. Physical and chemical causes and biological effects in the pantanal of Mato Grosso, Brazil. Int. Revue ges. Hydrobiol, 79,
397-421.
Heckman, C. W. (1998), Ecosystem dynamics in the Pantanal of Mato Grosso, Brazil. Verh. International Verein. Limnology, 26, 1343-1347.
Hutchinson, G. E. (1975), A treatise on limnology: Chemistry of lakes. V. I, Part 2. Wiley Interscience,
USA.
Izaguirre, I.; O’Farrel, I.; Tell, G. (2001), Variation in phytoplankton composition and limnological features in a water – water ecotone of the Lower Paraná Basin (Argentina). Freshwater Biology, 46, 63-74.
Junk, W. J. (1980). Áreas inundáveis: um desafio para limnologia. Acta Amazônica, 10 (4), 775-795.
Junk, W. J. ; Bayley, P. B.; Sparks, R. E. (1989). The flood pulse concept in river-floodplain systems.
Canadian Special. Publication Fisheries and Aquatic Sciences, 106, 110-127.
Koerselman, W.; Meuleman, A. F. M. (1996), The vegetation N:P ratio: a new tool to detect the nature of nutrient limitation. Journal of Applied Ecology, 33,
1441-1450.
Kufel, L. (2001), Uncoupling of chlorophyll and nutrients in lakes – possible reasons, expected consequences. Hydrobiologia, 443, 59-57.
Margalef, R. (1983) Limnología. Ediciones Omega,
Barcelona, Spain.
Mercante, C. T. J.; Tucci-Moura, A. (1999), Comparação entre os índices de Carlson e de Carlson modificado aplicados a dois ambientes aquáticos subtropicais, São Paulo, SP. Acta Limnológica Brasiliensia, 11, 1-14.
Nogueira, F., Souza, M. D., Bachega, I.; Silva, R. L. (2002), Seasonal and diel limnological differences in a tropical floodplain lake (Pantanal of Mato Grosso, Brazil). Acta Limnologica Brasiliensia,14 (3), 17-25.
Nush, E. A. (1980), Comparison of different methods for chlorophyl and phaeopigment determination.
Archiv. Hydrobiol. Beih. Ergebn. Limnol., 14, 14-36.
Pan, Y.; Stevenson, R. J.; Vaithiyanathan, P.; Slate, J; Richardson, C. (2000), Changes in algal assemblages along observed and experimental phosphorus gradients in a subtropical wetland, U.S.A. Freshwater Biology,44, 339-353.
Pinto, A. A.; Da Silva, C. J.; Girard, P. Souza, M. D.; Nogueira, F. (1999), The flood pulse and the limnology of the Sinhá Mariana Baía in the Mato Grosso Pantanal, Brazil. Revista Boliviana de Ecología., 6, 19-26.
Pinto-Coelho, R. M.; Greco, M. K. B. (1999), The contribution of water hyacinth (Eichhornia crassipes)
and zooplankton to the internal cycling of phosphorus in the eutrophic Pampulha reservoir, Brasil.
Hydrobiologia,411, 115-127.
Putz, R.; Junk, W. J. (1997), Phytoplancton and periphyton. In- The Central Amazon floodplain: ecology of a pulsing system. Spring Verlag., Berlin.
Qiu, S.; Maccomb, A. J.; Bell, R. W.; Davis, J. A. (2004), Partitioning processes controlling water column phosphorus concentrations in a shallow wetland. Freshwater Biology, 49, 563-575.
Rai, A. K. (2000), Limnological characteristics of subtropical lakes Phewa, Begnas, and Rupa in Pokhara Valley, Nepal. Limnology, 1, 33-46.
Sánchez, R. O. (1992), Zoneamento agroecológico do estado de Mato Grosso: ordenamento ecológico – paisagístico do meio natural e rural. Cuiabá.
Fundação de pesquisas Cândido Rondon.
Sorokin, Y. I. (1999). Aquatic microbial ecology.
Blackhoys Plublishers, Leiden.
Takamura, N.; Kadono, Y.; Fukushima, M.; Nakagawa, M.; Kim, B. O. (2003), Effects of aquatic macrophytes on water quality and phytoplankton comunities in shallow lakes. Ecological Research,
18, 381-395.
Teixeira, J. G.; Tundisi, J. G.; Kutner, M. B. (1965). Plankton studies in mangrove: the standing stok and some ecological factors. Boletim do Instituto Oceanografico., 24, 23-41.
Thomaz, S. M.; Roberto, M. C.; Bini, L. M. (1997), Caracterização limnológica dos ambientes aquáticos e influência dos níveis fluviométricos. In- A planície de inundação do alto rio Paraná: aspectos físicos, biológicos e sócio-econômicos. Maringá: UEM.
Brazil
Trevisan, G. V. (2001), Influência da Densidade Zooplactônica e da concentração total de Nutrientes sob a Biomassa Fitoplanctônica em Lagos da Amazônia Central. Masters thesis, Instituto Nacional de Pesquisas da Amazônia, Manaus, Brazil.
Wetzel, R. G. (2001). Limnology: lake and river ecosystems. Academic Press, San Diego
Wilkinson, L. (1990), Systat: the system for statistics. Systat Inc., Evnston.