Contents lists available atScienceDirect
Industrial Crops and Products
j o u r n a l h o m e p a g e :w w w . e l s e v i e r . c o m / l o c a t e / i n d c r o p
Modeling mono- and multi-component adsorption of cobalt(II),
copper(II), and nickel(II) metal ions from aqueous solution onto a new
carboxylated sugarcane bagasse. Part I: Batch adsorption study
Stela Nhandeyara do Carmo Ramos
a, Amália Luísa Pedrosa Xavier
a,
Filipe Simões Teodoro
a, Megg Madonyk Cota Elias
a, Fernanda Jorge Gonc¸alves
a,
Laurent Frédéric Gil
a, Rossimiriam Pereira de Freitas
b, Leandro Vinícius Alves Gurgel
a,∗aGroup of Physical Organic Chemistry (GPOC), Department of Chemistry, Institute of Biological and Exact Sciences (ICEB), Federal University of Ouro Preto,
Campus Morro do Cruzeiro, Bauxita, 35400-000 Ouro Preto, Minas Gerais, Brazil
bDepartment of Chemistry, Institute of Exact Sciences (ICEx), Federal University of Minas Gerais, Avenida Antônio Carlos, 6627, 31270-901 Belo Horizonte,
Minas Gerais, Brazil
a r t i c l e
i n f o
Article history:
Received 11 February 2015
Received in revised form 11 April 2015 Accepted 11 May 2015
Available online 10 June 2015
Keywords:
Sugarcane bagasse Trimellitic anhydride Adsorption Metal ion Desorption
a b s t r a c t
A new carboxylated-functionalized sugarcane bagasse (STA) was prepared through the esterification of sugarcane bagasse with trimellitic anhydride. The optimized synthesis conditions yield STA with a per-cent weight gain of 73.9% and the number of carboxylic acid groups accounted for 3.78 mmol/g. STA was characterized by FTIR, elemental analysis, TGA, PZC, and SEM. Adsorption kinetics followed a pseudo-second-order model. The adsorption rate constant showed the following order:k2,Ni2+>k2,Cu2+>k2,Co2+.
Four mono- and multi-component isotherm models were used to model the adsorption systems. Mono-component experimental data were fitted to Langmuir and Sips models; whereas, multiMono-component data were fitted to modified extended Langmuir andP-factor models. The maximum adsorption capacities (Qmax,mono) obtained from the Langmuir model were 1.140, 1.197, and 1.563 mmol/g for Co2+, Cu2+, and
Ni2+, respectively. The competitive studies demonstrated that the multicomponent adsorption capacity
(Qmax,multi) was smaller thanQmax,mono, as a result of the interaction between the metal ions. Desorption
studies showed that all metal ions could be fully desorbed from STA.
© 2015 Elsevier B.V. All rights reserved.
1. Introduction
The Agency for Toxic Substances and Disease Registry (ATSDR, 2014) have classified some metals as toxic, persistent, and bioac-cumulative elements. Among the most hazardous substances that impose risks to human health are various toxic metals (Ahmad and Prasad, 2011). Interestingly, arsenic (As), lead (Pb), and mercury (Hg) are the top three most harmful metals, followed by cobalt (Co), nickel (Ni), and copper (Cu) at positions 51, 57, and 118, respectively (Ahmad and Prasad, 2011; ATSDR, 2014). Such toxic metals are present in the ionic form in waste streams from mining operations, tanneries, batteries, electronics, electroplating, and petrochemicals as well as in textile and pesticide mills (Amin et al., 2013; Fu and Wang, 2011; Kazemipour et al., 2008). Toxic metals are some of the major pollutants in marine, soil, solid industrial wastes, and
∗Corresponding author. Tel.: +55 31 3559 1707; fax: +55 31 3559 1707.
E-mail addresses:[email protected],[email protected](L.V.A. Gurgel).
untreated industrial wastewaters. Both solid and liquid industrial wastes can be considered as major sources of innumerous types of metals found in soil, groundwater, and water bodies (Amin et al., 2013; Kazemipour et al., 2008). The discharge of industrial efflu-ents containing large amounts of toxic metals into the environment without suitable treatment has resulted in serious environmental problems (Amin et al., 2013; Barakat, 2011; Soetan et al., 2010).
Co, Cu, and Ni are all micronutrients for plants, animals, and humans (Ahmad and Prasad, 2011; Soetan et al., 2010). They par-ticipate in prosthetic groups and as co-factors of many enzymes and are, therefore, essential; however, at high concentrations, they can cause several serious health problems in humans (Ahmad and Prasad, 2011). The toxic effects of Co, Cu, and Ni are well docu-mented (Klaassen, 2008).
Various physicochemical methods have been suggested for the removal of metal ions from industrial wastewaters such as electrochemical and chemical precipitation, ultrafiltration and nanofiltration, ion exchange, and reverse osmosis (Fu and Wang, 2011; Kazemipour et al., 2008). Such methods can be adopted
http://dx.doi.org/10.1016/j.indcrop.2015.05.022
alone or in combination, such as chemical precipitation followed by nanofiltration (Fu and Wang, 2011). Such processes have significant drawbacks, such as incomplete removal, high-energy require-ments, and production of toxic sludge that needs to be treated and disposed (Barakat, 2011).
Recently, various studies have reported the development of cheaper and more effective technologies, aiming to decrease the amount of wastewater produced and enhance the standard qual-ity of the treated effluent (Barakat, 2011; Fu and Wang, 2011). Adsorption has become one of the cheaper alternative treat-ments, as the search for low-cost adsorbents (modified or not) with a metal ion-binding capacity has been intensified (Bhatnagar and Sillanpää, 2010; Miretzky and Cirelli, 2010; Sun, 2010; Wan Ngah and Hanafiah, 2008). Agricultural by-products are promis-ing candidates as effective adsorbents, owpromis-ing to their low cost and availability throughout the world (Kumar, 2006). Among the most important low-cost agricultural by-products is sugarcane bagasse (SB). It is largely available in countries such as Brazil, China, and India, where it is a by-product from the sugar and bioethanol mills. Among these countries, Brazil is the world’s largest pro-ducer of sugarcane (Ferreira et al., 2015). SB is mainly composed of cellulose (42.19±1.93%), hemicelluloses (27.60±0.88%), lignin (21.56±1.67%), ash (5.63±2.31%), and extractives (2.84±1.22%) (Rocha et al., 2015). The three major components of SB are rich in primary and secondary hydroxyl groups that can be used to graft functional groups with a metal ion-binding capacity (Wan Ngah and Hanafiah, 2008).
This study aimed to prepare a new adsorbent with an improved metal ion-binding capacity from chemical modification of SB with trimellitic anhydride (TA). TA is a commercial and stable reagent. After esterification with SB, it releases two carboxylic acid groups that can form complexes with different metal ions. The chemical modification of SB was intensively studied and optimized. The new adsorbent material was used to study the removal of Co2+, Cu2+, and Ni2+from spiked monocomponent and multicomponent aqueous solutions. The influence of time, pH, and metal ion concentration on adsorption was studied in detail. Desorption and reuse of the spent adsorbent was also evaluated.
2. Experimental
2.1. Materials
CoCl2·6H2O, CuSO4·5H2O, CH3COONa·3H2O, monochloroacetic acid (99%), and isopropanol were purchased from Synth (Brazil). 1,2,4-Benzenetricarboxylic anhydride (trimellitic anhydride, TA) (97%) (cat no. 552-30-7) and 3 Å molecular sieve (cat no. 208582) were purchased from Sigma–Aldrich (Brazil). NiCl2·6H2O, glacial acetic acid (99.5%), NaOH, HCl (37% w/w), acetone,N,N′ -dimetylacetamide (DMA), and pyridine (Py) were purchased from Vetec (Brazil). Quantitative filter papers (blue ribbon, JP 41, cat no. 3509-1, 12.5 cm diameter, ash content of 0.00009 g, and grammage of 80 g/cm2) were purchased from JProlab (Brazil). Before use, DMA was stored with molecular sieves (3 Å) that had been previously activated in an oven at 150◦C. Py was refluxed in a round-bottomed flask with NaOH pellets for 12 h and distilled before use.
2.2. Sugarcane bagasse preparation
SB stalks were provided by a local sugar and alcohol company, Ouro Preto, Minas Gerais, Brazil. The SB was dried under sunlight for 1 week, cut into 100 mm pieces, and milled in a wiley mill (DeLeo Brazil) to pass a 16-mesh screen. The SB was sifted on an electromagnetic stirrer (Bertel, Brazil) using a three-sieve system composed of 16 (1.00 mm), 60 (0.251 mm), and 100 (0.149 mm)
mesh for 10 min when set to vibrate with an amplitude of 1. The fraction retained by the 60-mesh screen was collected, transferred to a 5 L beaker, suspended, and stirred using a magnetic stirrer in distilled water at 70◦C for 1 h to remove water-soluble compounds. The SB was then washed with distilled water, and acetone before being dried in an oven at 90◦C. To remove SB extractives, that is, phenolic compounds, it was washed in Soxhlet apparatus with hex-ane/ethanol (1:1, v/v) for 4 h, dried in an oven at 90◦C to remove the organic solvents, and stored in a desiccator prior to use.
2.3. Preparation of SB modified with trimellitic anhydride (STA)
The chemical modification of SB with TA to obtain STA was opti-mized by studying the effect of reaction time and TA amount on the percent weight gain (pwg) and number of carboxylic acid groups (nCOOH).
2.3.1. Modification of SB as a function of the amount of TA
SB (1.0 g), different amounts of TA (2.0, 4.0, 6.0 and 8.0 g), anhy-drous DMA (7.5 mL), and anhyanhy-drous Py (7.5 mL) were added to a round-bottomed flask to give a solid-to-liquid ratio of 1:15 (w/v) (SB:DMA/Py). Then, the flask was equipped with a reflux condenser attached to a drying tube packed with anhydrous calcium chloride. The suspensions were heated at 100◦C in an oil bath under constant magnetic stirring (300 rpm) (Corning®, model PC-420D) for 3 h. At the end of each reaction, the suspensions were left to cool (30 min) and were then transferred to 250 mL beakers containing 125 mL of isopropanol. The suspensions were magnetically stirred for 30 min before being transferred to a sintered glass funnel (150 mL, poros-ity 3). This procedure was performed twice, using a total of 250 mL of isopropanol. Then, STAs were washed in a row with distilled water (100 mL), 0.01 mol/L HCl solution (100 mL), distilled water (100 mL), and isopropanol (50 mL). The yellow solids (STAs) were dried in an oven at 95◦C for 2.5 h, put in a desiccator to cool, and weighed. ThepwgandnCOOHvalues were determined.
2.3.2. Modification of SB as a function of reaction time
SB (1.0 g), TA (4.0 g), anhydrous DMA (7.5 mL), and anhydrous Py (7.5 mL) were added to a round-bottomed flask to give a solid-to-liquid ratio of 1:15 (w/v). Then, the flask was equipped with a reflux condenser attached to a drying tube packed with anhydrous calcium chloride. The suspensions were heated at 100◦C in an oil bath under constant magnetic stirring (300 rpm) (Corning®, model PC-420D). Different reaction times were studied 1, 3, 6, 12, 18, 24, and 30 h. The purification and characterization of STAs followed the same procedure described in Section2.3.1.
2.4. Characterization of STA
2.4.1. Percent weight gain (pwg)
Thepwgafter chemical modification of SB with TA was calcu-lated using Eq.(1).
pwg=
wSTA−wSBwSB
×100 (1)
wherepwg(%) is the percent weight gain, andwSTAandwSB(g) are the weights of STA and SB after and before chemical modification, respectively.
2.4.2. Number of carboxylic acid groups (nCOOH)
aliquots from each Erlenmeyer flask were titrated with standard-ized HCl solution (10 mmol/L) until the phenolphthalein endpoint. ThenCOOHof STA was calculated using Eq.(2).
nCOOH=[CNaOHVNaOH−f(CHClVHCl)]
wSTA (2)
wherenCOOH(mmol/g) is the number of carboxylic acid groups on STA,CNaOHandCHCl(mmol/L) are the concentrations of standard-ized NaOH and HCl solutions, respectively,VNaOH(L) is the volume of standardized NaOH solution,VHCl(L) is the volume of standard-ized HCl solution expended titrating the excess of unreacted NaOH, wSTA(g) is the weight of SB modified with TA, andfis a conversion factor (f= 5).
2.4.3. Determination of the point of zero charge (PZC)
To determine the PZC of STA, three different initial pH solutions (3, 6, and 11) were prepared using 0.1 mol/L HNO3 and 0.1 mol/L NaOH solutions (Noh and Schwarz, 1990). For each initial pH, 20.0 mL of 0.01 mol/L NaNO3solution (background electrolyte) and different amounts of STA samples were added to five 125 mL Erlen-meyer flasks to give suspensions of 0.05, 0.1, 0.5, 1, and 2% (w/v). The flasks were mechanically stirred at 25◦C for 24 h at 130 rpm (Nova Ética, model 109/2). The equilibrium pH was measured using a pH meter (Hanna Instruments, model HI 223).
2.4.4. Fourier transform infrared (FTIR) spectroscopy
SB and STA were analyzed by FTIR spectroscopy. Samples were previously dried in an oven at 90◦C for 1 h. Then, 1.0 mg of SB, STA, STA-loaded with Co2+, Cu2+, and Ni2+, and STA after desorption of Co2+, Cu2+, and Ni2+were mixed with 100.0 mg of spectroscopy grade KBr and pressed in a hydraulic press at 8 tons for 0.5 min to prepare 13 mm KBr pellets (Pike CrushIR, model 181-1110, Pike Technologies, Canada). The FTIR spectra were recorded on an ABB Bomen MB 3000 FTIR spectrometer (Quebec, Canada) equipped with ZnSe optics and a DTGS detector at a resolution of 4 cm−1from 500 to 4000 cm−1with 32 scans per sample.
2.4.5. Elemental analysis
The carbon (C), hydrogen (H), and nitrogen (N) contents in SB and STA were determined by elemental analysis. Samples were previously dried in an oven at 90◦C for 1 h. Elemental analysis was performed on a PerkinElmer Series II CHNS/O 2400 analyzer (Shelton, USA).
2.4.6. Thermogravimetric analysis (TGA)
TGA curves were recorded on a Shimadzu DTG-60H simultane-ous TG–DTA thermogravimetric analyzer on an alumina pan under a nitrogen atmosphere at a flow rate of 100 mL/min from 35 to 700◦C at a linear heating rate of 10◦C/min. Samples of SB and STA were previously dried in an oven at 90◦C for 1 h.
2.4.7. Scanning electron microscopy (SEM)
Morphologies of SB and STA were examined on a Vega3 SB scanning electron microscope (Tescan/Oxford Instruments) with a filament voltage of 20 keV and secondary electron (SE) detector. Samples of SB and STA were previously dried in an oven at 90◦C for 1 h. Samples of SB and STA were placed on a graphite ribbon that was fixed on aluminum sample holders and sputter-coated with gold in a modular high-vacuum coating Q150R ES (Quorum Technologies).
2.4.8. Energy dispersive X-ray (EDX) spectroscopy
The surface of the STA adsorbent loaded with Co2+, Cu2+, and Ni2+ was mapped on a Vega3 SB SEM–EDX spectrometer (Tes-can/Oxford Instruments) with a filament voltage of 20 keV and backscattered electron (BSE) detector. Samples of STA loaded with
metal ions were previously dried in an oven at 60◦C for 12 h. Samples of STA–Co2+, Cu2+, and Ni2+ (100 mg) were pressed in a hydraulic press at 8 tons for 1 min to prepare 13 mm pellets. The samples were sputter-coated with carbon in a modular high-vacuum coating Q150R ES (Quorum Technologies).
2.5. Adsorption experiments
STA adsorbent was used for Co2+, Cu2+, and Ni2+adsorption in aqueous mono- and multi-component solutions in batch mode. Adsorption was studied as a function of time (kinetics), pH, and initial metal ion concentration.
2.5.1. Adsorption of metal ions on STA as a function of contact time (kinetics)
Samples with 100.0 mL of 0.79 mmol/L metal ion solution buffered at pH 5.5 for Cu2+ and 5.75 for Co2+ and Ni2+ using 0.05 mol/L CH3COOH/CH3COONa were added to 250 mL Erlen-meyer flasks and pre-thermostated to 25◦C in a shaker incubator for 1 h (Tecnal, model TE-424, Piracicaba, SP, Brazil). Then, 20.0 mg samples of STA were weighed on cylindrical glasses (1.8 mm height and 2.2 mm diameter), added to each Erlenmeyer flask and stirred at 130 rpm for different time intervals. After shaking, the solids were filtered off by a single filtration (JP 41 filter paper) and the metal ion concentration was determined by flame atomic absorp-tion spectrophotometry (FAAS) (Co= 240.7 nm, Cu= 324.8 nm, andNi= 232 nm). The amount of each metal ion adsorbed on STA in each time was calculated using Eq.(3).
qt=
Ci,M2+−Ct,M2+
VM2+
wSTA (3)
whereqt(mmol/g) is the amount of metal ion (M2+) adsorbed per weight of STA at timet,VM2+(L) is the volume of metal ion solu-tion,Ci,M2+andCt,M2+(mmol/L) are the concentrations of metal ion solution at 0 and timet, andwSTA(g) is the weight of STA adsorbent.
2.5.2. Adsorption of metal ions on STA as a function of pH
STA samples (20.0 mg) were weighed into 250 mL Erlenmeyer flasks and 100.0 mL of 0.79 mmol/L metal ion solution was added. Metal ion solutions were buffered at pH values from 2.0 to 3.5 using 0.05 mol/L ClCH2COOH/ClCH2COONa solutions and from 4.0 to 5.75 using 0.05 mol/L CH3COOH/CH3COONa solutions. The Erlenmeyer flasks were transferred to a pre-thermostated shaker incubator at 25◦C and mechanically stirred at 130 rpm until equilibrium was reached. After shaking, the solids were filtered off by a sin-gle filtration (JP 41 filter paper) and the metal ion concentration was determined by FAAS. The solubility product constant (Ksp) for Co(OH)2 (5.92×10⁻¹⁵), Cu(OH)2 (1.8×10⁻²⁰), and Ni(OH)2 (5.48×10⁻¹⁶) were used to calculate the maximum pH value of the metal ion solutions to avoid the formation of hydrolyzed species and precipitation (Haynes, 2014).
2.5.3. Adsorption isotherms 2.5.3.1. Monocomponent.
STA samples (20.0 mg) were weighed into 250 mL Erlenmeyer flasks and 100.0 mL of each metal ion solution (buffered at pH 5.5 for Cu2+ and 5.75 for Co2+ and Ni2+ with 0.05 mol/L CH3COOH/CH3COONa solution), with concentrations ranging from 0.05 to 1.12 mmol/L, were added. Further procedures were the same described in Sections2.5.1and2.5.2.
2.5.3.2. Multicomponent.
Fig. 1.(a) Scheme illustrating the synthesis strategy used to prepare STA and (b) suggested mechanism of adsorption of metal ions (M2+) on STA adsorbent (M= Co, Cu, or Ni and mXn−= counter ion (SO
42–or Cl−)).
Table 1
The results of optimizing the chemical modification of SB with TA.
Trimellitic anhydride (TA) (g) Reaction time (h) STAa
pwg(%) nCOOH(mmol/g)
1.0 3 16.79±1.42 1.91±0.01
2.0 42.91±2.40 2.97±0.02
4.0 60.72±3.11 3.75±0.01
6.0 64.93±1.26 3.74±0.16
4.0 1 47.61±0.93 3.10±0.08
3 60.72±3.11 3.75±0.01
6 63.98±0.60 4.20±0.10
12 71.00±3.14 4.08±0.01
18 77.55±3.35 4.78±0.19
24 88.55±0.89 4.72±0.03
30 64.69±1.63 4.49±0.13
aThe weight of SB used in all chemical modifications was 1.0 g. All reactions were performed in duplicate.
(buffered at pH 5.5 with 0.05 mol/L CH3COOH/CH3COONa solu-tion), with concentrations ranging from 0.05 to 1.12 mmol/L for Co2+–Ni2+, Cu2+–Ni2+, and Co2+–Cu2+, were added. Further proce-dures were the same described in Sections2.5.1and2.5.2.
2.6. Desorption experiments
STA samples (100.0 mg) were loaded with 100.0 mL of buffered metal ion solution (3.15 mmol/L for Co2+, Cu2+, and Ni2+) at pH 5.5 (0.05 mol/L CH3COOH/CH3COONa solution) for 180, 250, and 75 min, that is, the optimal parameters determined from adsorption studies for Co2+, Cu2+, and Ni2+, respectively. Samples of STA-loaded with each metal ion were recovered by a single filtration, washed with an excess of deionized water (Millipore, model Milli-QTM SimplicityTM) to remove metal ions that were not adsorbed on STA, dried in an oven at 60◦C for 12 h, and weighed. Dried sam-ples of STA (20.0 mg) loaded with each metal ion were weighed into 250 mL Erlenmeyer flasks and 20.0 mL of aqueous desorption solution (1.0 mol/L HNO3) was added. The Erlenmeyer flasks were transferred to a pre-thermostated shaker incubator at 25◦C and mechanically stirred at 130 rpm for 5 min. Further procedures were the same described in Sections2.5.1and2.5.2. The desorption effi-ciency (Edes) of each STA-metal ion system was calculated using Eq. (4).
Edes=
Ce,M2+V QT,maxwSTA
×100 (4)
whereEdes(%) is the desorption efficiency,Ce,M2+(mmol/L) is the equilibrium concentration of M2+in aqueous desorption solution, V(L) is the volume of desorption solution,QT,max(mmol/g) is the theoretical maximum adsorption capacity calculated for each metal ion, andwSTA(g) is the weight of STA-loaded with each metal ion.
2.6.1. Reuse of the spent adsorbent after desorption
Samples of 20.0 mg of STA (dried in an oven at 80◦C for 1 h) from the desorption study were weighed into 250 mL Erlenmeyer flasks and 100.0 mL of 0.79 mmol/L metal ion solution was added. The optimal parameters determined from adsorption studies were used. Further procedures were the same as those described in Sec-tions2.5.1and2.5.2. The re-adsorption efficiency (Ere-ads) of STA for a cycle of adsorption of metal ion after desorption was calculated using Eq.(5).
Ere−ads=
wSTA,M2+−wSTA
QT,maxdes+(QmaxwSTA)ads/wSTA QT,max×100 (5)
3. Results and discussions
3.1. Synthesis and characterization of STA
3.1.1. Percent weight gain (pwg) and number of carboxylic acid groups (nCOOH)
Fig. 1 shows the synthetic strategy used to prepare the STA adsorbent and a suggested adsorption mechanism for metal ions (M2+) on STA. The modification of SB with TA using Py as the base/catalyst and DMA as the solvent to obtain STA was opti-mized by studying the effects of reaction time and TA amount on thepwg andnCOOHvalues. The results of the reaction optimiza-tion are shown inTable 1, which shows that, as the amount of TA was increased,pwgandnCOOHalso increased. The increase in the amount of TA from 4.0 to 6.0 g yielded a small increase in thepwg, but the value ofnCOOHwas almost the same, considering the stan-dard deviation. Thus, 4.0 g of TA was chosen as the best amount to obtain the highestnCOOHfor the subsequent experiments as a function of reaction time. As the reaction time increased,pwgand nCOOH also increased until 24 h. After 24 h, bothpwg andnCOOH decreased, which is probably because of the chemical degrada-tion of STA caused by the longer heating time. A longer heating time may also allow diesterification reactions, which could dimin-ish the weight gain caused by the release of water molecules. Water molecules can also hydrolyze the ester bonds between hydroxyl groups of SB and the trimellitate moiety, allowing a decreasing in bothpwgandnCOOH. Furthermore, longer reaction times can sub-stantially increase the preparation cost of STA. Therefore, taking into account the obtained results, a reaction time of 6 h and a TA-to-SB ratio of 4:1 were chosen to prepare a larger amount of STA in order to accomplish the adsorption experiments. When increas-ing the scale of the reaction to 10.0 g of SB and 40.0 g of TA,pwg andnCOOHbecame 73.9% and 3.78±0.03 mmol/g, respectively. The scale-up of the reaction resulted in apwgincrease of 15.5% and anCOOHdecrease of 11.1%. The estimated preparation cost of STA (TA/SB ratio of 4:1 and reaction time of 6 h), considering the inter-national market prices of the chemicals used, SB, and electricity in Brazil, was US\$ 57.43 per kilogram of STA. This preparation cost did not include the elaboration steps described in Section2.3.1.
3.1.2. Elemental analysis and FTIR spectroscopy
Elemental and FTIR spectroscopy analyses were performed for unmodified SB and TA-modified SB. The carbon, hydrogen, nitro-gen, and oxygen contents for SB and STA were 46.56 and 52.45%, 5.09 and 4.10%, 0.30 and 0.97%, and 48.06 and 42.49%, respectively. The oxygen content was indirectly obtained by calculating the dif-ference.Fig. 2a shows the FTIR spectra for SB and STA. The main changes highlighted in the FTIR spectrum for SB in comparison with STA are: (1) the appearance of a band at 2640 cm−1, which can be attributed to the stretching of hydrogen bonding present in the dimmer of carboxylic acid; (2) a strong band at 1717 cm−1, which can be attributed to the stretching of conjugated carbonyl ester; (3) a band at 1491 cm−1, which can be attributed to the stretching of C C bonds in the aromatic ring of the trimellitate moiety; (4) a band at 1281 cm−1, which can be attributed to the C O stretching of esters of aromatic acids; and (5) a band at 754 cm−1, which can be attributed to C H out-of-plane bending for the 1,2,4-substituted benzenoid compound (Pavia et al., 2009). These changes confirmed the introduction of the trimellitate group to the SB. Similar band assignments were reported bySaikia et al. (1993), who esterified different cellulose pulps with TA.
Fig. 2b shows FTIR spectra for STA and STA-loaded with Co2+, Cu2+, and Ni2+. The adsorption of metal ions on STA was character-ized by the two new bands arising at 1592 and 1552 cm−1, which can be attributed to asymmetric stretching of different carboxylate groups and indicate the complete deprotonation of carboxylic acid
4000 3500 3000 2500 2000 1500 1000 500 0 5 10 15 20 25 30 35 40 45 50 55 60 65 70 75 80 Tr an sm it tance ( %)
Wavenumber (cm-1)
SB
4000 3500 3000 2500 2000 1500 1000 500 0 5 10 15 20 25 30 35 40 45 50 55 60 65 70 75 80 (a) 754 2640 1281 1491 1717 STA Tr an sm it tance ( %)
Wavenumber (cm-1)
4000 3500 3000 2500 2000 1500 1000 500 0 10 20 30 40 50 60 70 80 90 100 110 120 130 140 150 160 170 180 190 200 1552 1592 T ra nsm it tance (%)
Wavenumber (cm-1)
STA-Ni2+
STA-Cu2+
STA-Co2+
STA (b)
Fig. 2.FTIR spectra of (a) SB and STA and (b) STA and STA-loaded with Co2+, Cu2+, and Ni2+(transmittances of STA–Co2+, STA–Cu2+, and STA–Ni2+spectra were shifted by 30, 60 and 90%).
groups during the adsorption process. These bands prove the par-ticipation of all carboxylate groups during the adsorption of metal ions, as suggested in the adsorption mechanism proposed inFig. 1b (Łyszczek, 2007). According toŁyszczek (2007), the splitting of the carboxylate band is suggestive of the presence of a non-equivalence of carboxylate groups. The similarities between the spectra of STA-loaded with Co2+, Cu2+, and Ni2+suggest similar metal coordination through the carboxylate groups.
3.1.3. Thermogravimetric analysis (TGA)
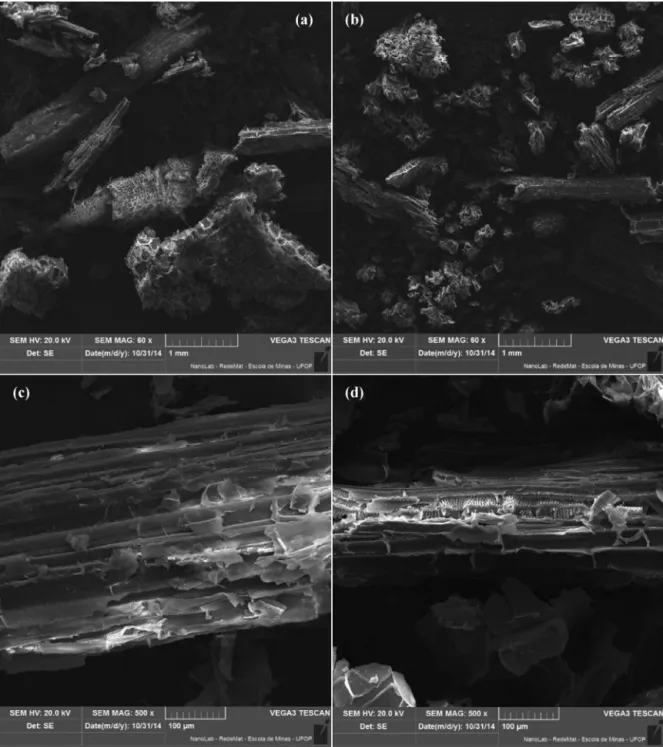
Fig. 3.SEM images of SB (a and c) and STA (b and d) at 60 and 500 fold magnification.
Table 2
TGA data for the thermal decomposition of SB and STA.
Parametersa SB STA
Ti,1(◦C) 35.3 36.4
Tm,1(◦C) 53.0 58.0
W1(%) 5.45 4.98
Ti,2(◦C) 202.3 134.0
Tm,2(◦C) 322.0 242.4
W2(%) 33.85 48.68
Ti,3(◦C) 340.0 293.4
Tm,3(◦C) 368.5 324.3
W3(%) 44.36 24.11
Ti,4(◦C) 404.0 363.8
Tm,4(◦C) – –
W4(%) 10.46 8.30
aT
i: initial decomposition temperature.TD: maximum decomposition temperature
(DTG peak), andW: weight loss in the decomposition event.
decomposition temperatures (Ti). The DTG peaks atTm,2andTm,3
for STA were also shifted to lower temperatures in comparison with
Tm,2andTm,3for SB. The second weight loss for STA also increased
in relation to SB, whereas the third weight loss for STA was smaller than SB. These results demonstrate that the esterification of SB with TA decreases its thermal stability. Similar trends were observed by Nada and Hassan (2006)andFerreira et al. (2015), who studied the succinylation (Tm,2andTm,3were 319 and 417◦C, respectively) and malonylation (Tm,2andTm,3were 206.9 and 350.5◦C, respectively) of SB.
3.1.4. Point of zero charge (PZC)
positive charge at pH < PZC, whereas at pH > PZC, it has a net neg-ative surface charge. The PZC of the STA adsorbent was found to be 3.16±0.07. The pKavalues of the trimellitic acid correspond-ing to position of carboxyl groups 1, 2, and 4 are 2.52, 3.84, and 5.20 (Fig. 1), respectively (Braude and Nachod, 1955). The com-parison between the PZC of STA and the pKavalues of trimellitic acid suggests that electronic effects provided by the presence of the ester linkage between the trimellitate and the hydroxyl groups of SB influence the acidity of the remaining carboxyl groups. The PZC value of STA suggests that the adsorption of metal ions will take place at pH≥3.16.
3.1.5. Scanning electron microscopy (SEM)
SEM was used to assess the morphological and surface features of the SB and STA adsorbent. SEM images were also used to assess the changes in the surface of SB after chemical modification with TA.Fig. 3shows SEM images of SB and STA at 60 (a and b) and at 500-fold (c and d) magnification. As can be seen inFig. 3a, the SB (the 60-mesh fraction) is composed of a variety of particles of different elements with different sizes and morphologies. The morphology of the SB particles (Fig. 3a) suggests that the milling process partially disintegrated the fibers, as the presence of damaged fibrous and pith material is noticeable. As can be seen inFig. 3b, after chem-ical modification of SB with TA, the particle size was apparently reduced. Disintegration of some particles may have been caused by swelling and agitation during the chemical modification. InFig. 3c, it is noticeable that the surface of the fibers was exposed during the milling process and its open interior can be seen. After chemi-cal modification, the fibers were more exposed and the presence of porous elements can be seen, as shown inFig. 3d. The exposure of these pores may increase the diffusion of metal ions into the fibers, which may increase the adsorption capacity of the STA adsorbent.
3.1.6. Energy dispersive X-ray (EDX) spectroscopy
EDX spectroscopy was used to map the surface of the STA adsor-bent in order to assess the adsorption sites containing adsorbed metal ions and their distribution along the surface of the adsorbent. Supplementary Figs. 2a–c show the distribution of Co2+, Cu2+, and Ni2+on the surface of the STA adsorbent. As can be seen in Supple-mentary Figs. 2a–c, a heterogeneous distribution of Co2+, Cu2+, and Ni2+was observed on the surface of STA adsorbent with a higher concentration of metal ions at some regions. The Langmuir and Sips models provides better fits for the adsorption of Co2+, Cu2+, and Ni2+ on the STA adsorbent, which suggests a homogeneous adsorption layer on the STA surface. However, in Supplementary Figs. 2a–c, it seems that there are some preferred adsorption sites. Never-theless, the Langmuir model would be representative, considering that there is no evidence of multilayer formation, only the presence of sparsely and preferential adsorption sites. Similar results were reported byVieira and Beppu (2006)for the adsorption of Hg2+on raw and crosslinked chitosan films.
3.2. Adsorption experiments
3.2.1. Effect of solution pH on metal ion adsorption
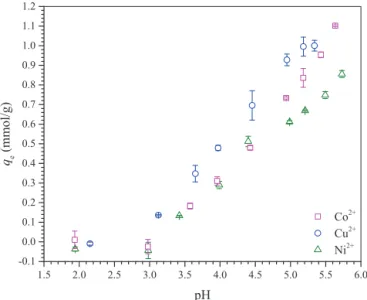
The effect of the solution pH on metal ion adsorption was eval-uated at 25◦C with a 0.79 mmol/L metal ion solution, 130 rpm, 0.2 g/L adsorbent, as well as 180, 250, and 75 min equilibrium time (te) (based on kinetic data) for Co2+, Cu2+, and Ni2+, respectively. Fig. 4shows the equilibrium adsorption capacity (qe) of Co2+, Cu2+, and Ni2+on the STA adsorbent as a function of the solution pH from 2.0 to 5.75. The uptake of metal ions from aqueous solu-tion hardly depends on the solusolu-tion pH, as the pH affects both the surface charge of the adsorbent and the form of the metallic ions in the aqueous solution (Karnitz et al., 2009; Srivastava et al., 2009). The surface charge of an adsorbent in aqueous solution is
1.5 2.0 2.5 3.0 3.5 4.0 4.5 5.0 5.5 6.0
-0.1 0.0 0.1 0.2 0.3 0.4 0.5 0.6 0.7 0.8 0.9 1.0 1.1 1.2
Co2+ Cu2+
Ni2+ qe
(m
m
o
l/
g
)
pH
Fig. 4.Effect of pH on adsorption of Co2+, Cu2+, and Ni2+on the STA (0.79 mmol/L M2+, 130 rpm, 25◦C, 0.2 g/L STA and 180, 250, and 75 min of shaking for Co2+, Cu2+, and Ni2+, respectively).
related to its PZC value. The PZC of STA was 3.16. Consequently, the adsorption of metal ions was favored at pH > PZC, where the STA surface is negatively charged, owing to deprotonation of the carboxylate groups of the trimellitate moiety that is grafted on SB. Fig. 4shows that theqeincreased as the solution pH increased, and a plateau was not reached. At low pH values (pH < 3), the carboxy-late groups on the STA surface were protonated and the adsorption of metal ions did not take place. From pH values slightly higher than PZC, the adsorption begins to take place as a consequence of strong attractions between the negatively charged carboxylate groups containing unshared electron pairs on the STA surface and cationic metal ions in solution. Adsorption at pH values higher than 5.75 was not studied, as the formation of metal-hydrolyzed species [M(OH)+] and the precipitation of metal ions [M(OH)
2(s)] may occur. Thus, the pH values of 5.5 for Cu2+and 5.75 for Co2+and Ni2+were considered as optimum pH values for the subsequent adsorption studies.
3.2.2. Adsorption kinetics
The adsorption kinetics represent one of the most important parameters for designing a wastewater treatment system with a batch adsorption process (Ferreira et al., 2015). Pseudo-first- and second-order kinetic models were used to model the adsorption rate of metal ions on the STA adsorbent at pH 5.5 for Cu2+and 5.75 for Co2+and Ni2+at 25◦C, 130 rpm, 0.79 mmol/L M2+, and 0.2 g/L adsorbent.
The pseudo-first-order kinetic model of Lagergren (1898) defines the adsorption rate in terms of adsorption capacity as fol-lows in Eq.(6):
dqt
dt =k1(qe−qt) (6)
whereqe andqt (mmol/g) are the adsorption capacities at equi-librium te and timet (min), respectively, and k1 (min−1) is the pseudo-first-order rate constant. Rearranging and integrating Eq. (6)using the boundary conditionsqt= 0 att= 0 andqt=qt att=t, gives Eq.(7):
qt=qe(1−exp−k1t) (7)
Table 3
Results of nonlinear regression analysis of the experimental data for adsorption of metal ions on STA (0.79 mmol/L M2+, 25◦C, 130 rpm, 0.2 g/L STA).
Parameters Co2+ Cu2+ Ni2+
pH 5.75 5.5 5.75
te(min) 180 250 75
qe,exp(mmol/g) 1.168±0.026 0.979±0.011 0.849±0.020
Pseudo–first–order
qe,est(mmol/g) 1.062±0.047 0.808±0.047 0.782±0.03
k1(min−1) (7.22±1.16)×10−2 (7.87±1.69)×10−2 (1.76±0.33)×10−1
R2 0.8816 0.7736 0.8419
2red 0.0179 0.0231 0.0108
Pseudo–second–order
qe,est(mmol/g) 1.153±0.035 0.979±0.051 0.849±0.020
k2(g/mmol min) (8.74±1.30)×10−2 (7.80±1.93)×10−2 (2.84±0.38)×10−1
R2 0.9580 0.8694 0.9617
2red 0.0064 0.0133 0.0026
Fig. 5.Adsorption kinetics of (a) Co2+, (b) Cu2+, and (c) Ni2+on the STA at pH 5.75 for Co2+and Ni2+and 5.5 for Cu2+, 0.79 mmol/L M2+, 25◦C, 130 rpm, and 0.2 g/L STA.
electrons between adsorbate and adsorbent (Ho and McKay, 1999).
It can be expressed as Eq.(8): dqt
dt =k2(qe−qt)2 (8)
whereqe andqt (mmol/g) are the adsorption capacities at equi-libriumteand timet(min), respectively, andk2(g/mmol min) is the pseudo-second-order rate constant. Rearranging and
integrat-ing Eq.(8)using boundary conditionsqt= 0 att= 0 andqt=qtatt=t, gives Eq.(9):
qt= k2qe 2t
1+k2qet (9)
Microcal OriginPro 2015TM set to use the iteration algorithm as Levenberg–Marquardt and the weight method as the statistical [Eq. (10)]. In this procedure the weights are used to minimize the2 [Eq.(11)] in order to obtain the best fit. Both the coefficient of determination (R2) and reduced2 [Eq.(12)] were used to mea-sure the quality of the nonlinear regression analysis and define the best model describing the adsorption.
wi= 1
yi (10)
wherewiis the weighting coefficient andyiis the experimental data point.
2= n
i=1
wi
yi− ∧ yi 2(11)
whereˆyiis the theoretical data point calculated by the model.
2red= 2
(12)where2redis the reduced chi-square value andțis the number of degrees of freedom.
Table 3shows the results of nonlinear regression analysis of kinetic data. Plots ofqtagainsttare shown inFig. 5a–c for the kinetic data and nonlinear fits for pseudo-first- and second-order kinetic models (experimental kinetic data available in Supplementary Table 1). As can be seen inTable 3, both values ofR2and2obtained from fitting the experimental data to the pseudo-second-order model were higher and lower in comparison with pseudo-first-order model, respectively. Furthermore, when the experimental equilibrium adsorption capacity (qe,exp) is compared to the esti-mated equilibrium adsorption capacity (qe,est), it is noticeable that the values provided by the pseudo-second-order model were closer than those provided by the pseudo-first-order model, indicating that the pseudo-second-order model better describes the adsorp-tion kinetics of Co2+, Cu2+, and Ni2+on the STA. The ratios ofk2,Co/Cu, k2,Ni/Coandk2,Ni/Cuare 1.12, 9.72, and 10.9, respectively. This means that Ni2+ is adsorbed by STA almost 10 times faster than Co2+ and Cu2+. This finding indicates that it would be possible to make a kinetic separation of Ni2+with respect to Co2+ and Cu2+ in a multicomponent ion solution if a low agitation time is used. For example, the separation of Co2+, Cu2+, and Ni2+from aqueous solu-tions is often required in hydrometallurgy processing (Po´spiech and Walkowiak, 2007) and industrial wastes (Yavuz et al., 2003).
3.2.3. Adsorption isotherms
Adsorption isotherms describe how various types of pollutants interact with the adsorbent materials, and, therefore, are critical in the elucidation of the adsorption mechanism, and in determining the equilibrium adsorption capacity and their influence on the sur-face properties on adsorption. Thus, they are crucial in the design of adsorption systems (Ferreira et al., 2015; Foo and Hameed, 2010). Adsorption of Co2+, Cu2+, and Ni2+on the STA was studied in mono-and bi-component aqueous solutions at 25◦C, 130 rpm, 0.2 g/L STA, 0.05–1.12 mmol/L M2+, and an equilibrium time of 300 min (based on kinetic data of Section3.2.2).
3.2.3.1. Monocomponent adsorption.
Monocomponent isotherm equations of Langmuir, Freundlich, Sips, and Redlich–Peterson (R–P) have been used to describe the equilibrium characteristics of adsorption (Srivastava et al., 2006).
The Freundlich isotherm (Freundlich, 1906) derivation assumes adsorption on a heterogeneous surface with a non-uniform dis-tribution of heat of adsorption over the surface. Whereas, the Langmuir isotherm (Langmuir, 1918) assumes adsorption on a
homogeneous surface with the adsorption sites having the same energy or equal affinity for the adsorbate (Srivastava et al., 2006).
The Sips (Langmuir–Freundlich) isotherm (Sips, 1948) can be described as follows in Eq.(13):
qe=Qmax (bCe) 1⁄n
1+(bCe)1⁄n
(13)
where qe (mmol/g) is the equilibrium adsorption capacity, Ce (mmol/L) is the metal ion equilibrium concentration in the solution, Qmaxis the maximum adsorption capacity (mmol/g),b(L/mmol) is the Sips constant related to the energy of adsorption, andnis the parameter characterizing the heterogeneity of adsorption system. If parameternis unity, the Sips isotherm [Eq.(13)] reduces to the Langmuir isotherm [Eq.(16)] for ideal surfaces.
The R–P isotherm (Redlich and Peterson, 1959) can be described as follows in Eq.(14):
qe= KRCe 1+aRCeˇ
(14)
whereKR(L/g) andaR(L/mmol) are the R–P isotherm constants andˇis the R–P isotherm exponent, which is dimensionless and lies between 0 and 1.
For high concentrations, the R–P isotherm [Eq.(14)] reduces to the Freundlich isotherm as follows in Eq.(15):
qe=KFCe1⁄n (15)
whereKF=KR/aRis the Freundlich constant [(mmol/g)(L/mmol)1/n] and n is the heterogeneity factor (1/n= 1−ˇ) (Srivastava et al., 2006).
Forˇ= 1, Eq.(14)reduces to the Langmuir isotherm as follows in Eq.(16):
qe= QmaxbCe
1+bCe (16)
whereb(L/mmol) is the Langmuir constant related to the energy of adsorption andQmax=KR/aRis the maximum adsorption capacity (mmol/g).
Forˇ= 0, Eq.(14)reduces to the Henry’s equation as follows in Eq.(17):
qe= KRCe
1+aR (17)
The change in free energy of adsorption of the system (adsG◦) can be calculated as follows in Eq.(18)(Liu, 2009):
adsG◦= −RTlnKa (18)
where Ka is the thermodynamic equilibrium constant, T (K) is the absolute temperature, and R is the ideal gas constant (8.314 J/K mol).
The thermodynamic equilibrium constant can be calculated from Langmuir constant,b, as follows in Eq.(19)(Liu, 2009):
Ka=
be(1 mol/L)
(19)
whereeis the activity coefficient in the equilibrium (dimension-less) at 25◦C.
Debye–Hückel law [Eq.(20)] to provide a correct calculation of adsG◦, as postulated byLiu (2009).
loge= −0.509z
2
Ie
1+
˛
Ie/305(20)
wherezis the charge of the ion,Ie(mol/L) is the ionic strength in the equilibrium and˛(pm) is the ion size considered as 600 pm for Co2+, Cu2+, and Ni2+(Harris, 2010). The ionic strength was cal-culated using the first equilibrium concentration data point of the plateau of the mono- and bi-component adsorption isotherms.
Monocomponent isotherm model parameters were found using Microcal OriginProTM2015 software by minimizing2as presented in Section3.2.2.
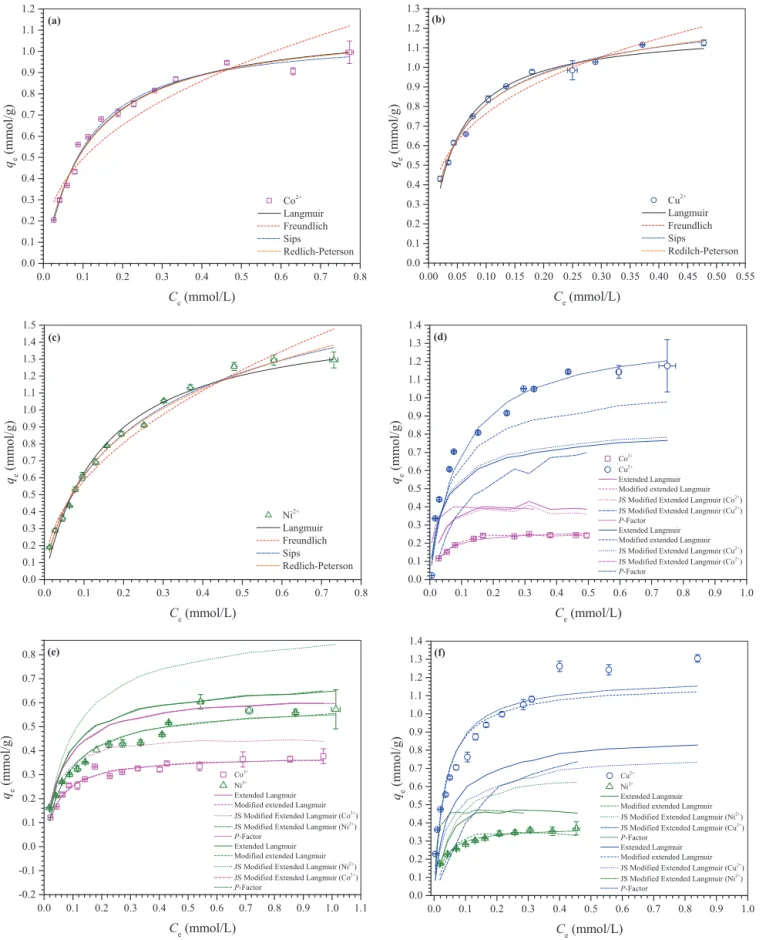
The equilibrium monocomponent adsorption isotherms for the adsorption of Co2+, Cu2+, and Ni2+on the STA at 25◦C, 130 rpm, and 0.2 g/L STA are shown in Fig. 6a–c. The monocomponent adsorption was investigated at pH 5.75 for Co2+and Ni2+and 5.5 for Cu2+.Table 4presents the results of modeling the experimental adsorption data through nonlinear regression analysis for the four monocomponent isotherms (Langmuir, Freundlich, Sips, and R–P) (experimental equilibrium data available in Supplementary Table 2).Table 4shows that considering the values ofQmax,exp,R2, and 2the adsorption of Co2+was best described by the Sips isotherm, whereas the adsorption of Cu2+and Ni2+was best described by the Langmuir isotherm. In fact, the STA presents a heterogeneous surface where carboxylic acid groups compose the majority of the chemical functional groups. However, there are other functional groups, such as phenolic and carbonyl groups, in lignin. Thus, the surface of STA is not composed of adsorption sites with equal energy or affinity to the adsorbate. Therefore, the adsorption sys-tem cannot be considered as fully Langmuirian. In other words, although the Langmuir model failed to describe the adsorption system to a certain degree, the use of estimated Langmuir con-stants for comparison of the STA performance is essential. The Sips isotherm constant,n, can be used as an estimation of the hetero-geneity of the adsorption system, as this isotherm is a combination of Langmuir and Freundlich isotherms. The values ofnfrom the Sips isotherm for the adsorption of Co2+, Cu2+, and Ni2+were rea-sonably close to unity. This suggests that the adsorption system is more Langmuirian than Freundlichian. The maximum metal ion adsorption capacity of the STA adsorbent presented the following order Ni2+> Cu2+> Co2+. Coordination numbers (CNs) higher than unity indicate that more than one carboxylate group is being used to adsorb a metal ion. As the monocomponent adsorption systems were best described by the Langmuir theory, it was decided that the modified Langmuir models would be used to analyze the bicompo-nent adsorption data, which are presented in the next Section.
The difference between physisorption and chemisorption lies in the magnitude of changes in enthalpy and free energy. For physisorption and chemisorption, the values ofadsG◦are in the range from 0 to−20 kJ/mol and−80 to−200 kJ/mol, respectively (Húmpola et al., 2013). The values ofadsG◦ for adsorption of Co2+, Cu2+, and Ni2+on the STA are in the range from−22.8 to −25.2 kJ/mol, which is slightly higher than physisorption and lower than chemisorption, suggesting that a mixed mechanism may be controlling the uptake of metal ions on STA. Further evidence that can be used to understand the mechanism controlling the uptake of Co2+, Cu2+, and Ni2+on the STA is the shift of the carboxylate band in the FTIR spectra, which indicates the complete deprotonation of carboxylic acid groups during the adsorption process. This shift in the carboxylate band in the FTIR spectra also indicates that valence electrons from carboxylate groups are being used to complex metal ions. However, considering the magnitude ofadsG◦, it is possible to suggest that fairly weak bond was formed between the
carboxy-late groups and metal ions studied. This finding will be confirmed from desorption data, which are presented in Section3.3.
3.2.3.2. Multicomponent adsorption.
Three bicomponent adsorption systems Co2+–Cu2+, Co2+–Ni2+, and Cu2+–Ni2+were modeled using three predictive models: (1) the non-modified competitive Langmuir model, (2) the Jain and Snoeyink (J–S) modified extended Langmuir model, and (3)P-factor and one correlative or semi-predictive: modified extended Lang-muir model (interaction factor). The binary mixtures of metal ions were equimolar (Ci=Cj) with concentrations varying from 0.05 to 1.12 mmol/L.
The non-modified competitive Langmuir model (Butler and Ockrent, 1930) is an extension of the Langmuir isotherm model for a componentiin a system withNcomponents and it can be described as follows in Eq.(21):
qe,i= Qmax,ibiCe,i
1+ N
j=1
bjCe,j
(21)
whereQmax,iandbare the Langmuir constants derived from mono-component Langmuir isotherm for mono-componentsiandj.
The J–S modified extended Langmuir model (Jain and Snoeyink, 1973) is a bicomponent adsorption model developed to model non-ideal adsorption systems. Contrary to the non-modified extended Langmuir model, the J–S model accounts for competitive adsorp-tion. The J–S model can be described as follows in Eqs.(22)and (23):
qe,i=
Qmax,i−Qmax,j
biCe,i 1+biCe,i
+ Qmax,jbiCe,i 1+biCe,i+bjCe,j
(22)
qe,j= Qmax,jbjCe,j
1+biCe,i+bjCe,j (23)
whereQmaxandbare the Langmuir constants derived from mono-component Langmuir isotherm for mono-componentsiandj. The first term (Qmax,i−Qmax,j) on the left-hand side of Eq.(22)refers to the amount of soluteiadsorbed without competition from solutej; whereas, the second term on the right-hand side of Eq.(22)refers to the amount of soluteiadsorbed in competition with solutej.
TheP-factor is a correlative technique developed byMcKay and Al Duri (1987). This model assumes a Langmuir isotherm and can be described as follows in Eq.(24):
qe,i,multi= 1 Pi
KL,iCe,i,multi 1+aL,iCe,i,multi
(24)
wherePiis a “lumped” capacity factor and can be defined as follows in Eq.(25):
Pi=
(KL,i/aL,i)mono KL,i/aL,imulti =
Qmax,mono
Qmax,multi (25)
where (KL,i/aL,i)monoand (KL,i/aL,i)multiare the maximum adsorp-tion capacities for component i in a monocomponent and multicomponent system, respectively.
The modified extended competitive Langmuir model is also an extension of the Langmuir isotherm model for a componentiin a system withNcomponents that incorporates an interaction factor, [Eq.(26)] (Mathews and Weber, 1980).
qe,i= Qmax,ibi
Ce,i/i
1+ N
j=1
bj
Ce,j/jTable 4
Results of modeling the equilibrium adsorption isotherm with monocomponent isotherm models (25◦C, 130 rpm and 0.2 g/L STA).
Monocomponent
Isotherm model Parameters Co2+ Cu2+ Ni2+
Qmax,exp(mmol/g) 0.950±0.026 1.121±0.005 1.295±0.000
pH 5.75 5.5 5.75
te(min) 180 250 75
CN 3.98 3.37 2.92
Ie(mol/L) 0.0515 0.0523 0.0521
e 0.886 0.886 0.886
Langmuir Qmax,est(mmol/g) 1.140±0.034 1.197±0.028 1.563±0.066
b(L/mmol) 8.87±0.67 22.95±1.76 6.73±0.65
R2 0.9864 0.9804 0.9835
2red 0.0018 0.0015 0.0038
adsG◦ −22.83±1.72 −25.19±1.93 −22.15±2.14
Freundlich K[mmol/g/(L/mmol)1/n] 1.241±0.082 1.501±0.064 1.711±0.064
n 2.50±0.23 3.41±0.23 2.14±0.10
R2 0.9083 0.9553 0.9772
2
red 0.0123 0.0035 0.0052
Sips Qmax,est(mmol/g) 1.067±0.052 1.379±0.105 2.153±0.262
b(L/mmol) 10.36±1.17 15.98±3.66 2.88±0.96
n 0.89±n0.08 1.34±0.16 1.34±0.10
R2 0.9874 0.9884 0.9931
2
red 0.0017 0.0009 0.0016
Redlich–Peterson KR(L/g) 10.03±1.15 37.81±6.41 16.84±3.22
aR(L/mmol) 8.82±0.95 28.78±4.20 10.03±1.89
b 1.00±0.07 0.90±0.04 0.76±0.06
R2 0.9851 0.9869 0.99
2red 0.002 0.001 0.0023
whereiandjare interaction factors that can be estimated from
competitive adsorption data.
The predictive multicomponent adsorption isotherms were fed with monocomponent parameters obtained from nonlinear
regres-sion analysis of the Langmuir model, as presented in Table 4.
The Microsoft ExcelTM 365 software for WindowsTM was used
to calculateR2 and2using equilibrium concentrations for each metal ion. The interaction factor of the semi-predictive model (fed with monocomponent parameters from Langmuir model) was obtained by minimizing2using Microcal OriginProTM2015 software as described in Section 3.2.2. The Langmuir isotherm was also used to estimate multicomponent isotherms in order
Table 5
Results of equilibrium adsorption isotherm modeling, using multicomponent isotherm models (25◦C, 130 rpm and 0.2 g/L STA).
Bicomponent systems
Isotherm model Parameters Co–Cu Cu–Co Co–Ni Ni–Co Cu–Ni Ni–Cu
Qmax,exp,i(mmol/g) 0.246±0.003 1.154±0.019 0.368±0.007 0.576±0.019 1.283±0.022 0.365±0.007
Qmax,exp,i+j(mmol/g) 1.400±0.019 0.944±0.021 1.658±0.023
Qmax,exp,i,multi/Qmax,exp,mono 0.259 1.030 0.388 0.445 1.145 0.282
pH 5.5 5.5 5.5 5.5 5.5 5.5
te,mono(min) 250 250 180 180 250 250
Ie(mol/L) 0.0531 0.0554 0.0535
e 0.886 0.886 0.886
Langmuir Qmax,est(mmol/g) 0.272±0.006 1.361±0.128 0.380±0.008 0.593±0.025 1.165±0.067 0.376±0.009
b(L/mmol) 27.47±2.78 10.47±2.71 20.32±1.70 12.70±1.82 30.19±6.20 38.51±4.52
R2 0.9702 0.9588 0.9732 0.9365 0.9213 0.9548
2red 0.0004 0.0262 0.0007 0.0035 0.0139 0.0007 adsG◦ −32.61±3.30 −30.36±2.32 −24.89±2.08 −23.73±3.39 −25.87±5.31 −26.48±3.11
Non-modified extended Langmuir
R2 0.4237 0.7859 0.5822 0.9579 0.8766 0.8562
2red 0.1128 0.0957 0.1173 0.0014 0.1006 0.0046
Modified extended Langmuir
i 2.178±0.089 1.571±0.517 1.378±0.099 1.366±0.161 0.735±0.151 1.440±0.192
j 1.149±0.070 6.000±7.869 0.539±0.052 1.069±0.185 10.000±19.217 0.942±0.194 R2 0.9798 0.9195 0.9665 0.9338 0.9224 0.7255
2red 0.0003 0.0511 0.0009 0.0036 0.0144 0.0044
Jain and Snoeyink (J–S) modified extended Langmuir
R2
i 0.5392 0.7988 0.9048 0.7581 0.7493 0.5281
2red,i 0.0919 0.0900 0.0282 0.1008 0.1639 0.1418 R2j 0.4798 0.7125 0.9577 0.9793 0.8562 0.8856
2
red,j 0.3541 0.0986 0.0216 0.0123 0.0459 0.4262 P-factor Pi 4.200 0.879 3.003 2.638 0.995 4.163
KL,i 31.32±2.64 12.52±2.37 23.17±1.59 19.86±2.20 33.15±5.38 60.20±5.98 aLi(L/mmol) 27.47±2.80 10.47±2.72 20.32±1.70 12.70±1.83 27.72±5.62 38.52±4.55
R2 0.9702 0.9588 0.9732 0.9365 0.9211 0.9548 2
to obtain Langmuir constants Qmax and b, which are shown in Table 5.
Bicomponent adsorption occurred at pH 5.5, 25◦C, and 0.2 g/L STA. Fig. 6d–f shows the plots for binary equimolar adsorp-tion systems Co2+–Cu2+, Co2+–Ni2+, and Cu2+–Ni2+, respectively. Table 5shows the results of modeling the bicomponent experimen-tal adsorption data with four multicomponent isotherm models (experimental equilibrium data available in Supplementary Table 3). The equilibrium adsorption data for binary metallic systems can also be discussed in terms of maximum adsorption capac-ity of a metal ion iin the presence of another metal ion j, in comparison, when i is present alone in the aqueous solution (Qmax,exp,i,multi/Qmax,exp,mono). For Qmax,exp,i,multi/Qmax,exp,mono> 1, the adsorption of speciesiis promoted by the presence of the speciesj. ForQmax,exp,i,multi/Qmax,exp,mono= 1, there is no noticeable net interaction betweeniandj. ForQmax,exp,i,multi/Qmax,exp,mono< 1, the adsorption of speciesiis suppressed by the presence of the speciesj(Ronda et al., 2013). As can be seen inTable 5, the adsorp-tion of Co2+and Ni2+is suppressed in the presence of Cu2+, whereas the adsorption of Ni2+ is favored in the presence of Co2+. The Pearson parameter (ı) for Co2+, Cu2+, and Ni2+ is 0.130, 0.104, and 0.126, respectively. These cations are considered as border-line Lewis acids, whereas a carboxylate ligand, such as an acetate ion, is considered as a hard Lewis base. However, the two carboxy-late groups from a trimellitate moiety grafted onto STA behave as very weakly basic, negatively charged, oxygen-donor groups that are stabilized by resonance. Thus, based on the experimental mul-ticomponent data, it is possible to conclude that these carboxylate groups have a higher affinity for Cu2+ than Ni2+ and Co2+. The obtained results are in good agreement with the softness order of metal ions studied (Cu2+> Ni2+> Co2+). These results are also in good agreement with the Langmuir constants (bCu2+>bCo2+>bNi2+), considering the slight difference in the Pearson parameter for Co2+and Ni2+(Table 4). These data also suggest that there is the possibility to separate Ni2+from Co2+and Ni2+from Cu2+using kinetic and thermodynamic control on the basis of kinetic (k2,i/k2,j) and isotherm data (Qmax,exp,i,multi/Qmax,exp,mono) using a fixed-bed adsorption column system, controlling the inlet flow rate and con-centration of each metal ion. This finding can be very useful for treating effluents from acid mine drainage, industrial wastewaters, and in the pre-concentration steps of hydrometallurgical processes. The adsorption of single, binary, and ternary systems of Co2+, Cu2+, and Ni2+in aqueous solutions using a fixed-bed column is the focus of subsequent parts of this paper.
Factors affecting the preference of STA for a specific metal ion may be related to the characteristics of the adsorption sites, that is, the functional groups present in its surface and the properties of the metal ions in solution (e.g., concentration, ionic size, primary and secondary valence, and coordination number) as well as the solution characteristics (e.g., pH, ionic strength, and presence of different counter ions) (Srivastava et al., 2006).
The values ofadsG◦for a multicomponent system were slightly more negative than theadsG◦ value of a monocomponent sys-tem. The values of adsG◦ indicate that adsorption was more favorable in multicomponent systems compared to the monocom-ponent systems. Considering the values ofadsG◦, there is no clear experimental evidence for a change in the adsorption mechanism controlling the uptake of metal ions in the binary system in relation to single system. However, inFig. 6e, it is noticeable that a double layer seems to have been formed, which was indicated by the for-mation of a second plateau in the isotherm of the Co–Ni binary system. It favored the adsorption of Ni2+rather than Co2+. In binary systems Co–Cu and Cu–Ni, this behavior was not observed.
As can be seen inTable 5, comparing the three binary adsorp-tion systems, higher R2 and lower2 values were obtained by fitting the modified extended Langmuir andP-factor models to the
experimental adsorption data. Non-modified extended Langmuir and J–S modified extended Langmuir models exhibited a poor fit to the experimental data. These results also confirm that there are interactions between the two metal ions in the three binary adsorp-tion systems. Supplementary Fig. 3 shows the plots ofqe,estagainst qe,expfor the three binary adsorption systems and four competitive adsorption models tested. Supplementary Table 4 shows the slope and the intercept from plots of estimated (qe,est) against experi-mental maximum adsorption capacities (qe,exp) for all competitive adsorption models tested. Supplementary Fig. 3a–f shows plots of qe,estversusqe,expfor the three bicomponent systems studied. In these graphs, most of the data points are distributed around the 45◦ dashed line, with 95% of confidence interval, for modified extended Langmuir andP-factor models. For these models, the slopes and intercepts were closer to unity and zero, respectively, which indi-cates that these multicomponent models could estimateqe,estfrom the experimental data very well.
The maximum metal ion adsorption capacities in the binary sys-tems (Qmax,exp,i+j) (Table 5) were lower than the sum of the single maximum adsorption capacities for each metal ion. Similar results were observed bySrivastava et al. (2006)for the adsorption of Cd2+and Zn2+on bagasse fly ash in mono- and bi-component sys-tems. According toSrivastava et al. (2006), this result may imply that there is a variety of adsorption binding sites on the adsor-bent surface exhibiting partially specific affinity to the single metal ions. These conclusions seems to violate the assumptions of the Langmuir isotherm theory, that is, the adsorbent surface is homo-geneous, there is no preferential adsorption and lateral interaction between adsorbates, and the affinity of each adsorption site by the adsorbate is uniform. Although the Langmuir isotherm theory fails, to a certain degree, to fully describe the adsorption behavior of binary systems, the use of a modified extended Langmuir model seemed reasonable, as the interaction factor took into account the deviations from the non-modified extended Langmuir model and its assumptions. According toChoy et al. (2000), theP-factor model cannot account for all competitions and interactions that may influence the competitive adsorption, resulting in some devi-ations betweenqe,estandqe,exp. However, according to analysis by Choy et al. (2000), theP-factor model provides a major enhance-ment over the data estimated by the extended Langmuir model. The obtained results in this study are in good agreement with the anal-ysis ofChoy et al. (2000), as the estimation ofqevalues provided by P-factor was better than the extended Langmuir model.
3.3. Desorption and reuse of the spent adsorbent
The desorption of STA-loaded with Co2+, Cu2+, and Ni2+was per-formed using a batch process at 25◦C and 130 rpm with 20.0 mL of 1.0 mol/L HNO3 for 5 min. The desorption percentage, Edes, was 100% for all metal ions studied. The suggested mechanism for the desorption of metal ions from STA-loaded with Co2+, Cu2+, and Ni2+is that of ion exchange, in which metal ions are exchange by hydronium ions. Desorption tests with 0.05 mol/L ClCH2COOH/ClCH2COONa buffer (pH 2) were also performed. These tests revealed that the monochloroacetate/monochloroacetic acid buffer was efficient in desorbing the metal ions from STA. The desorption efficiency attained was about 50%. The reason for the desorption efficiency of the buffer solution being lower than nitric acid solution was the change in the pH of the buffer solution to higher values (pH > 2) during the desorption process. This result proves that ion exchange is the mechanism controlling the desorp-tion process.
Table 6
Comparison ofQmaxfor removal of Co2+, Cu2+, and Ni2+by various adsorbents.
Adsorbent Qmax(mmol/g)a Reference
Co2+ Cu2+ Ni2+
PET-g-(MAA/AAm) 0.461 0.492 0.741 Cos¸kun et al. (2006)
Sp–HPBA 0.039 0.043 0.036 C¸imen et al. (2013)
Palygorskite (Brazil) 1.604 1.279 0.078 Oliveira et al. (2013)
BANPA 0.56 0.49 0.55 Rodrigues et al. (2013)
BANMA 0.27 0.29 0.47 Rodrigues et al. (2013)
PAMMAm 0.122 0.201 0.104 Kushwaha et al. (2013)
Sil–NSuc 1.85 1.04 1.89 Arakaki et al. (2013)
Celam biopolymer 0.097 0.102 0.077 Silva Filho et al. (2013)
STA 1.140 1.197 1.563 This study
aMaximum adsorption capacities obtained from the Langmuir model at 25◦C.
proves that there was no ester bond hydrolysis during desorption experiments. Furthermore, the study of re-adsorption of Co2+, Cu2+, and Ni2+using the spent STA adsorbent demonstrated that the re-adsorption efficiency was 100% for all metal ions studied. These results prove that the STA adsorbent can be recovered and reused without loss in its adsorption capacity. The results of the studies of desorption and re-adsorption demonstrates that it is possible to recover both the metal ions and the STA adsorbent, which improves the economic feasibility of the proposed adsorption process.
3.4. Comparison with previously reported data for Co2+, Cu2+,
and Ni2+adsorption
Table 6shows various adsorbents that have been used to remove Co2+, Cu2+, and Ni2+from aqueous solutions, as reported in previous studies, for comparison purposes. Comparing the STA adsorbent with some previously reported adsorbents used for the removal of Co2+, Cu2+, and Ni2+, it is possible to conclude that the STA adsor-bent is one of the most powerful adsoradsor-bents synthesized for this purpose.
4. Conclusions
Sugarcane bagasse modified with trimellitic anhydride (STA) was successfully synthesized and characterized by FTIR, elemen-tal analysis, TGA, and PZC measurements. The percent weight gain and number of carboxylic acid groups were found to be 73.9% and 3.78 mmol/g, respectively. The STA adsorbent was efficient in removing Co2+, Cu2+, and Ni2+from single and binary component aqueous solutions. The adsorption kinetics followed the pseudo-second-order model. The experimental data fitted very well to the Langmuir and Sips isotherm models. The equilibrium time obtained from the kinetic study and the monocomponent maximum adsorp-tion capacity determined by Langmuir model for adsorpadsorp-tion of Co2+, Cu2+, and Ni2+were 180, 250, and 75 min and 1.140, 1.197, and 1.563 mmol/g, respectively. The bicomponent adsorption studies demonstrated that the adsorption of Co2+and Ni2+is suppressed in the presence of Cu2+, and Ni2+suppresses the adsorption of Co2+. The bicomponent data fitted very well to the modified extended Langmuir andP-factor models. Desorption studies demonstrated that the STA adsorbent can be 100% desorbed and reused.
Acknowledgements
The authors are grateful to Universidade Federal de Ouro Preto (UFOP) (for an undergraduate PIP scholarship awarded to F.J. Gonc¸alves) and Fundac¸ão de Amparo à Pesquisa do Estado de Minas Gerais (FAPEMIG) (for an undergraduate PROBIC scholar-ship awarded to M.M.C. Elias) for funding this research (FAPEMIG grant number CEX APQ-00149/12). The authors are also grateful to Coordenac¸ão de Aperfeic¸oamento de Pessoal de Nível
Supe-rior (CAPES) (for an M.S. scholarship awarded to S.N.C. Ramos) and Conselho Nacional de Desenvolvimento Científico (CNPq) (for an M.S. scholarship awarded to F.S. Teodoro) and Laboratório de microscopia eletrônica, microanálises e caracterizac¸ão de materi-ais (NanoLab/FINEP) – RedeMat Escola de Minas, UFOP and B.S. Ney, P. Sampaio for SEM–EDX analyses.
Appendix A. Supplementary data
Supplementary data associated with this article can be found, in the online version, athttp://dx.doi.org/10.1016/j.indcrop.2015.05. 022
References
Ahmad, P., Prasad, N.V., 2011. Environmental Adaptations and Stress Tolerance of Plants in the Era of Climate Change. Springer, New York.
Amin, N.-U., Hussain, A., Alamzeb, S., Begum, S., 2013. Accumulation of heavy metals in edible parts of vegetables irrigated with waste water and their daily intake to adults and children, district Mardan, Pakistan. Food Chem. 136, 1515–1523.
Arakaki, L.N.H., Filha, V.L.S.A., Germano, A.F.S., Santos, S.S.G., Fonseca, M.G., Sousa, K.S., Espínola, J.G.P., Arakaki, T., 2013. Silica gel modified with ethylenediamine and succinic acid-adsorption and calorimetry of cations in aqueous solution. Thermochim. Acta 556, 34–40.
ATSDR, 2014. Support Document to the 2013 Priority List of Hazardous Substances that will be the Subject of Toxicological Profiles. Division of Toxicology and Environmental Medicine, Atlanta, GA, pp. 1–12 (accessed 21.11.14.)http:// www.atsdr.cdc.gov/SPL/resources/ATSDR 2013 SPL Support Document.pdf
Barakat, M.A., 2011. New trends in removing heavy metals from industrial wastewater. Arabian J. Chem. 4, 361–377.
Bhatnagar, A., Sillanpää, M., 2010. Utilization of agro-industrial and municipal waste materials as potential adsorbents for water treatment – a review. Chem. Eng. J. 157, 277–296.
Braude, E.A., Nachod, F.C., 1955. Determination of Organic Structures by Physical Methods. Academic Press Inc., New York, USA.
Butler, J.A.V., Ockrent, C., 1930. Studies in electrocapillarity. Part III: the surface tensions of solutions containing two surface-active solutes. J. Phys. Chem. 34, 2841–2859.
Choy, K.K.H., Porter, J.F., McKay, G., 2000. Langmuir isotherm models applied to the multicomponent sorption of acid dyes from effluent onto activated carbon. J. Chem. Eng. Data 45, 575–584.
C¸imen, A., Bilgic¸, A., Kursunlu, A.N., Gübbük, ˙I.H., Uc¸an, H.˙I., 2013. Adsorptive removal of Co(II) Ni(II), and Cu(II) ions from aqueous media using chemically modified sporopollenin ofLycopodium clavatumas novel biosorbent. Desalin. Water Treat. 52, 4837–4847.
Cos¸kun, R., Soykan, C., Sac¸ak, M., 2006. Adsorption of copper(II), nickel(II) and cobalt(II) ions from aqueous solution by methacrylic acid/acrylamide monomer mixture grafted poly(ethylene terephthalate) fiber. Sep. Purif. Technol. 49, 107–114.
Ferreira, B.C.S., Teodoro, F.S., Mageste, A.B., Gil, L.F., de Freitas, R.P., Gurgel, L.V.A., 2015. Application of a new carboxylate-functionalized sugarcane bagasse for adsorptive removal of crystal violet from aqueous solution: kinetic, equilibrium and thermodynamic studies. Ind. Crops Prod. 65C, 521–534. Foo, K.Y., Hameed, B.H., 2010. Insights into the modeling of adsorption isotherm
systems. Chem. Eng. J. 156, 2–10.
Freundlich, H.M.F., 1906. Over the adsorption in solution. Z. Phys. Chem. Stoch Ve 57, 385–470.
Fu, F., Wang, Q., 2011. Removal of heavy metal ions from wastewaters: a review. J. Environ. Manage. 92, 407–418.
Harris, D.C., 2010. Quantitative Chemical Analysis, 8th ed. W.H. Freeman, New York.
Haynes, W.M., 2014. CRC Handbook of Chemistry and Physics, 95th ed. Taylor & Francis.
Ho, Y.S., McKay, G., 1998. Kinetic models for the sorption of dye from aqueous solution by wood. Process Saf. Environ. Prot. 76, 183–191.
Ho, Y.S., McKay, G., 1999. Pseudo-second order model for sorption processes. Process Biochem. 34, 451–465.
Húmpola, P.D., Odetti, H.S., Fertitta, A.E., Vicente, J.L., 2013. Thermodynamic analysis of adsorption models of phenol in liquid phase on different activated carbons. J. Chil. Chem. Soc. 58, 1541–1544.
Jain, J.S., Snoeyink, V.L., 1973. Adsorption from bisolute systems on active carbon. J. Water Pollut. Control Fed. 45, 2463–2479.
Karnitz, O., Gurgel, L.V.A., de Freitas, R.P., Gil, L.F., 2009. Adsorption of Cu(II) Cd(II), and Pb(II) from aqueous single metal solutions by mercerized cellulose and mercerized sugarcane bagasse chemically modified with EDTA dianhydride (EDTAD). Carbohydr. Polym. 77, 643–650.