Benchmarking some Portuguese S&T
system research units: 2nd Edition
Couto, Francisco M; Faria, Daniel; Tavares, Bruno;
Gon¸calves, Pedro; Verissimo, Paulo
DI–FCUL–TR–2013–03
DOI:10455/6893
(http://hdl.handle.net/10455/6893)
October 2013
Published at Docs.DI (http://docs.di.fc.ul.pt/), the repository of the Department of Informatics of the University of Lisbon, Faculty of Sciences.
Benchmarking some Portuguese S&T system
research units (2nd Edition)
Francisco M. Couto
Daniel Faria
Bruno Tavares
Pedro Gon¸calves
Paulo Verissimo
LaSIGE, University of Lisbon, Portugal
Abstract
The increasing use of productivity and impact metrics for evaluation and comparison, not only of individual researchers but also of institutions, universities and even countries, has prompted the development of biblio-metrics. Currently, metrics are becoming widely accepted as an easy and balanced way to assist the peer review and evaluation of scientists and/or research units, provided they have adequate precision and recall.
This paper presents a benchmarking study of a selected list of rep-resentative Portuguese research units, based on a fairly complete set of parameters: bibliometric parameters, number of competitive projects and number of PhDs produced. The study aimed at collecting productivity and impact data from the selected research units in comparable conditions i.e., using objective metrics based on public information, retrievable on-line and/or from official sources and thus verifiable and repeatable. The study has thus focused on the activity of the 2003-2006 period, where such data was available from the latest official evaluation.
The main advantage of our study was the application of automatic tools, achieving relevant results at a reduced cost. Moreover, the results over the selected units suggest that this kind of analyses will be very useful to benchmark scientific productivity and impact, and assist peer review.
1
Introduction
Bibliometric analysis is becoming widely accepted as an easy and balanced way to measure the research impact and relevance of scientists, institutions and even countries [2, 15]. It assumes that citations are references to work that have influenced the author, and therefore are an evidence of the impact and relevance of the cited work [20]. Bibliometric analysis depends mainly on two components: Bibliographic Dataset: from where we retrieve the citations referencing the
work of a given scientist;
Citation Metric: a mathematical formula that produces an unique number quantifying the impact and relevance of a given scientist from its citations.
The most popular bibliographic datasets nowadays are Google Scholar1,
Sco-pus2and Web of Science3(Thomson/Reuters). All have advantages and
disad-vantages in relation to the accuracy of data they provide [3,5,8,21,22], however, Scopus and Web of Science are subscription-based, which means that their ac-cess is restricted to institutions that subscribe them [12]. Furthermore, they only includes citations published in indexed journals selected by their own cri-teria [23]. Emerging fields such as computer science and electrical and computer engineering, are particularly affected by this lack of coverage, as demonstrated by some studies, notably [9]. Thus, although the Web of Science or Scopus are widely used today, one may question their value for generic bibliometric analysis, since one would expect this analysis to be based on a fully-accessible, democratic and comprehensive dataset. By contrast, Google Scholar provides a freely available and comprehensive bibliographic dataset, even if it includes some erroneous entries.
Several citation metrics have been defined and tested, such as the number of highly cited papers, the mean number of citations per paper and the total number of citations. A recent and popular metric was proposed by Hirsch, the h-index [13], defined as follows:
A scientist has index h if h of his or her N p papers have at least h citations each and the other (N p − h) papers have ≤ h citations each.
While it has its shortcomings, the appeal of h-index is clear: it contributes to the ranking of scientists using a single value accounting for production and impact that is straightforward to calculate and fairly robust [2, 4, 11, 24].
In citation metrics, self-citations cannot be neglected since they represent a significant percentage of the citations [1, 16]. Self-citation allows authors to connect their recent work to their previously published findings, and thus are legitimate and necessary to contextualize recent work and avoid text repetition. However, using self-citations for calculating citation metrics would not be rea-sonable, since the goal of citation metrics is to measure the scientist’s impact on his or her peers. Recent works compared different bibliographic datasets [5], citation metrics [14], and measured the impact of self-citations [25].
We believe that objective metrics are crucial to evaluate the output and impact of research units. Lack of completeness, on the one hand, creates un-acceptable competitive disadvantage across research areas. Lack of precision, like self-citations or miscitations, on the other hand, compromises the
trust-worthiness of results. Attempting to address these problems, we developed
CIDS (Citation Impact Discerning Self-citations) a tool that automates the post-processing of raw publication and citation data [6]. Amongst other func-tions, it allows the profiling of publications and citafunc-tions, both from individual researchers and whole groups, units or departments. The root source of data is Google Scholar, which mitigates the completeness problem. Additionally, the information is post-filtered and cleaned and in particular, self-citations are re-moved to address the trustworthiness problem - a facility we believe is unique in existing tools. CIDS has been positively evaluated by a number of institutions, both national and international.
1
http://scholar.google.com
2http://www.scopus.com/
The main advantage of our work is the application of automatic tools after an initial more labour intensive set-up (e.g. tuning the search keys). These tools enable us to extend and update the results with minimal human intervention and thus achieve relevant results at reduced cost. Overall, the results over the selected research units demonstrate the feasibility of applying such an approach in a research evaluation setting. If extended to all units in a given field and updated regularly, our approach could constitute a very useful tool to benchmark scientific productivity and impact, and possibly assist the peer review process.
While bibliometrics are essential to assess research units, they tell only one part of the story. Looking at the standard practice of international academic evaluation, we include in this study what we believe to be a fairly complete set of productivity and impact metrics: bibliometrics (publications and citations); number of competitive projects and number of PhDs produced.
Finally, an important facet of trustworthiness is representativity and re-producibility of the data sets. With that aspect in mind, having a clear-cut period and set of information is instrumental for the acceptance of a study by stakeholders and readers. Such opportunities are for example given by official research system evaluation cycles, which provide public information about the aforementioned parameters of comparable nature in content and period for all units under evaluation. Thus, our study focused on research units belonging to
the Portuguese Funda¸c˜ao para a Ciˆencia e a Tecnologia (FCT) sponsored
scien-tific and technological system (“SC&T”) and was based on data from latest the FCT evaluation. The study focused in particular on research units in our field
of interest, the area called Engenharia Electrot´ecnica e Inform´atica (EE&I) in
the FCT classification, which encloses what in anglo-saxon terms is described by the collection of Electrical Engineering and Computer Science and Engineering. These sectorial benchmarking studies are essential in any excellence system and common in developed countries. However, they are not widely disseminated yet in Portugal, so this is our contribution to that objective.
This paper extends the previous edition [7], along similar lines with ad-ditional research units but the same reference period. The objective was to increase representativity of the sample of selected units, within the limitations of our scarce team resources, and to significantly revise the structure and presen-tation of the study, all in antecipation of the next evaluation cycle. The paper is structured as follows: Section 2 introduces the rationale of the study, explain-ing the reason behind the parameters and research units selection. Section 3 describes how the study was conducted, explaining its information sources, in-formation retrieval and processing methodology used, and the data quality tests performed. Section 4 presents the results obtained in terms of gross and per capita weight and relevance, and its distribution by unit members. Section 5 ends with our main conclusions and futures directions.
2
Rationale of the study
We have focused on a specific period, 2003-2006 inclusive, since this was the
reference period concerning the latest evaluation4 performed by the Funda¸c˜ao
para a Ciˆencia e a Tecnologia (FCT), whose mission is to continuously promote
the advancement of scientific and technological knowledge in Portugal. The FCT
evaluation reported all units in similar terms so that all units would be in equal conditions, in respect to information publicly available. Besides the intrinsic value to our study, a side effect of using the data of the evaluation period is the ability to match our findings with the very FCT evaluation results, published
in R&D Units Evaluation Results - 20075. Regrettably, that information is
only partial for the latest evaluation, since the results of the evaluation of the research units belonging to associate laboratories (“LA”, see ahead) were never published.
Fair and open calculation of bibliometric statistics depends on the avail-ability of a comprehensive database of publications, such as Google Scholar. To explore Google Scholar we used our freely available web tool CIDS (Cita-tion Impact Discerning Self-cita(Cita-tions) to calculate bibliometric parameters with and without self-citations. As mentioned earlier, besides bibliometric, we in-cluded other complementary production parameters in the study: the number of concluded PhDs, and the competitive national and international projects conducted during the evaluation period. These parameters complete each other and together constitute objective indicators of the fulfilment of qualitative and quantitative goals of a research unit, especially in comparison with its peers in the same circumstances.
2.1
Terms of Reference for the units analysed
In this work, we followed the terms of reference and selection criteria described below.
In the Portuguese S&T system there are research units and associate labo-ratories (“LA”). The latter are larger units, which associate several formal or informal research units (large groups). LAs are considered by the government as SC&T system flagships and are considerably better financed per PhD than regular units. LAs were part of the same cycle and reported in the same way as regular units. Actual timelines have varied according to the real execution of the process, which involved for example complaints (56% of the research units (14/25) complained about the evaluation) and re-evaluations. Initial evalua-tions were all based on a 4-year activity report 2003-2006. Re-evaluation results for research units were finally announced in January 2010, a year later, and 2.5 years after the evaluation actually started. Evaluation of the LAs was deemed as ended in 2011, almost 5 years after the activity period concerned, but no results were made public.
We needed a representative set of units for performing our benchmarking experiments. It was materially impossible to treat all units, at least in this phase and so, the units were selected to depict several grades and interesting comparative situations (grading, initial vs. re-evaluation results, etc.). Having a mix of stand-alone research units and LA-based units/groups was also a goal, so we included three associate laboratories in the study. ISR and IT are large LAs composed of several units/groups. We chose ISR Lisbon (ISR-LX) and the IT unit located in Lisbon (IT-LX). INESC-ID is a rather homogeneous LA located in Lisbon. Overall we selected 8 units, listed in alphabetic order with their main locations: CISTER (Porto, ISEP), CISUC (Coimbra, FCTUC), CITI
(Lisbon, FCTUNL), INESC-ID (Lisbon, IST), ISRC (Coimbra, FCTUC), ISR-LX (Lisbon, IST), IT-ISR-LX (Lisbon, IST), LaSIGE (Lisbon, FCUL):
• CISTER, initially rated Very Good (VG), was promoted to Excellent (EX) after re-evaluation.
• CISUC, initially rated Good (GD), was promoted to VG after re-evaluation. • CITI, initially rated GD, remained so after re-evaluation.
• INESC-ID, the grade was not public at the date of this report.
• ISRC was the only unit considered Excellent (EX) in the initial evaluation. • ISR-LX, the grade was not public at the date of this report.
• IT-LX, the grade was not public at the date of this report. • LaSIGE, initially rated VG, remained so after re-evaluation.
We based our experiment on public information, retrievable on-line and/or from official sources and thus verifiable and repeatable. Despite our verifica-tions, the experiment may not be exempt from some residual errors in individ-ual entries of the source repositories, since it is based on automated procedures. However, the experiment has a controlled error margin, as we will discuss sub-sequently in the Data Quality section. The error margin is negligible for most of the situations and is similar across researchers and units. Furthermore, it is bet-ter than what could be achieved by direct query to WoS, GS, DBLNP, Harzing, or related repositories. Nevertheless, we offered each selected unit the possibility of verification of their data, but only committed to correct information which is of official value and obeying the ToR for the study.
We are primarily interested in producing aggregate data about institutions, of comparative statistical value. But it should not be construed from our study that we expect that a simple computation can be applied to derive an evaluation of a research unit. However, objective metrics, especially if multi-dimensional and with a good coverage, are certainly a faithful indicator of the fulfilment of qualitative and quantitative objectives of a research unit, and hence an indis-pensable tool for peer reviewing within a research field.
This last line prompts for a word of caution about using metrics directly for comparing productivity and impact of different research fields, since it is bound to create inacceptable competitive disadvantages. This is found in some superficial studies and official bodies’ statistics, though it has long been argued to constitute an unfair practice. Actually, there is now a substantial body of research scientifically demonstrating these points. Certain indexing methods, whilst highly competent for classical fields, have drastically lower precision and recall factors for other, emerging fields, ranging between 30% and 60% lack of coverage in some cases [9]. On the other hand, the sheer rate of production and citation is highly dependent on the field, with e.g., average Hirsch-indices of different fields, of researchers of the same stature and career experience, varying as much as 350% [17].
In summary, we will show below that the parameters chosen for this study perform well, since they provide a good match to usual evaluation terms of reference in international academia, including the official ToRs of the latest
FCT evaluation. We hope this will illustrate the feasibility of applying our methodology and such parameters in a research unit evaluation setting. We plan on further extending the study, but the study itself can be extended by anyone wishing, since the setting and the tools are public.
3
Study Design
A reference parameter of the study is the list of the unit’s exclusive integrated researchers with a PhD (Int-PhD) i.e. its key members, who are not affiliated with another institution. Int-PhD will be used to: compute aggregate bibliomet-ric indicators; compute per capita figures of all indicators. We use the Int-PhD list as of the end of the period in reference (31/12/2006 in this study).
The study focuses on four categories of figures of merit of a unit:
Weight and Relevance - measured by the global output and impact of the collection of Int-PhD, integrated over a reference contributing period. Production and Impact - measured by the outputs and impact of the unit,
specifically over the evaluation period.
Balance - measured by the distribution of the individual Int-PhD’s bibliomet-ric figures computed respectively, over the reference contributing period, and over the evaluation period.
Efficiency - measured by the weighting of the above metrics by the number of Int-PhDs.
The evaluation period (EP) in this study is, as explained, the latest FCT evaluation cycle 4-year period, January 2003 - December 2006 inclusive.
The reference contributing period (RCP) is intended to represent the period of the Int-PhD career’s research achievements and experience that may most directly contribute to the unit. Given that our objective is the aggregate evaluation of a unit and not of its individual researchers, we must measure an Int-PhD’s contributing career to the unit and as such, the data about Int-PhD cannot go arbitrarily back. It has to be in a sufficiently near past considered to have influenced the current period research, which we have chosen to be the double of the evaluation period, i.e. an 8year period from January 1999 -December 2006 inclusive.
The balance metrics are percentile distributions aiming at characterizing how balanced is the contribution of its key human resources to the relevance (long-term indicators) and impact (short-term indicators) metrics.
We compute gross and per capita metrics, since it is fundamental to dis-tinguish between the critical mass of a unit, and the efficiency with which it puts that critical mass at work. In concrete terms, this amounts to making the difference between production of a collection of Int-PhD researchers, e.g. in number of papers or theses, and productivity of that collection, e.g. in number of papers or theses per Int-PhD researcher (or per euro of financing, for that matter). Other figures of merit notwithstanding, efficiency is becoming a primal figure of merit to assess the return of financing of research units in comparable conditions.
3.1
Information Sources
The idea was to gather a number of parameters that could be automatically calculated and would be sufficient to derive an evaluation of a research unit, in terms of the three categories of figures of merit introduced above.
In order to guarantee the fairness and repeatability of the study, we postu-lated the following rules for the parameters:
• be based on a known and generic formula and thus repeatable; • be applicable to every unit;
• be based on public information, retrievable on-line and/or from official sources and thus verifiable and reproducible.
Besides bibliometric parameters, we included two other measurable output items that satisfied the above rules: the number of concluded PhDs, and the na-tional and internana-tional projects conducted during the evaluation period. Over-all we selected and computed the following parameters:
• Weight and Relevance (gross)
1. Number of Int-PhD at the end of the evaluation period
2. Number of unique cited papers over the reference contributing period 3. Number of unique citations to papers published over the reference
con-tributing period
• Production and Impact (gross)
1. Number of unique cited papers over the evaluation period
2. Number of unique citations to papers published over the evaluation period 3. Number of international and national competitive research projects started
during the evaluation period
4. Number of PhD theses produced during the evaluation period
• Efficiency - Weight and Relevance (per capita)
1. Number of unique cited papers for each Int-PhD over the reference con-tributing period
2. Number of unique citations per Int-PhD over the reference contributing period
3. Average Hirsch-index of Int-PhDs over the reference contributing period
• Efficiency - Production and Impact (per capita)
1. Number of unique cited papers for each Int-PhD over the evaluation period 2. Number of unique citations per Int-PhD to papers published over the
eval-uation period
3. Number of international and national competitive research projects per Int-PhD started during the evaluation period
4. Number of PhD theses produced per Int-PhD during the evaluation period
1. Distribution of the Int-PhD’s numbers of cited papers over the reference contributing period
2. Distribution of the Int-PhD’s numbers of citations over the reference con-tributing period
3. Distribution of the Int-PhD’s Hirsch-index over the reference contributing period
• Balance - Impact
1. Distribution of the Int-PhD’s numbers of cited papers over the evaluation period
2. Distribution of the Int-PhD’s numbers of citations over the evaluation pe-riod
The number of unique papers and citations represents the union of the set of papers and citations found for each individual Integrated PhD researcher, thus eliminating repetitions. For example, papers co-authored by unit researchers are only counted once.
As a note, these metrics cover well the several quantitative aspects normally at stake by international criteria, when evaluating a research unit or group or department. Incidentally, they also end-up representing well the quantitatively measurable aspects of the FCT evaluation philosophy, at least judging from the ToR for the latest evaluation:
• Productivity (papers)
• Relevance/Impact (citations, h-index ) • Feasibility (projects)
• Training (PhDs theses)
Thus, our study may provide some insight on the FCT unit’s evaluation results vs. criteria.
3.2
Information retrieval and processing methodology
The target data of this study was thus:
• The publications and citations of Int-PhD measured over two periods: reference contributing period (99-06); and the evaluation period (03-06). • The PhD theses and projects of each unit measured over the evaluation
period (03-06).
The calculation of the parameters was based on the following sources of information:
• Google Scholar (GS) repository (corrected, post-processed and filtered by the CIDS tool).
• FCT web site.
• Multi-annual evaluation report 2003-2006 from units (to the exception of ISRC, whose report was not made available to us; nevertheless, the missing unit’s data was retrieved from the unit’s and FCT’s site).
• Units’ web sites.
Our first step was to obtain the list of Int-PhD researchers of each unit at 31/12/2006 from the FCT web site. From the FCT web site we could not
collect the list of Int-PhD researchers for older dates. For each researcher,
we manually defined a Google Scholar query that best defined his/her list of published papers. This list of queries was given as input to our tool CIDS, a freely available tool that automatically calculates bibliometric parameters based on Google Scholar data. Given the importance of bibliometric parameters in our study, we provide a detailed description of CIDS in a following section. The queries for the researchers were manually updated and executed in 2012.
The number of national and international projects, and the number of con-cluded PhD theses were collected from the unit’s evaluation reports, cross-checked with the unit’s web site or other official sites when needed. We had access to all unit’s evaluation reports to the exception of ISRC, whose report was not made available to us; nevertheless, the missing unit’s data was retrieved from the unit’s and FCT’s site.
3.3
CIDS
To calculate the citation metrics for each selected author, the current version
of CIDS6 only requires a Google Scholar query, normally the last name of the
author together with his/her initials7. Besides the (author:) operator, any
other of the Advanced Scholar Search operators can be included8.
The papers returned by Google Scholar are then individually analyzed. For each paper, CIDS retrieves its citations and its authors’ names. CIDS uses the authors’ names to filter out the self-citations based on the self-citation policy of CiteSeer [19]. CIDS current policy is: marking a citation as a self-citation if at least one of its authors is also an author of the cited paper. In the end, CIDS uses the number citations of each paper to calculate the h-index, the citations-per-paper, and the total number of citations, and uses the number of non-self-citations to calculate the same citation metrics. Thus, CIDS returns two values for each citation metric, one using all citations and the other discerning self-citations.
For example, the query producing the results shown in Figure 1, used ’Lis-bon OR Lisboa’ -author:LF-Couto to disambiguate the author’s name, by only
selecting authors from Lisbon and discarding the author with the initials LF9.
The first table shows the values for each citation metric with and without includ-ing self-citations. The second table shows the number of citations, the number of self-citations, and the number of non-self-citations. Each number is a link to obtain the respective list of citations. Besides HTML, the tool also provides the citation analysis in TSV and BibTeX formats.
A list of individuals can be assigned to a research unit to produce aggregate
values. CIDS calculates two groups of aggregate values: the unique values
and the average values. Unique values are calculated by merging the papers and citations found for all individuals. Thus, these unique values just consider
6http://cids.fc.ul.pt
7Previous releases of CIDS featured the subject area (subject:) operator, which is no longer
supported by GS.
8http://scholar.google.pt/advanced_scholar_search
CIDS v2.2BETA
Citation Impact Discerning Self-citations
Query: (author:f-couto OR author:f-coutoa) "Lisbon OR Lisboa OR author:Silva OR author:Pesquita" -author:LF-Couto -author:FS-Couto subject:eng OR soc 2010-08-23
CIDS is being developed by Francisco Couto at LASIGE
h_index nonself_h_index g_index nonself_g_index cited_papers citations nonself_cits cits_per_paper nonself_cits_per_paper date
10 10 19 16 29 377 292 13.00 10.07 2010-08-23
Title Authors Year Citations nonself self
Facts from textis text mining ready to deliver RebholzSchuhmann, D and Kirsch, H and Couto, F 2005 85 72 13 Measuring semantic similarity between Gene Ontology terms Couto, FM and Silva, MJ and Coutinho, PM 2007 39 32 7 Implementation of a functional semantic similarity measure between geneproducts Couto, FM and Silva, MJ and Coutinho, PM 2003 35 28 7
Semantic similarity over the gene ontology Family correlation and selecting
disjunctive ancestors Couto, FM and Silva, MJ and Coutinho, PM 2005 34 26 8 Metrics for GO based protein semantic similarity a systematic evaluation Pesquita, C and Faria, D and Bastos, H and Ferreira, A and Falcao,
A and Couto, F 2008 34 27 7 Finding genomic ontology terms in text using evidence content Couto, F and Silva, M and Coutinho, P 2005 27 19 8
GOAnnotator linking protein GO annotations to evidence text Couto, FM and Silva, MJ and Lee, V and Dimmer, E and Camon, E
and Apweiler, R and Kirsch, H and RebholzSchuhmann, D 2006 24 21 3 Semantic similarity in biomedical ontologies Pesquita, C and Faria, D and Falcao, AO and Lord, P and Couto, FM2009 17 16 1 Classifying biological articles using web resources Couto, FM and Martins, B and Silva, MJ 2004 15 11 4 Evaluating gobased semantic similarity measures Pesquita, C and Faria, D and Bastos, H and Falcao, A and Couto, F2007 14 10 4 ProFAL Protein functional annotation through literature Couto, FM and Silva, MJ and Coutinho, P 2003 7 5 2 Proteinon A web tool for protein semantic similarity Faria, D and Pesquita, C and Couto, FM and Falcao, A 2007 6 0 6 Improving information extraction through biological correlation Couto, FM and Silva, MJ and Coutinho, P 2003 6 4 2 Figo Finding go terms in unstructured text Couto, FM and Silva, MJ and Coutinho, P 2004 5 5 0
Finding genomic ontology terms in unstructured text Couto, F and Silva, M and Coutinho, P 2005 4 4 0
Measuring semantic similarity between gene ontology terms DKEData and
Knowledge Engineering Couto, F and Silva, M and Coutinho, P 2006 4 2 2 CIKM Proceedings of the th ACM international conference on Information and
knowledge management Couto, F and Silva, M and Coutinho, P 2005 2 1 1 Advanced Data Mining Techonologies in Bioinformatics Idea Group Inc chap Couto, F and Silva, M 2 0 2 Curating extracted information through the correlation between structure and
function Couto, F and Silva, M and Coutinho, P 2 0 2
FIGO Findings GO Terms in UnStructured Text BioCreative Notebook Papers CNB Couto, F and Silva, M and Coutinho, P 2 2 0
Evaluating gobased semantic similarity measures ISMBECCB SIG Meeting Program
Materials Pesquita, C and Faria, D and Bastos, H and Falcao, AO and Couto, F 2007 2 0 2 Classifying biomedical articles using web resources Couto, F and Martins, B and Silva, M and Coutinho, P 2 1 1 Semantic Similarity over the Gene Ontology Family Correlation and Selecting
Disjunctive Ancestors ACM CIKMConference in Information and Knowledge Management
Couto, F and Silva, MJ and Coutinho, P 2005 2 2 0
Automated social network epidemic data collector Lopes, LF and Zamite, JM and Tavares, BC and Couto, FM and
Silva, F and Silva, MJ 2009 2 1 1 Identifying bioentity recognition errors of rulebased textmining systems Couto, FM and Grego, T and Bastos, HP and Pesquita, C and
Torres, R and Sanchez, P and Pascual, L and Blaschke, C 1 0 1 Mining BioLiterature Toward Automatic Annotation of Genes and Proteins Couto, F and Silva, M 1 0 1 Semantic Similarity Match for Data Quality Martins, F and Falcao, A and Couto, FM 2007 1 1 0
Identification of Chemical Entities in Patent Documents Grego, T and Pkezik, P and Couto, F and RebholzSchuhmann, D 2009 1 1 0
Filtering bioentity recognition errors in bioliterature using a casebased approach Coutoa, FM and Gregoa, T and Torresb, R and Sanchezb, P and
Pascualb, L and Blaschkeb, C 2007 1 1 0
a paper or a citation once, even if it is shared by multiple individuals from the same research unit. Average results are calculated just by averaging the individual values for each bibliographic metric.
3.4
Data Quality
The accuracy of CIDS depends on the ability of Google Scholar’s method to correctly identify the names of the authors in the header of the paper. The method is robust in general, since it is relatively simple to automatically detect the header of a paper, with a small error margin. However, a few authors have ambiguous names that can lead CIDS to include papers from homonymous authors [18]. The impact of this problem in our study is residual, and since we aim at evaluating a group of researchers and not specific individuals, we can consider it negligible. However, in order to eliminate any outlier in this particular study, each query was manually verified.
For evaluating the accuracy of CIDS, we crosschecked a manually curated list of 129 cited papers of an Int-PhD researcher with the papers automatically identified by CIDS. We found that 103 of the 105 papers returned by CIDS were in the curated list. This means that CIDS achieved a precision of 96% and a recall of 78%. Moreover, the real recall of CIDS is expected to be even higher than 78%, since in our study CIDS was limited to the first two Scholar result pages for each query due to performance issues, and senior researchers (as was the case) tend to pass this limit.
Considering the existence of other public and well-organised repositories, we made a comparative study of the precision and recall with DBLP, another reference repository. We crosschecked the same manual list with the list of papers assigned by DBLP. We found that 90 of the 91 papers returned by DBLP were also in the curated list. This gives a precision of 99% for DBLP but a recall of only 70%. We also found that all the papers in DBLP were also available in Scholar, which means that, barring one or another exception, including DBLP will not represent an improvement on recall.
We stress that using our tool for individual purposes (e.g. a curriculum) will require a final albeit residual effort of checking and cleaning. That effort seems minimal, as reported by the additional experiment below. We compared the manually curated list of papers and citations of another Int-PhD researcher with the results returned by CIDS. The curated list contained 69 papers and 211 nonself-citations, whereas CIDS returned 67 papers and 207 nonself-citations. Since all the papers and nonself-citations returned by CIDS were also in the cleaned list, we obtained a precision of 100% and a recall of 97% for papers and 98% for non-self citations. This demonstrates that our results based on Scholar queries are quite accurate and complete.
Another issue with Google Scholar (and in general with any automated tool) is the duplication of data, as the same paper can appear multiple times in different entries. This issue influences the number of cited papers and possibly h-index parameters, but not the total citation count. To evaluate the real impact of this issue we calculated the number of distinct Scholar entry pairs with equal titles. We found only 68 pairs from 4,532 distinct entries, which means that the issue affects less than 1.5% of the entries. Furthermore, since most citations tend to be assigned to a single entry in the cases of duplication, the h-index will normally not be affected.
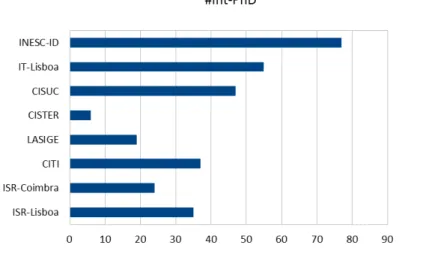
Figure 2: Number of Exclusive Integrated PhD researchers of the unit (#Int-PhD) at the end of the evaluation period (EP).
4
Results
4.1
Gross Weight and Relevance (gross)
Gross results are useful to measure the critical mass of the unit, based on the global weight and relevance of the collection of its Integrated PhD researchers, over their contributing career to the unit. However, they are also biased by the seniority and the size of the unit, as units with more researchers and in particular with more senior researchers will tend to to accumulate more papers and citations. Thus, they do not account for a unit’s efficiency and effectiveness which we will discuss subsequently.
Gross results that were calculated over the reference contributing period (99-06):
1. Number of exclusive integrated PhD researchers of the unit at the end of the evaluation period (#Int-PhD) (Figure 2).
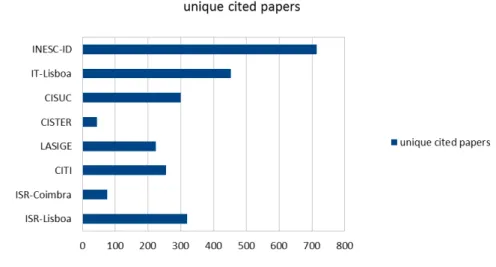
2. Number of unique cited papers (Figure 3): global publication figure cre-ated from the union of the papers found (with at least one citation) over the reference contributing period, from each individual Integrated PhD researcher (thus eliminating repetitions, e.g., papers co-authored by unit researchers are only referred once).
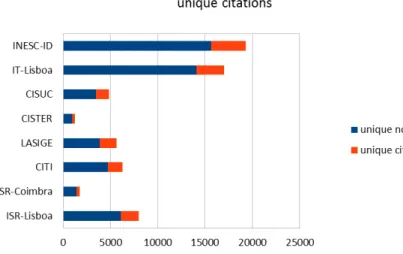
3. Unique citations (Figure 4): global citation figures created from the union of citations found to each of the papers calculated above (thus eliminating repetitions, e.g., citations to papers co-authored by unit researchers are only referred once).
Figure 3: Unique cited papers: union of the sets of papers found for each individual Int-PhD published within the reference contributing period, RCP (1999-2006).
Figure 4: Unique citations: union of the sets of citations found to each of the papers from each individual Int-PhD published within the RCP (1999-2006).
Figure 5: Unique cited papers: union of the sets of papers found for each individual Int-PhD and published within the evaluation period, EP (2003-2006).
4.2
Production and Impact (gross)
Outputs over a period of time provide a measure of the unit’s effectiveness with regard to production (publications, research projects and PhD theses) and corresponding impact (citations). Instead of measuring what a unit seems capable of doing (weight and relevance) they measure what a unit has actually done in a given period of time. However, gross production and impact results are still biased by the size of the unit, as units with more researchers tend to produce more papers and citations per period of time. Thus, these metrics also do not account for a unit’s efficiency, and are of limited use for comparing research units that differ greatly in size.
Gross results that were calculated over the evaluation period (03-06): 1. Unique cited papers (Figure 5): union of the papers found from each
individual Int-PhD published in the period.
2. Unique citations (Figure 6): union of citations found to each of those papers.
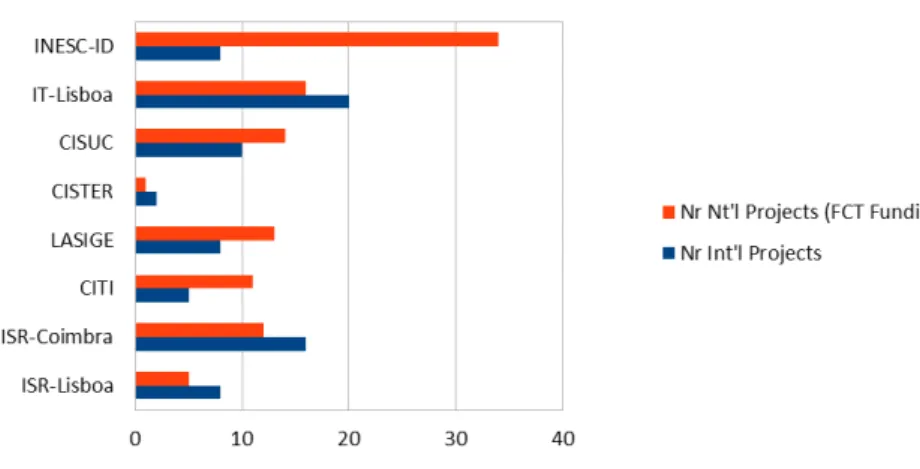
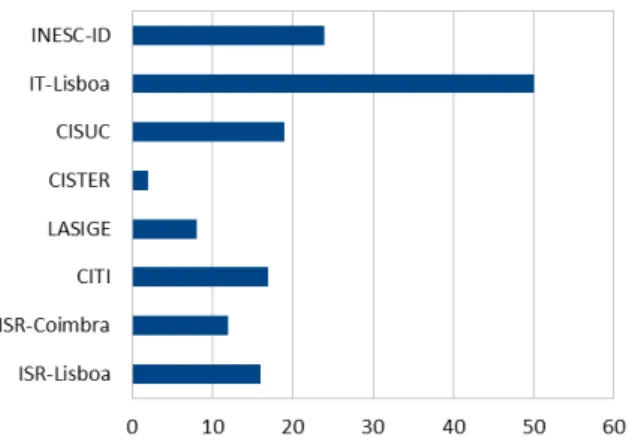
3. National and International projects (Figure 7): numbers of research projects started during the period.
4. PhD theses produced (Figure 8): numbers of PhD theses finished during the period.
4.3
Efficiency - Weight and Relevance per Capita
Weight and relevance per capita results (e.g., figures ’per InT-PhD’) provide some measure of a unit’s relative density, by dividing the gross publication and citation figures (over the reference contributing period) by the number of Int-PhD.
Figure 6: Unique citations: union of the sets of citations found to each of the papers from each individual Int-PhD published within the EP (2003-2006).
Figure 7: National and International projects: numbers of research projects started during the EP (2003-2006).
Figure 8: PhD theses produced during the EP (2003-2006).
These metrics enable us to compare units directly, irrespective of their size, since they measure the unit’s normalized critical mass. Special emphasis should be given to the h-index, a true measure of substance and consistency of both production and impact over the years, since an author’s h-index is given by the highest number n of papers with at least n citations.
Weight and relevance results per capita, calculated over the reference con-tributing period (99-06):
1. Unique cited papers per Int-PhD (Figure 9): Gross publication figure divided by #Int-PhD.
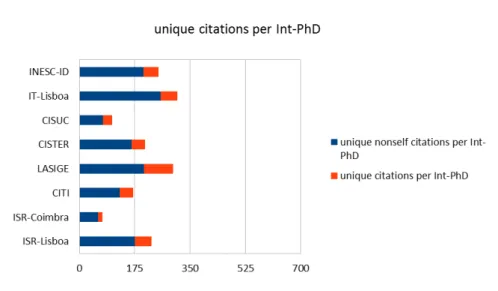
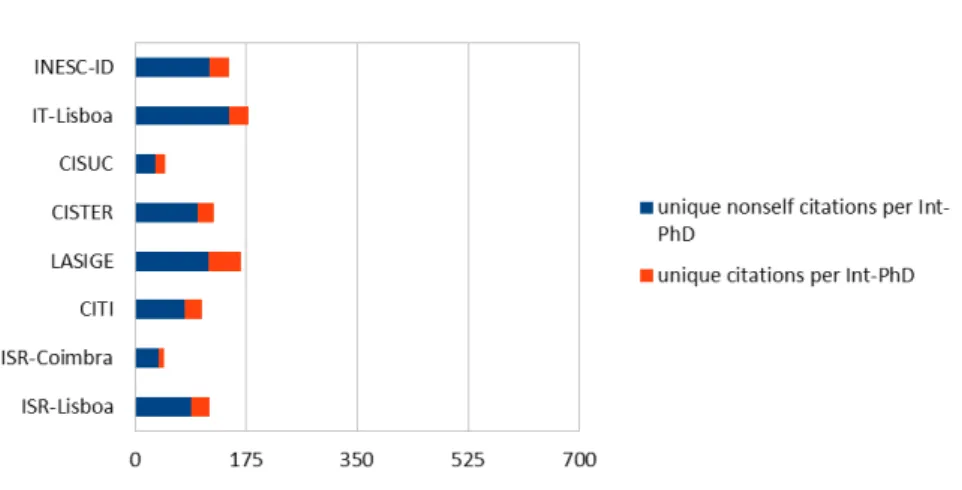
2. Unique citations per Int-PhD (Figure 10): Gross citations figure divided by #Int-PhD.
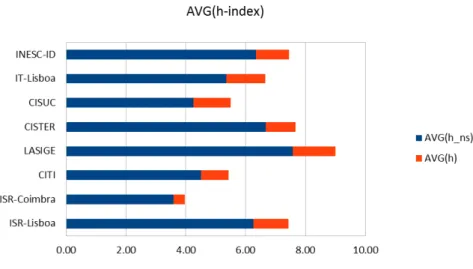
3. Average of the h-indices (Figure 11): sum of the h-index of each Int-PhD, divided by #Int-PhD.
4.4
Efficiency - Production and Impact per capita
While the gross outputs over a period of time measure a unit’s effectiveness, it is also important to assess its efficiency with regard to production (publications, research projects and PhD theses) and respective impact (citations). This was done by dividing the gross production and impact figures for the same evalua-tion period by the number of Int-PhD. Producevalua-tion and impact per capita (e.g., figures ’per Int-PhD’) are the most suitable metrics to compare research units because they are not affected by the number or seniority of researchers, but rather reflect the average productivity and impact of the researchers in a unit.
Production and impact results per capita, calculated over the evaluation period (03-06):
Figure 9: Unique cited papers per Int-PhD: Gross Weight publication figure divided by #Int-PhD w.r.t. the RCP (1999-2006).
Figure 10: Unique citations per Int-PhD: Gross Weight citations figure divided by #Int-PhD, w.r.t. the RCP (1999-2006).
Figure 11: Average of the h-indices of Int-PhD, w.r.t. the RCP (1999-2006).
1. Unique cited papers per Int-PhD (Figure 12): union of the papers pub-lished in the period, found from each individual Int-PhD, divided by #Int-PhD.
2. Unique citations per Int-PhD (Figure 13): union of citations found to each of those papers, divided by #Int-PhD.
3. National and International projects per #Int-PhD (Figure 14): numbers of research projects started during the period, divided by 10×#Int−P hD (for readability).
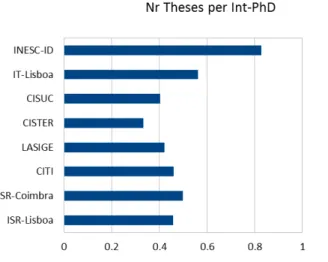
4. PhD theses produced per #Int-PhD (Figure 15): numbers of PhD theses finished during the period, divided by 10 × #Int − P hD (for readability).
4.5
Balance - Relevance
These metrics estimate the distribution of the relevance of individual Int-PhD unit members, for each unit. They enable the comparison of research units regardless of their size, since the distribution is relative to the number of Int-PhDs.
The function QNT(parameter ) measures the percentage of Int-PhDs of each unit that fall between selected threshold values of parameter. For example, % of researchers with: up to 50 papers; 51-100; 101-150; above 150.
Results are shown for the distribution of the number of cited papers, citations and Hirsch-index, excluding self-citations in the latter two. Together, they yield a macroscopic estimate of how balanced each unit is in terms of relevance of its members. The larger the rightmost bars are in the figures 16, 17 and 18, the better balanced is each unit. Again, special attention should be drawn to the h-index distributions.
Distributions (QNT (papers — CITS NS — H NS)) that were calculated over the reference contributing period (99-06):
Figure 12: Unique cited papers per Int-PhD: Gross Weight publication figure divided by #Int-PhD w.r.t. the EP (2003-2006).
Figure 13: Unique citations per Int-PhD: Gross Weight citations figure divided by #Int-PhD w.r.t. the EP (2003-2006).
Figure 14: National and International projects per Int-PhD started during the EP (2003-2006): Gross Weight research projects figure divided by #Int-PhD.
Figure 15: PhD theses produced per Int-PhD produced during the EP (2003-2006): Gross Weight PhD theses figure divided by #Int-PhD.
Figure 16: Distribution of Int-PhD researchers by their number of cited papers published within the RCP (1999-2006).
1. Distribution of the Int-PhD’s numbers of cited papers (Figure 16). 2. Distribution of the Int-PhD’s numbers of citations (excluding self-citations)
(Figure 17).
3. Distribution of the Int-PhD’s Hirsch-index (excluding self-citations) (Fig-ure 18).
4.6
Balance - Impact
These metrics estimate the distribution of the impact of individual Int-PhD unit members, for each unit. Like the relevance metrics, they enable the direct com-parison of research units regardless of their size, since the distribution is relative to the number of Int-PhDs. Again, we are using the function QNT(parameter ) as defined in the previous section.
Results are shown for the distribution of number of cited papers published in the evaluation period, and their citations excluding self-citations. Together, they yield a macroscopic estimate of how balanced each unit has been, in terms of the contributions of individual Int-PhD researchers to its impact over a period. Again, the larger the rightmost bars are in the Figures 19 and 20, the better balanced is each unit.
As explained previously, for the 4-year period 03-06, we are evaluating cita-tions more than four years later. Note that h-index is not included since it does not apply to short periods.
Distributions (QNT (papers — CITS NS)) that were calculated over the evaluation period (03-06):
1. Distribution of the Int-PhD’s numbers of cited papers (Figure 19). 2. Distribution of the Int-PhD’s numbers of citations (excluding self-citations)
Figure 17: Distribution of Int-PhD researchers by their number of citations (excluding self-citations) to the papers published within the RCP (1999-2006).
Figure 18: Distribution of Int-PhD researchers by their h-index (excluding self-citations) w.r.t. publications within the RCP (1999-2006).
Figure 19: Distribution of Int-PhD researchers by their number of cited papers published within the EP (2003-2006).
5
Conclusions
This paper presented a study that compared a set of representative Portuguese research units using objective parameters. The calculations of these parameters were based on public information, retrievable on-line and/or from official sources and thus verifiable and repeatable. The results have shown that the parameters chosen for this study perform well, since they allowed to produce aggregate data about institutions, of comparative statistical value, providing a good match to usual evaluation terms of reference in international academia, including the official ToRs of the latest FCT evaluation.
This kind of benchmarking studies are essential in any excellence system, and common in developed countries, but they are normally expensive and specific to a given period and domain. By contrast, our study required minimal human intervention, since it collected most of the information using automatic tools, such as CIDS, from publicly available resources. This resulted in the analysis of a set of extensive information that can be easily kept up to date, since we can track public data sources automatically for updates as they evolve. Moreover, our approach could be easily extended to other fields as long as similar sources of information are available. We plan on extending the present study, but it can also be extended by anyone willing.
The main goal of this study was to calculate and show objective numbers, avoiding controversial discussions about the chosen parameters. However, in the future we plan to perform more extensive sensitivity analyses, for exam-ple, to verify the effect of discerning self-citations and to measure the impact of homonymous authors [10]. For doing this, we will look to available datasets containing manually verified associations of publications and citations to au-thors. We also plan on evolving the CIDS tool itself to improve its efficiency and accuracy. One avenue that is being explored in a beta version of a new re-lease of CIDS is to take advantage of the Google Scholar Citation profiles, which
Figure 20: Distribution of Int-PhD researchers by their number of citations (excluding self-citations) to the papers published within the EP (2003-2006).
requires the collaboration of the target units and researchers. We stress that CIDS can and has been used for individual purposes (e.g., a curriculum) but we recommend a final albeit residual effort of checking and cleaning. That effort is predicted to be minimal, as reported by the experiments on data quality.
Finally, the results over the selected units suggest that objective metrics, especially if multi-dimensional and with good precision and recall, are a faithful indicator of the fulfilment of qualitative and quantitative objectives of a research unit. As such, they can be a useful tool to benchmark scientific productivity and impact, and assist peer review.
Acknowledgements
We would like to thank Ana Luisa Resp´ıcio for the valuable advice on statistics; Pedro Antunes for the manual evaluation of CIDS results; Helena Galhardas and Emanuel Santos for calculating the number of Scholar duplicates; Lu´ıs
Caires, Lu´ıs Rodrigues, M´ario Silva, and Eduardo Tovar, for their many valuable
suggestions and comments, and several other researchers for point suggestions and for encouraging us to pursue this avenue. We would like to thank all LaSIGE members who used the tool and reviewed the results, and Ivan Andrade for his contribution to the first edition, whose results are extensively re-used.
References
[1] W. Aksnes. A macro study of self-citation. Scientometrics, 56(2):235–246, 2003.
[2] P. Ball. Index aims for fair ranking of scientists. Science Focus,
[3] R. Belew. Scientific impact quantity and quality: Analysis of two sources of bibliographic data. arXiv:cs.IR/0504036, 1, 2005.
[4] L. Bornmann and H. Daniel. Does the h-index for ranking of scientists really work? Scientometrics, 65(3):391–392, 2005.
[5] J. Bosman, I. Mourik, M. van Rasch, E. Sieverts, and H. Verhoeff. Sco-pus reviewed and compared. the coverage and functionality of the citation database Scopus, including comparisons with Web of Science and Google Scholar. Utrecht University Library, 2006.
[6] F.M. Couto, C. Pesquita, T. Grego, and P. Verissimo. Handling
self-citations using Google Scholar. Cybermetrics, 13(1):2, 2009.
[7] Francisco M. Couto, Ivan Andrade, Pedro Goncalves, and Paulo Veris-simo. Benchmarking some portuguese S&T system research units. Techni-cal Report TR-2010-07, University of Lisbon, DI-FCUL, November 2010. http://hdl.handle.net/10455/6682.
[8] P. Daniel and K. Stergiou. Equivalence of results from two citation analyses: Thompson isi’s citation index and google’s scholar service. Ethics in Science and Environmental Politics, pages 33–35, 2005.
[9] Bjorn De Sutter and A¨aron Van Den Oord. To be or not to be cited in
computer science. Commun. ACM, 55(8):69–75, August 2012.
[10] H. Galhardas, A. Lopes, and E. Santos. Support for user involvement in data cleaning. Data Warehousing and Knowledge Discovery, pages 136– 151, 2011.
[11] W. Gl¨anzel. On the opportunities and limitations of the h-index. Science
Focus, 1(1):10–11, 2006.
[12] A. Harzing and R. Wal. Google Scholar as a new source for citation analysis. Ethics in Science and Environmental Politics, e008:5, 2007.
[13] J. Hirsch. An index to quantify an individual’s scientific research output. Proceedings of the National Academy of Sciences, 102:16569, 2005.
[14] JE Hirsch. Does the h index have predictive power? Proceedings of the
National Academy of Sciences, 104(49):19193, 2007.
[15] C. Holden. Random samples: Data point - impact factor. Science Magazine, 309(5738):1181, 2006.
[16] Ken Hyland. Self-citation and self-reference: Credibility and promotion in academic publication. Journal of the American Society for Information Science and Technology, 54(3):251–259, 2003.
[17] Juan E. Iglesias and Carlos Pecharrom´an. Scaling the h-index for different
scientific isi fields. Scientometrics, 73(3):303–320, 2007.
[18] I.S. Kang, S.H. Na, S. Lee, H. Jung, P. Kim, W.K. Sung, and J.H. Lee. On co-authorship for author disambiguation. Information Processing and Management, 45(1):84–97, 2009.
[19] S. Lawrence, C.L. Giles, and K. Bollacker. Digital libraries and autonomous citation indexing. IEEE computer, 1999.
[20] M. MacRoberts and B. MacRoberts. Problems of citation analysis: A
critical review. Journal of the American Society for Information Science and Technology, 40(5):342–349, 1989.
[21] L. Meho and K. Yang. A new era in citation and bibliometric analyses: Web of science, scopus, and google scholar. Journal of the American Society for Information Science and Technology, 58:1–21, 2007.
[22] T. Nisonger. Citation autobiography: an investigation of ISI database
coverage in determining author citedness. College & Research Libraries, 65(2):152–163, 2007.
[23] H. Roediger. The h index in science: A new measure of scholarly contribu-tion. APS Observer: The Academic Observer, 19, 2006.
[24] G. Saad. Exploring the h-index at the author and journal levels using biblio-metric data of productive consumer scholars and business-related journals respectively. Scientometrics, 69(1):117–120, 2006.
[25] M. Schreiber. The influence of self-citation corrections on Egghe’s g index. Scientometrics, 76(1):187–200, 2008.