of indoor air particles in an antarctic research
station
Impact o das at i vi dades humanas na concent r ação de
par t ícul as aér eas no i nt er i or de uma est ação de pesqui sa
ant ár t i ca
Erica Coelho Pagel
Neyval Costa Reis Júnior
Cristina Engel de Alvarez
Jane Méri Santos
Abstract
ne of the main characteristics of Antarctic buildings is the fact that they are designed mostly with a focus on energy efficiency. Although human activity is a major source of pollution, indoor air quality is not a matter of significant concern during building planning. This study examines the relationship between indoor activities in an Antarctic Research Station and the size distribution of particulate matter. Real-time particle size distribution data is used in conjunction with time-activity data. The activity number ratio is calculated using the mean number of particles found in each size range during each activity divided by the average number of particles found during a period characterized by the absence of human activities. Cooking, the use of cosmetics, waste incineration and exhaust from light vehicles were responsible for significant deterioration of indoor air related to the presence of fine and ultrafine particles. Cleaning, physical exercise and the movement of people were responsible for the emission of coarse particles. This article emphasizes the importance of post-occupancy evaluation of buildings, generating results relevant to the planning and layout of new buildings, especially regarding better indoor air quality.
Keywords: Particulate matter. Indoor air quality. Human activities. Size distribution. Antarctic Research Station.
Resumo
Uma das principais características das construções antárticas é o fato que boa parte do esforço projetual é concentrado na eficiência energética. Embora a atividade humana seja a maior fonte de poluição, a qualidade do ar interior não é uma questão com significativa preocupação durante o planejamento da
construção. Este estudo investigou a relação entre as atividades internas em uma Estação de Pesquisa Antártica e a distribuição dos tamanhos das partículas. Dados de distribuição do tamanho das partículas são plotados em tempo real em conjunção com os registros das atividades. A taxa de atividade é calculada usando o número médio de partículas encontradas em cada faixa de tamanho, durante cada atividade, dividido pelo número médio de partículas encontradas durante o período sem atividade humana. Cocção, uso de cosméticos, incineração de resíduos e exaustão de veículos são responsáveis pela deterioração do ar interno relacionada com a presença de partículas finas e ultrafinas. Limpeza, exercício físico e trânsito de pessoas, são responsáveis pela emissão de partículas grossas. Este artigo reforça a importância da avaliação pós-ocupação de edifícios, gerando resultados relevantes ao planejamento e layout das novas construções principalmente no que se diz respeito a uma melhor qualidade do ar interno.
Palavras-chave: Material particulado. Qualidade do ar interno. Atividades humanas. Distribuição de tamanho. Estação de Pesquisa Antártica.
O
Erica Coelho Pagel
Universidade Federal do Espírit o Sant o Vit ória - ES - Brasil
Neyval Cost a Reis Júnior
Universidade Federal do Espírit o Sant o Vit ória - ES - Brasil
Crist ina Engel de Alvarez
Universidade Federal do Espírit o Sant o Vit ória - ES - Brasil
Jane Méri Santos
Universidade Federal do Espírit o Sant o Vit ória - ES - Brasil
Ambient e Const ruído, Port o Alegre, v. 18, n. 1, p. 463-477, j an. / mar. 2018.
Pagel, E. C.; Reis Júnior, N. C. ; Alvarez, C. E. de; Sant os, J. M.
464
Introduction
The geographic isolation of Antarctica, which is provided by the Antarctic Ocean, as well as its extreme climate, results in complex conditions that require major logistical efforts to make human presence possible on this vast continent. Thus, scientific research stations are essential for maintaining researchers in Antarctica. In spite of the differences between construction layouts and building materials (VARGAS et al., 2013), most of the human activities performed indoors are quite similar, such as cooking, using cosmetics, cleaning, physical exercise, building maintenance and the movement of people. In addition, one of the main characteristics of Antarctic buildings is the fact that they are mostly designed focusing on energy efficiency, mainly regarding energy consumption and thermal comfort. Indoor air quality is not a matter of significant concern during building planning, especially for the older research stations. In this context, the presence of indoor particulate matter (PM) is a significant matter of concern as it is associated with short-term health effects, such as eye, nose and throat irritation; headaches; dizziness; and fatigue. Thus, it contributes to the symptoms of Sick Building Syndrome (LIN et al., 2016), associated to long-term exposure to ambient particulate matter with increased mortality from cardiovascular and respiratory disorders (ANNESI-MAESANO et al., 2007; HAMPEL et al., 2015). Previous studies indicate that human activities can be the main source of PM in indoor air and can generate particles with a wide variety of diameters (BRANIŠ; ŘEZÁČOVÁ; DOMASOVÁ, 2005; HE
et al., 2004; SEAMAN; BENNETT; CAHILL,
2009). Fine particles with diameters less than 2.5 μm (PM2.5), in non-smoking indoor environments, primarily originate from human activities that involve combustion processes, such as cooking (TAN et al., 2013)or incineration(BUONANNO; MORAWSKA, 2014). Particularly for urban buildings, there is also a strong correlation of these particles with the presence of external sources (VIANA; DÍEZ; RECHE, 2011) as they are small and tend to infiltrate buildings, even when the windows are closed (SANTOS et al., 2011). The concentration of coarse particles (>PM2.5) in indoor air may be associated with cooking and/or resuspension of particles from cleaning, the movement of people (BRANIŠ; ŘEZÁČOVÁ; DOMASOVÁ, 2005) or the presence of people (MARÈ; LEITE, 2013). Geller et al. (2002) points out that activities such as vacuum cleaning, sweeping, dusting furniture and washing carpets account for 50-80% of the particles in a 2-10 µm range in indoor environments. While the
contribution of outdoor particles at this size range varies between 10 and 40% and usually decreases as the diameter increases (TRAN et al., 2014). Due to the almost pristine air quality in the Antarctic environment, indoor sources are the primary matter of concern and particle infiltration may not be a significant problem because pollutant penetration may occur only due to local sources related to station activities, such as vehicle operation nearby, waste incineration or energy generation.
In spite of the importance of the indoor air quality in Antarctic buildings, most of the reported studies are focused on the outdoor particles (MISHRA et
al., 2004; PANT; SIINGH; KAMRA, 2011;
PEREIRA; LOUREIRO; VASCONSELLOS, 1992; TEINILÄ et al., 2014). One of the first reported studies aimed at indoor air quality in an Antarctic Research Station was presented by Pagel et al. (2016), who demonstrated that indoor/outdoor concentration ratios (I/O) for PM10 and PM2.5 are considerably larger for Antarctic stations compared to urban environments. The study performed a physicochemical characterization of the indoor particles, highlighting the importance of indoor sources for the air quality inside the research station. In addition, the authors also presented a particle number concentration time series for a common use environment (living room) and attempted to correlate the particle number concentration with human activities, such as cleaning, making lunch or breakfast or incinerator usage.
Material and methods
The experiments were carried out at the Brazilian Comandante Ferraz Antarctic Station (EACF), which is located in Admiralty Bay on King George Island at 62°05' S; 58°24 W and is populated by a group of approximately 65 people, consisting of both civilians and military personnel, who are allowed to stay in the station for periods ranging from one month to one year. The EACF was founded in 1984 and consisted of eight metal containers measuring 150 m² to accommodate up to 12 people. It underwent extensive renovation, and by 2012, the surface area was approximately 2500 m². In some compartments, which benefited from air heating systems and where there are windows, they were normally used to refresh the recycled indoor air (subject to weather conditions).
On February 25, 2012, a major fire destroyed the buildings that were the main part of the station. Considering the need to reconstruct the destroyed buildings and the possibility of using evaluation results from the useful life of the station in various areas of knowledge, in 2013 the Brazilian Antarctic Program ran an international competition to select the best design and subsequent construction of the new building at the EACF. The criteria established to guide the candidates and select the winners highlighted the concept of sustainability, including
parameters of indoor air quality, which was a direct consequence of this work (INSTITUTO…, 2013). Figure 1 shows a schematic representation of the station, indicating the sampling points for the field experiment. The station is divided into two large environments consisting of:
(a) conditioned compartments; and (b) unconditioned compartments.
The conditioned compartments are the living quarters of the station personnel, including the dormitories (arsenal group dormitory - AGD, bedrooms 10 and 21), gym, library, living room, kitchen and bathrooms. The unconditioned compartments are the service and utility areas, which include the station maintenance workshop, energy generation, waste disposal, garage, storage and a transition area (TA) between the operating sectors. The conditioned areas have heating, whereas the unconditioned areas only have basic protection from the outside weather (no temperature control). This arrangement is very common in Antarctic stations in general because of the severe weather conditions, especially during winter, which restricts the movement between detached buildings. Thus, service areas are usually linked by a protected covered environment (TA), while living quarters and laboratories are conditioned environments.
Ambient e Const ruído, Port o Alegre, v. 18, n. 1, p. 463-477, j an. / mar. 2018.
Pagel, E. C.; Reis Júnior, N. C. ; Alvarez, C. E. de; Sant os, J. M.
466
In the compartments with air heating systems, windows are regularly left open to renew indoor air (subject to weather conditions) as there is no mechanical ventilation system in the building. The unconditioned compartments have natural ventilation via the access doors to the TA.
Field experiments were conducted between 13 January and 3 February, 2012, during the Antarctic summer when there is maximum station occupancy. Particles were measured in eight compartments, which were occupied for longer periods of time and involved common activities to Antarctic stations with potential sources of air pollution, such as cooking, cleaning, physical exercise, personal care, waste incineration and vehicle traffic
In addition to particle measurements, a field log book was made available to residents in each site to register their daily activities instantly. Furthermore, a spreadsheet based on EN ISO 16000-1/2006 for indoor air quality assessment (INTERNATIONAL…, 2006) was completed for all compartments. In this spreadsheet, the following was recorded: the time of the beginning and end of each typical activity carried out in the environment; the number of people who normally occupied the space and the number of people that occupied the space during sampling; if the occupants smoked or not, as well as methods and products used for cleaning the environment and furniture. Other information, such as the sampling location, ventilation conditions before and during monitoring, building materials and environmental conditions were also recorded.
Indoor particles were analyzed using an Optical Laser Aerosol Spectrometer (LAS - Dust Monitor 1.109, Grimm Technologies, Germany) that measures 31 particle size bins ranging from 0.25 µm to >32 µm at a 1-min frequency. This spectrometer works at a constant air flow rate controlled by a pump previously calibrated at 1.2 L/min ± 5% and gives the mass and number concentration of the particles distributed by diameter. The temperature, humidity and air velocity were also measured. The sampler was placed 1.5 m high and the measurements were carried out over 24 hours in all the compartments.
Results and discussion
The results are divided into three main sections, where each type of room use is analyzed. The first part explores common use areas, such as the library, living room and gym, where the nature of the activity is a dominant factor for the characteristics of particle emission. Secondly, the results for three dormitories are presented, focusing on the characterization of the particle emission related to each activity, but accounting for the differences between each room. The third part explores the characteristics of particle emission in relation to the type of activity performed in the service areas of the station (incinerator area and workshop).
The 24-h mean temperature recorded in the conditioned and unconditioned areas was 25.9 and 8.6°C, respectively. In Figure 2, it can be observed that there are only minor variations of the temperature during the activities, while the relative humidity seems to be more sensitive to the activities performed in the rooms. As expected, the 24-h mean relative humidity was lower in the conditioned areas (26.9 %) than in the unconditioned ones (53.8 %).
Common use areas
There are three main common use areas for the station occupants: living room, library and gym. The living room is an area mainly devoted to social gatherings, recreation and meals, and is the most used compartment during non-working hours. In EACF, the living room is attached to the kitchen (connected by an open doorway), and thus directly affected by the emissions from cooking. The library and gym are moderately used by station personnel. The library is characterized by moderate use throughout the day (a small number of people without a fixed schedule), while the gym is characterized by intense use for a short period of time (significant number of people after working hours).
Figure 2 - Measurements of numerical concentrations of Total Suspended Particles (TSP), t emperat ure (T) and relative humidity (RH)
(a)Living room (b) Library
(c) Gym
Interestingly, although the barbecue did not take place directly within the monitored environment, it exerted a major influence on the particle concentrations, especially fine fraction. Various studies have reported the effects of burning charcoal in barbecues increasing the number of fine particles (LEE; LI; YIN CHAN, 2001; TANER; PEKEY; PEKEY, 2013). The barbecue at the EACF is associated with a cultural practice and may not happen at other research stations in other countries. Despite the fact that the activity is very rare (approximately once a month), it must be taken into consideration for indoor air quality control strategies as the measured values are significantly higher and the event influences various rooms in the station.
In order to explore the specificities of the emission profile of each activity, it is interesting to analyze the average size distribution for mass concentration of particles during the activities in each room, which is presented in Figure 3.
For all activities, mass concentration distributions tend to present peaks in the range of 2.5 to 10µm and around 10 µm (between 8.5 and 15 µm). In fact, a considerable fraction of the mass is in the range of 2.5 to 10µm (32 to 55% of the total mass). Nonetheless, there are marked differences between emission size distributions for each activity. For instance, the living room presents a marked concentration of submicron particles as the amount of time spent on cooking, burnt food and different cooking techniques, such as more frying using cooking oil, influences particle concentration, particularly, the fine fractions of PM (GÉHIN;
RAMALHO; KIRCHNER, 2008; TAN et al.,
2013). This trend is more marked during breakfast, which is characterized by a long period of bread baking. Abt et al., (2000) reported that oven cooking and toasting contributed primarily to submicron particles and frying contributed to submicron and supermicron particles.
0 10 20 30 40 50 60 70 80 0 100 200 300 400 500 600 700 800 900 00 :0 0: 00 02 :0 0: 00 04 :0 0: 00 06 :0 0: 00 08 :0 0: 00 10 :0 0: 00 12 :0 0: 00 14 :0 0: 00 16 :0 0: 00 18 :0 0: 00 20 :0 0: 00 22 :0 0: 00 T ( ° C) -R H ( %) N u m b er o f p a rt icl es /cm ³
TSP T.(゚C) RH(%)
breakfast lunch dinner social gathering 0 10 20 30 40 50 60 70 80 0 50 100 150 200 250 300 350 400 450 500 17 :0 0: 00 19 :0 0: 00 21 :0 0: 00 23 :0 0: 00 01 :0 0: 00 03 :0 0: 00 05 :0 0: 00 07 :0 0: 00 09 :0 0: 00 11 :0 0: 00 13 :0 0: 00 15 :0 0: 00 T ( ° C) -R H ( %) N u m b er o f p a rt icl es /cm ³
TSP T.(゚C) RH.(%)
0 10 20 30 40 50 60 70 80 0 1000 2000 3000 4000 5000 6000 18 :0 0: 00 20 :0 0: 00 22 :0 0: 00 00 :0 0: 00 02 :0 0: 00 04 :0 0: 00 06 :0 0: 00 08 :0 0: 00 10 :0 0: 00 12 :0 0: 00 14 :0 0: 00 16 :0 0: 00 T ( ° C) -R H ( %) N u m b er o f p a rt icl es /cm ³
TSP T (°C) RH(%)
A m b ie nt e C on st ru íd o, P or to A le gr e , v . 1 8, n . 1 , p . 4 63 -4 77 , j an ./ m ar . 2 01 8. P ag e l, E. C .; R e is J ún io r, N . C .; A lv ar e z, C . E . d e ; S an to s, J . M . 46
8 Figure
3 S iz e d is tr ib u ti o n o f m a ss c o n c e n tr a ti o n f o r p a rt ic le s (a) L iv ing r oom
(b ) L ib ra ry (c) G ym
0 1 2 3 4 5 6 7 8 9 10
0.25-0.28 0.28-0.30 0.30-0.35 0.35-0.40 0.40-0.45 0.45-0.50 0.50-0.58 0.58-0.65 0.65-0.70 0.70-0.80 0.80-1.0 1.0-1.3 1.3-1.6 1.6-2.0 2.0-2.5 2.5-3.0 3.0-3.5 3.5-4.0 4.0-5.0 5.0-6.5 6.5-7.5 7.5-8.5 8.5-10.0 10.0-12.5 12.5-15.0 15.0-17.5 17.5-20.0 20.0-25.0 25.0-30.0 30.0-32.0 >32.0 Concentration µg/m³ D ia m et er ( µ m ) L ivi n g r oom br eak fas t lun ch di nn er so ci al g at her in g no h um an act iv ity
0 5 10 15 20 25
0.25-0.28 0.28-0.30 0.30-0.35 0.35-0.40 0.40-0.45 0.45-0.50 0.50-0.58 0.58-0.65 0.65-0.70 0.70-0.80 0.80-1.0 1.0-1.3 1.3-1.6 1.6-2.0 2.0-2.5 2.5-3.0 3.0-3.5 3.5-4.0 4.0-5.0 5.0-6.5 6.5-7.5 7.5-8.5 8.5-10.0 10.0-12.5 12.5-15.0 15.0-17.5 17.5-20.0 20.0-25.0 25.0-30.0 30.0-32.0 >32.0 Concentration µg/m³ D ia m et er ( µ m ) L ib ra ry cl ea nin g ind oo r w or k no h um an act iv ity
0 1 2 3 4 5 6 7
The coarse fractions of PM tend to be emitted while people are moving (FROMME et al., 2007). Considering this, it can be observed that during social gatherings, cleaning and physical exercise use, there is a higher significant increase of mass concentration of particles around 10µm. Figure 4 shows the size distribution of the activity number ratio, i.e., the mean number of particles found at each size range for an interval of three hours with some activities divided by the average number of particles found for an interval of three hours characterized by no human activities. Figure 4a shows that during activities involving cooking (breakfast, lunch and dinner), there is a significant increase in the concentration of submicron particles, presenting an activity number ratio of up to 20 for certain size ranges. While for other activities (social gatherings, cleaning and physical exercise), the activity number ratio peaks around 10µm. It is interesting to note that although the activity number ratio peaks around 10µm for library use, there is also another peak for submicron particles, which may be related to book handling.
Dormitories
As shown in Figure 1, there are two types of dormitories in the station:
(a) accommodation for two people without a bathroom; and
(b) collective accommodation housing 12 people with an attached bathroom.
This section presents the results for three dormitories: accommodation for two people (cabins 10 and 21) and collective accommodation AGD. The accommodation areas are used during non-working hours and are therefore unoccupied throughout most of the day.
Figure 5 shows the mean hourly number concentration of Total Suspended Particles (TSP) over a 24-hour monitoring period in cabin 10, cabin 21 and AGD. It can be observed that there are two main peaks in the particle number concentration for cabins 10 and 21 (Figures 5a and 5b). These peaks coincide with the periods when their occupants got up, went to bed and used personal care products according to the information in the field diary, in
which the residents recorded the cosmetic products that were used at each location and how often they used them, as well as other activities that were carried out. On the other hand, there are four main peaks in the particle number concentration for AGD (Figure 5c). Analogously to cabins 10 and 21, the number concentration peaks for AGD coincide with the periods when their occupants got up, went to bed and used personal care products (23:00-01:00 and 07:00-09:00), nonetheless there are additional concentration peaks around 13:00 and 18:00. These peaks correspond to lunch time periods and the end of the working periods. In both cases, the occupants tend to use the dormitory and the attached bathroom.
Another significant difference between AGD and cabins 10 and 21 is the maximum values of number concentration, presenting peak values during personal care activities nearly 10 times higher on average. This trend is probably related to the fact that AGD has an attached bathroom and most of the emission related to sprays or personal care products is performed inside the bathroom. Occupants of cabins 10 and 21 use a collective bathroom outside the cabin and most of the emissions are related to sprays or personal care products inside the cabin, according to the field log books. This clearly indicated the importance of the emission during personal care activities and may suggest that ventilation must be improved in the areas associated with this these activities.
A
m
b
ie
nt
e
C
on
st
ru
íd
o,
P
or
to
A
le
gr
e
, v
. 1
8,
n
. 1
, p
. 4
63
-4
77
, j
an
./
m
ar
. 2
01
8.
P
ag
e
l,
E.
C
.;
R
e
is
J
ún
io
r,
N
. C
.;
A
lv
ar
e
z,
C
. E
. d
e
; S
an
to
s,
J
. M
.
47
0 Figure
4
S
iz
e
d
is
tr
ib
u
ti
o
n
o
f
th
e
a
c
ti
v
it
y
n
u
m
b
e
r
ra
ti
o
(a)
L
iv
ing
r
oom
(b
) L
ib
ra
ry
(c)
G
ym
0 5 10 15 20 25
0.25-0.28 0.28-0.30 0.30-0.35 0.35-0.40 0.40-0.45 0.45-0.50 0.50-0.58 0.58-0.65 0.65-0.70 0.70-0.80
0.80-1.0 1.0-1.3 1.3-1.6 1.6-2.0 2.0-2.5 2.5-3.0 3.0-3.5 3.5-4.0 4.0-5.0 5.0-6.5 6.5-7.5 7.5-8.5 8.5-10.0 10.0-12.5 12.5-15.0 15.0-17.5 17.5-20.0 20.0-25.0 25.0-30.0 30.0-32.0
>32.0
activity number ratio
D
ia
m
et
er (
µ
m
)
L
ivi
n
g
r
oom
br
eak
fas
t
lun
ch
di
nn
er
so
ci
al
g
at
her
in
g
0 50 100 150 200 250 300 350 400
0.25-0.28 0.28-0.30 0.30-0.35 0.35-0.40 0.40-0.45 0.45-0.50 0.50-0.58 0.58-0.65 0.65-0.70 0.70-0.80 0.80-1.0 1.0-1.3 1.3-1.6 1.6-2.0 2.0-2.5 2.5-3.0 3.0-3.5 3.5-4.0 4.0-5.0 5.0-6.5 6.5-7.5 7.5-8.5 8.5-10.0 10.0-12.5 12.5-15.0 15.0-17.5 17.5-20.0 20.0-25.0 25.0-30.0 30.0-32.0 >32.0
activity number ratio
D
ia
m
et
er (
µ
m
)
G
y
m
ind
oo
r w
or
Figure 5 - Measurements of numerical concentrations of Total Suspended Particles (TSP), temperature (T) and relative humidity (RH)
(a) Cabin 10 (b) Cabim 21
(c) AGD
These products are known to provide high particle concentrations in indoor air over a short period, which corresponds to the time that is required for application and use. Increased concentrations of indoor pollutants due to personal care activities using products such as deodorants, perfumes, talcum powder, make-up and cosmetics have been documented in various studies (CONNER;
WILLIAMS, 2004; UHDE et al., 2015;
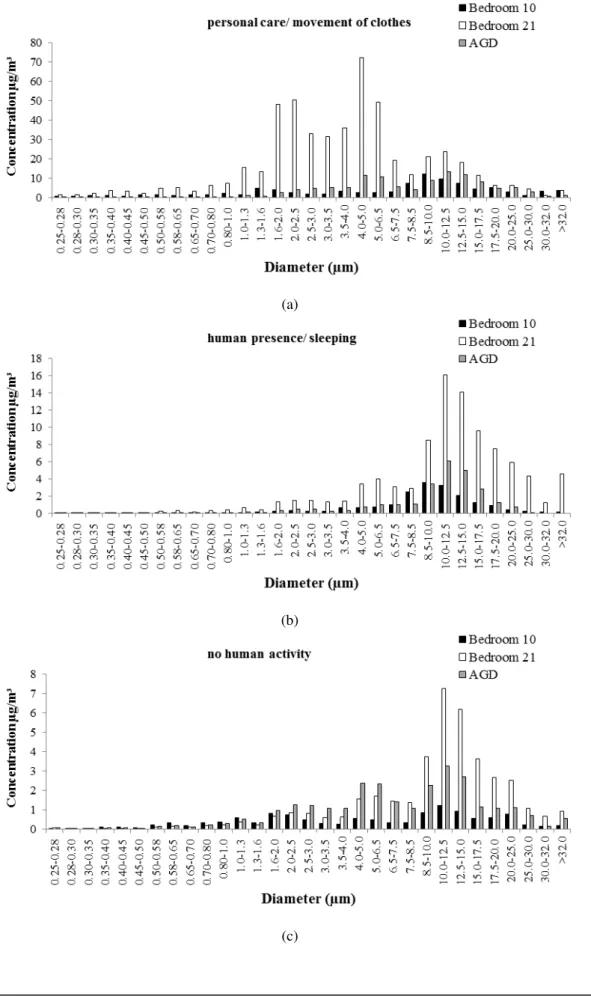
WALLACE et al., 2006). For cabin 10 and AGD, the maximum mass concentration is around the 8.5 to 12.5 µm range, which may suggest that in the absence of spray products, larger particles are more dominant and probably related to the movement of people and clothes. This behavior can be observed more clearly when the concentration during the activity (Figure 6a) is compared with the concentration during the period without any human activity in the room (Figure 6c).
The mass ratio (TSP- PM2.5)/ PM2.5 is equal to 11 for AGD, while for dormitories 10 and 21 this ratio is 2.26 and 2.86, respectively, which indicates a substantial change in the size distribution of the emitted particles. Furthermore, cabins 10 and 21 and the AGD, 30%, 28% and 8%, respectively, of the mass fraction monitored over 24 hours corresponds to PM2.5. This result demonstrated that the spatial configuration and the activities related to the movement of people and clothes, dust resuspension from the floor and furniture are more significant in AGD.
During sleeping time, concentration patterns resemble the size distribution during the periods with no human presence, although the concentration values during these periods are considerably higher (around two times).
0 10 20 30 40 50 60 70 80 0 50 100 150 200 250 300 350 400 450 500 16 :0 0: 00 18 :0 0: 00 20 :0 0: 00 22 :0 0: 00 00 :0 0: 00 02 :0 0: 00 04 :0 0: 00 06 :0 0: 00 08 :0 0: 00 10 :0 0: 00 12 :0 0: 00 14 :0 0: 00 T ( ° C) -R H ( %) N u m b er o f p a rt icl es /cm ³
TSP T.(゚C) RH.(%)
personal care personal care sleeping 0 10 20 30 40 50 60 70 80 0 100 200 300 400 500 600 700 800 900 1000 15 :0 0: 00 17 :0 0: 00 19 :0 0: 00 21 :0 0: 00 23 :0 0: 00 01 :0 0: 00 03 :0 0: 00 05 :0 0: 00 07 :0 0: 00 09 :0 0: 00 11 :0 0: 00 13 :0 0: 00 T ( ° C) -R H ( %) N u m b er o f p a rt icl es /cm ³
TSP T (°C) RH.(%)
personal care personal care sleeping 0 10 20 30 40 50 60 70 80 0 10 20 30 40 50 60 70 80 90 100 15 :0 0: 00 17 :0 0: 00 19 :0 0: 00 21 :0 0: 00 23 :0 0: 00 01 :0 0: 00 03 :0 0: 00 05 :0 0: 00 07 :0 0: 00 09 :0 0: 00 11 :0 0: 00 13 :0 0: 00 T ( ° C) -R H ( %) N u m b er o f p a rt icl es /cm ³
Ambient e Const ruído, Port o Alegre, v. 18, n. 1, p. 463-477, j an. / mar. 2018.
Pagel, E. C.; Reis Júnior, N. C. ; Alvarez, C. E. de; Sant os, J. M.
472
Figure 6 - Mass concentration distribution for particle sizes for each selected interval (a) personal care/ movement of clothes, (b) human presence/ sleeping and (c) no human activity
(a)
(b)
Service areas
As explained previously, the unconditioned compartments are the service and utility areas, which include the station maintenance workshop, energy generation room, waste disposal area, garage, storage and a TA between the operating sectors. Due to the more intense particle emission in the maintenance workshop and waste disposal area, these two were selected for monitoring.
The Madrid Protocol (BRASIL, 1998), linked to the Antarctic Treaty, establishes strict rules regarding environmental preservation of the Antarctic environment, such as controlled access of people and transport in the continent. Considering this, incineration of organic residue is allowed but controlled, and the return of all non-bio-degradable waste to the country of origin is strictly recommended. Therefore, the waste disposal area is mainly devoted to non-bio-degradable waste storage and incineration. The main source of particulate emissions in this area is from incinerator operations (loading and burning).
Workshops in Antarctic stations are work areas mainly used for building maintenance activities. In Brazilian stations, they include are welding, painting, sawing, vehicle transit and the movement of people due to their proximity to the TA.
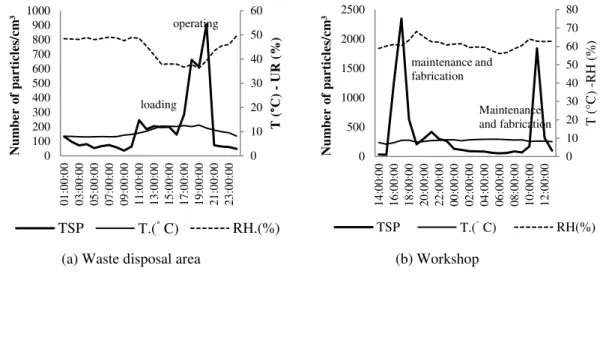
Figure 7 shows a mean hourly number concentration over a 24-hour monitoring period in the waste disposal area and workshop. Monitoring in the waste disposal area was performed on a typical day of an incineration operation, which consisted of two steps:
(a) waste handling and loading operation; and (b) incinerator firing.
The entire operation started approximately at 10:00 and the incinerator was turned off at 20:00. It can be observed that there was an increase in the particle number concentration during the loading operation, but the concentration peaked during incineration. In fact, the large number of particles in this area during incinerator operation indicates that although the incinerator is equipped with a gas treatment device for exhaust gases, fugitive emissions are very significant. From 17:00 the incinerator increased the number of particles emitted due to its operation. At 20:00, when it was turned off, there was a record of the peak mean hourly concentration of TSP of 906.93 particles/cm³.
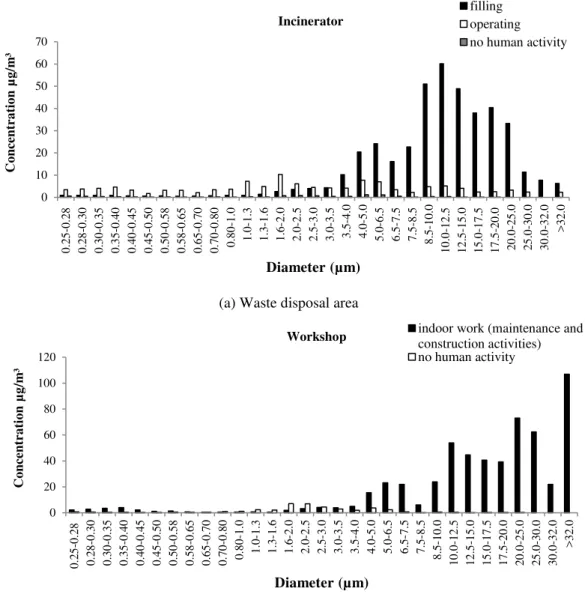
During loading operation, the emission is characterized by the presence of larger particles, while during incineration the finer particles are dominant (BUONANNO; MORAWSKA, 2014). This trend is clearly noticeable in Figure 8a, which presents the average size distribution for mass concentration of particles during the activities. Although the number of particles during the incinerator operation was considerably larger than during the loading operation, the particle mass concentration was significantly smaller. This is due to the fact that incineration predominantly generates fine particles (MAMANE, 1990; MAO et al., 2007). Considering this, the larger mass concentration values were measured during the loading operation and the peak concentrations of TSP, PM10, PM2.5 and PM1 at this time were 704.34, 211.88, 13.29 and 4.73 µg/m³, respectively.
Figure 7 - Time evolution of mean hourly number concentration of Total Suspended Particles (TSP), temperature (T) and relative humidity (RH) over a 24-hour monitoring period
(a) Waste disposal area (b) Workshop
0 10 20 30 40 50 60 0 100 200 300 400 500 600 700 800 900 1000 01 :0 0: 00 03 :0 0: 00 05 :0 0: 00 07 :0 0: 00 09 :0 0: 00 11 :0 0: 00 13 :0 0: 00 15 :0 0: 00 17 :0 0: 00 19 :0 0: 00 21 :0 0: 00 23 :0 0: 00 T ( ° C) -UR ( % ) N u m b er o f p a rt icl es /cm ³
TSP T.(゚C) RH.(%)
0 10 20 30 40 50 60 70 80 0 500 1000 1500 2000 2500 14 :0 0: 00 16 :0 0: 00 18 :0 0: 00 20 :0 0: 00 22 :0 0: 00 00 :0 0: 00 02 :0 0: 00 04 :0 0: 00 06 :0 0: 00 08 :0 0: 00 10 :0 0: 00 12 :0 0: 00 T ( °C) -RH (% ) N u m b er o f p a rt icl es /cm ³
TSP T.(゚C) RH(%)
Ambient e Const ruído, Port o Alegre, v. 18, n. 1, p. 463-477, j an. / mar. 2018.
Pagel, E. C.; Reis Júnior, N. C. ; Alvarez, C. E. de; Sant os, J. M.
474
Figure 8 - Average size distribution for mass concentration of particles during the activities
(a) Waste disposal area
(b) Workshop For the workshop, two number concentration peaks
occurred between 14:00 and 18:00 on Thursday, and between 8:00 and 12:00 on Friday, which represent the hours of the work day (Figure 7b). The maximum numerical TSP values were 2347.95 particles/cm³ at 17:00 on Thursday and 1742.86 particles/cm³ at 11:00 on Friday. During these concentration peaks, measured mass concentration reached a maximum hourly average of 1623.09, 357.01, 68.87 and 54.69 μ g/m³ for TSP, PM10, PM2.5 and PM1, respectively. These values indicate that the ventilation of the compartment needs to be checked urgently as concentration values are considerably large for all size ranges.
The increase in the number and mass concentrations can be attributed to specific maintenance activities and to the movement of people during the day, which contributed to the suspension of particles that
were deposited on the ground, as well as to natural ventilation through the large access gate.
It can be observed in Figure 8b that the majority of the mass emitted is associated to coarse particle, larger than 10 µm. Movement of people, mechanical abrasion and other related activities associated to maintenance and manufacturing tend to emit larger particles. Nonetheless, mass concentrations also increase in the submicron range, which is especially dangerous to health. Submicron particle emission can be related to welding vapor condensation or traffic of light duty vehicles in the TA area.
Conclusion
The results of this study show that activities that are performed during the operation of a research station affect the indoor concentration of air pollutants
0 10 20 30 40 50 60 70 0. 25 -0. 28 0. 28 -0. 30 0. 30 -0. 35 0. 35 -0. 40 0. 40 -0. 45 0. 45 -0. 50 0. 50 -0. 58 0. 58 -0. 65 0. 65 -0. 70 0. 70 -0. 80 0. 80 -1. 0 1. 0-1. 3 1. 3-1. 6 1. 6-2. 0 2. 0-2. 5 2. 5-3. 0 3. 0-3. 5 3. 5-4. 0 4. 0-5. 0 5. 0-6. 5 6. 5-7. 5 7. 5-8. 5 8. 5-10 .0 10 .0 -1 2. 5 12 .5 -1 5. 0 15 .0 -1 7. 5 17 .5 -2 0. 0 20 .0 -2 5. 0 25 .0 -3 0. 0 30 .0 -3 2. 0 > 32. 0 C o nc ent ra ti o n µ g /m ³ Diameter (µm) Incinerator filling operating no human activity
0 20 40 60 80 100 120 0. 25 -0. 28 0. 28 -0. 30 0. 30 -0. 35 0. 35 -0. 40 0. 40 -0. 45 0. 45 -0. 50 0. 50 -0. 58 0. 58 -0. 65 0. 65 -0. 70 0. 70 -0. 80 0. 80 -1. 0 1. 0-1. 3 1. 3-1. 6 1. 6-2. 0 2. 0-2. 5 2. 5-3. 0 3. 0-3. 5 3. 5-4. 0 4. 0-5. 0 5. 0-6. 5 6. 5-7. 5 7. 5-8. 5 8. 5-10 .0 10 .0 -1 2. 5 12 .5 -1 5. 0 15 .0 -1 7. 5 17 .5 -2 0. 0 20 .0 -2 5. 0 25 .0 -3 0. 0 30 .0 -3 2. 0 > 32. 0 C o nc ent ra ti o n µ g /m ³ Diameter (µm)
throughout the day. The analysis of the particle size distribution in terms of the number and mass showed a strong relationship between the diameters of the emitted particles and the type of activity. Waste incineration, cooking, use of personal care products and emission of exhaust from light vehicles increased the range of submicron particles. This observation is a matter of concern in an Antarctic station, where confinement is common in most locations due to the extreme weather conditions.
Incinerator loading and activities that involved dust resuspension from furniture or the ground, such as cleaning, the movement of people and physical exercise were responsible for increases in the average particle concentrations, mainly greater than a 10 μm diameter range.
This study reinforces the fact that the presence of humans and human activities in permanent buildings in the Antarctic may be a matter of concern if the population density increases without considering the lasting effects on air quality.
References
ABT, E. et al. Relative Contribution of Outdoor and Indoor Particle Sources to Indoor
Concentrations. Environmental Science and Technology, v. 34, n. 17, p. 3579–3587, 2000.
ANNESI-MAESANO, I. et al. Residential Proximity Fine pArticles Related to Allergic Sensitisation and Asthma in Primary School Children. Respiratory Medicine, v. 101, n. 8, p.
1721–1729, 2007.
BRANIŠ, M.; ŘEZÁČOVÁ, P.; DOMASOVÁ, M. The Effect of Outdoor Air and Indoor Human Activity on Mass Concentrations of PM10, PM2.5, and PM1 in a Classroom. Environmental
Research, v. 99, n. 2, p. 143–149, 2005.
BRASIL. Decreto no 2.742, de 20 de agosto de 1998. Brasília, 1998.
BUONANNO, G.; MORAWSKA, L. Ultrafine Particle Emission of Waste Incinerators and Comparison to the Exposure of Urban Citizens.
Waste Management, v. 37, p. 75-81, mar. 2014.
CONNER, T. L.; WILLIAMS, R. W.
Identification of Possible Sources of Particulate Matter in the Personal Cloud Using SEM/EDX.
Atmospheric Environment, v. 38, n. 31, p. 5305–
5310, 2004.
FROMME, H. et al. Particulate Matter in the Indoor Air of Classrooms-Exploratory Results From Munich and Surrounding Area.
Atmospheric Environment, v. 41, n. 4, p. 854–
866, 2007.
GÉHIN, E.; RAMALHO, O.; KIRCHNER, S. Size Distribution and Emission Rate Measurement of Fine and Ultrafine Particle From Indoor Human Activities. Atmospheric Environment, v. 42, n.
35, p. 8341–8352, 2008.
GELLER, M. D. et al. Indoor/Outdoor
Relationship and Chemical Composition of Fine and Coarse Particles in the Southern California Deserts. Atmospheric Environment, v. 36, n. 6,
p. 1099–1110, 2002.
GODISH, T. Air Quality. 4th ed. Michigan: Lewis
Publishers, 2003.
HAMPEL, R. et al. Long-Term Effects of Elemental Composition of Particulate Matter on Inflammatory Blood Markers in European Cohorts. Environment International, v. 82, p.
76–84, sep. 2015.
HE, C. et al. Contribution From Indoor Sources to Particle Number and Mass Concentrations in Residential Houses. Atmospheric Environment,
v. 38, n. 21, p. 3405–3415, 2004.
INSTITUTO DE ARQUITETOS DO BRASIL.
Termo de Referência Estação Antártica
Comandante Ferraz. Rio de Janeiro, 2013.
INTERNATIONAL ORGANIZATION FOR STANDARDIZATION. ISO 16000-1: indoor air:
general aspects of sampling strategy. Geneve, 2006.
LEE, S. C.; LI, W. M.; YIN CHAN, L. Indoor Air Quality at Restaurants With Different Styles of Cooking in Metropolitan Hong Kong. Science of the Total Environment, v. 279, n. 1/3, p. 181–
193, 2001.
LIN, H. et al. Quantifying Short-Term and Long-Term Health Bene Fits of Attaining Ambient Fine Particulate Pollution Standards in Guangzhou, China. Atmospheric Environment, v. 137, p. 38–
44, jul. 2016.
MAMANE, Y. Estimative of Municipal Refuse Incinerator Contribution to Philadelphia Aerosol Using Single Particle Analysis - II. Ambient Measurements, v. 24, n. 1, p. 127–135, 1990.
MAO, I. F. et al. Airborne Particle PM2.5/PM10 Mass Distribution and Particle-Bound PAH Concentrations Near a Medical Waste Incinerator.
Atmospheric Environment, v. 41, n. 11, p. 2467–
Ambient e Const ruído, Port o Alegre, v. 18, n. 1, p. 463-477, j an. / mar. 2018.
Pagel, E. C.; Reis Júnior, N. C. ; Alvarez, C. E. de; Sant os, J. M.
476
MARÈ, R.; LEITE, B. C. C. Estudo da
Contribuição de Um Sistema de Ar Condicionado Com Distribuição de Ar pelo Piso Para a Remoção de Particulados e Dióxido de Carbono do Ar de Um Ambiente interno. Ambiente Construído,
Porto Alegre, v. 13, n. 4, p. 7–14, out./dez. 2013. MISHRA, V. K. et al. Aerosol Composition and Its Sources at the King Sejong Station, Antarctic Peninsula. Atmospheric Environment, v. 38, n.
24, p. 4069–4084, 2004.
PAGEL, É. C. et al. Characterization of the Indoor Particles and Their Sources in an Antarctic Research Station. Environmental Monitoring and Assessment, v. 188, n. 167, 2016.
PANT, V.; SIINGH, D.; KAMRA, A. K. Size Distribution of Atmospheric Aerosols at Maitri, Antarctica. Atmospheric Environment, v. 45, n.
29, p. 5138–5149, 2011.
PEREIRA, E. B.; LOUREIRO, A. L. M.; VASCONSELLOS, M. B. V. Reconnaissance of Elemental Composition in Aerosols of the Antarctic Peninsula. Atmospheric Environment. Part A. General Topics, v. 26, n. 8, p. 1549–
1550, 1992.
SANTOS, J. M. et al. Experimental Investigation of Outdoor and Indoor Mean Concentrations and Concentration Fluctuations of Pollutants.
Atmospheric Environment, v. 45, n. 36, p. 6534–
6545, 2011.
SEAMAN, V. Y.; BENNETT, D. H.; CAHILL, T. M. Indoor Acrolein Emission and Decay Rates Resulting From Domestic Cooking Events.
Atmospheric Environment, v. 43, n. 39, p. 6199–
6204, 2009.
TAN, C. C. L. et al. Experimental Investigation of Indoor Air Pollutants in Residential Buildings.
Indoor and Built Environment, v. 22, n. 3, p.
471–489, 2013.
TANER, S.; PEKEY, B.; PEKEY, H. Fine Particulate Matter in the Indoor Air of Barbeque Restaurants: elemental compositions, sources and health risks. Science of the Total Environment,
v. 454–455, p. 79–87, 2013.
TEINILÄ, K. et al. A Study of the Sea-Salt Chemistry Using Size-Segregated Aerosol Measurements at Coastal Antarctic Station Neumayer. Atmospheric Environment, v. 96, p.
11–19, 2014.
TRAN, D. T. et al. Indoor-Outdoor Behavior and Sources of Size-Resolved Airborne Particles in French Classrooms. Building and Environment,
v. 81, p. 183–191, 2014.
UHDE, E. et al. Impact of Air Fresheners on Indoor Air Quality. Atmospheric Environment,
v. 106, p. 492–502, 2015.
VARGAS, P. S. de P. et al. As Novas Estações Antárticas e a Busca Pela Otimização dos Sistemas Construtivos e Maior Eficiência Energética. In: ENCONTRO LATINOAMERICANO DE EDIFICAÇÕES E COMUNIDADES SUSTENTÁVEIS, Curitiba, 2013. Anais...
Curitiba, 2013.
VIANA, M.; DÍEZ, S.; RECHE, C. Indoor and Outdoor Sources and Infiltration Processes of PM1 and Black Carbon in an Urban Environment.
Atmospheric Environment, v. 45, n. 35, p. 6359–
6367, 2011.
WALLACE, L. et al. Continuous Weeklong Measurements of Personal Exposures and Indoor Concentrations of Fine Particles for 37 Health-Impaired North Carolina Residents For Up to Four Seasons. Atmospheric Environment, v. 40, n. 3, p. 399–414, 2006.
Acknowledgements
Erica Coelho Pagel
Laborat ório de Recursos At mosféricos, Depart ament o de Engenharia Ambient al | Universidade Federal do Espírit o Sant o | Avenida Fernando Ferrari, 514, Goiabeiras | Vit ória - ES – Brasil | CEP 29075-910 | Tel.: (27) 3335-2177 | E-mail: erica.pagel@gmail.com
Neyval Cost a Reis Júnior
Depart ament o de Engenharia Ambient al, Cent ro Tecnológico | Universidade Federal do Espírit o Sant o | Tel.: (27) 3335-2177 | E-mail: neyval@inf .ufes. br
Crist ina Engel de Alvarez
Depart ament o de Arquit et ura e Urbanismo, Cent ro de Art es | Universidade Federal do Espírit o Sant o | Tel.: (27) 4009-2581 | E-mail: crist ina.engel@ufes. br
Jane Méri Santos
Depart ament o de Engenharia Ambient al, Cent ro Tecnológico | Universidade Federal do Espírit o Sant o | Tel.: (27) 3335-2066 | E-mail: j merisant os@yahoo.com. br
Revist a Ambient e Const r uído
Associação Nacional de Tecnologia do Ambient e Const ruído Av. Osvaldo Aranha, 99 - 3º andar, Cent ro
Port o Alegre – RS - Brasil CEP 90035-190 Telef one: +55 (51) 3308-4084