Setembro, 2017
David Marques da Cruz
Licenciado em Bioquímica
FucoPol: Studies for drilling fluids design
Dissertação para obtenção do Grau de Mestre em
Biotecnologia
Orientador: Cristiana Andreia Vieira Torres, Post-Doc
Researcher, FCT-UNL
iii
David Marques da Cruz
Licenciado em Bioquímica
FucoPol: Studies for drilling fluids design
Dissertação para obtenção do Grau de Mestre em Biotecnologia
Orientadora: Cristiana Andreia Vieira Torres
Co-orientadora: Doutora Maria Filomena Andrade de Freitas
v
FucoPol: Studies for drilling fluids design
Copyright © David Marques da Cruz, Faculdade de Ciências e Tecnologia,
Uni-versidade Nova de Lisboa.
vii
Agradecimentos
O final desta etapa da minha vida ficou marcado com este trabalho, que contou com a ajuda de muitas pessoas a que devo agradecer.
Gostava de mostrar a minha gratidão e o meu maior agradecimento à minha orientadora, Cristiana Torres, e à minha co-orientadora, Filomena Freitas, por toda a ajuda que me prestaram, por toda a paciência que tiveram comigo e por todo o conhecimento que me transmitiram ao longo da realização deste trabalho.
Também gostava de agradecer ao Prof. Vítor Alves por toda a ajuda que se disponibilizou a dar me enquanto realizei os ensaios no Instituto Superior de Agronomia, também sem esta ajuda a realização deste trabalho não teria sido possível.
Reconheço também toda a ajuda disponibilizada por todos os membros do grupo BIOENG, com quem partilhei o meu dia a dia no laboratório e que sem ajuda deles tudo se teria tornado bastante mais complicado.
ix
Resumo
Apesar dos fluidos mais eficazes na exploração de petróleo serem à base de derivados de
petróleo, eles são poluentes. Soluções alternativas à base de água têm sido desenvolvidas, nas
quais se usam polímeros naturais. Contudo, os polímeros naturais mais utilizados são a goma
de guar e o xantano, que também são usados na área alimentar. Por essa razão, a sua elevada
procura pode provocar um aumento do seu preço e consequentemente do preço dos alimentos
onde são usados.
Deste modo, este trabalho centrou-se na caraterização das propriedades reológicas do
polissacárido bacteriano FucoPol, tendo como objetivo final o desenvolvimento de um fluido à
base de água, o qual possa substituir os fluídos constituídos por polímeros naturais usados na
indústria alimentar.
A produção de FucoPol através do cultivo da bactéria Enterobacter A47 foi realizada em
condições controladas de temperatura e pH controlada (30 ºC e 7, respetivamente). A produção
foi realizada num bioreactor de 10 L, atingindo uma produtividade volumétrica de 1.83 g L-1 d-1,
correspondendo a uma produção máxima de FucoPol de 7.21 g L-1. O polímero tem um peso
molecular elevado (2.14x10⁶) e é constituído por fucose (37 wt.%), galactose (23 wt.%), glucose
(34 wt.%) e ácido glucurónico (6 wt.%).
As curvas de escoamento das soluções de FucoPol apresentaram um comportamento
reofluidificante nas diferentes concentrações (0.5-1.5 wt.%), temperaturas (20-80 ºC) e
condi-ções de salinidade testadas (NaCl, KCl and CaCl2 3wt.%). O FucoPol em solução aquosa
de-monstrou ser resistente à variação de temperatura e a concentrações de sal elevadas. A
visco-sidade aparente (0.34-15.92 Pa s) foi semelhante à goma de guar (0.105-387.7 Pa s) e muito
inferior ao xantano (0.56-1164 Pa s).
Foi também avaliada a relação sinérgica entre o FucoPol e o xantano, assim como entre
o FucoPol e a goma de guar. Na formulação 20:80 (xantano:FucoPol) a viscosidade da solução
aumentou devido à presença de xantano.
Desenvolveu-se uma formulação de um fluido contendo FucoPol. Esta formulação tem
um comportamento reofluidificante em água destilada. Em concentrações elevadas de sal (NaCl
3% wt.), a viscosidade aparente manteve-se semelhante ao comportamento em água, o mesmo
comportamento não se observou na goma de guar. Relativamente aos ensaios mecânicos a
formulação apresenta um comportamento típico de um fluido em água e em sal, por sua vez a
formulação contendo goma de guar apresenta um comportamento típico de gel fraco em água e
de fluido em sal.
Palavras-chave:
xi
Abstract
Although the most effective oil drilling fluids are oil based, they are quite polluting. Alterna-tive water based fluids have been developed in which natural polymers are used as thickening agents, due to their high viscosity at low concentrations. The most used polymers for this appli-cation are xanthan and guar gum, which are also used in food industry. Therefore, the use of these polymers in drilling fluids can trigger an increase in their price, thus inflating the price of the food products.
Therefore, this work was focused on the characterization of the rheological properties of
the bacterial polysaccharide FucoPol, aiming to develop a water-based fluid, in order to replace
fluids composed of natural polymers which are also used in the food industry.
FucoPol production through culture of Enterobacter A47 bacteria was performed under
controlled temperature and pH controlled conditions (30 ºC and 7, respectively) in a 10 L
biore-actor. The volumetric productivity was 1.83 g L-1 d-1, corresponding to a maximum FucoPol
con-centration of 7.21 g L-1. The polymer has a high molecular weight (2.14x10⁶) and is composed of
fucose (37 wt.%), galactose (23 wt.%), glucose (34 wt.%) and glucuronic acid (6 wt.%).
FucoPol flow curves presented a shearthinning behavior at different concentrations (0.5
-1.5% wt.), temperatures (20-80ºC) and salinity conditions (NaCl, KCl and CaCl2 3% wt.). In
aque-ous solution, it showed to be resistant to temperature variation and high salt concentrations. Its
apparent viscosity (0.34-15.92 Pa s) is similar to that of guar gum (0.105-387.7 Pa s) and much
lower than xanthan (0.56-1164 Pa s).
The synergistic relation between FucoPol and xanthan, as well as between FucoPol and
Guar gum, was also evaluated for different polymers’ proportions. In the 20:80 formulation
(xan-than:FucoPol) the solution’s viscosity increased due to the presence of xanthan.
A fluid formulation containing FucoPol was designed showing shear-thinning behavior in
deionized water. At high salt concentrations (NaCl 3 wt.%) the apparent viscosity was similar to
the values obtained in water. The same stability was not observed in the guar gum formulation.
Considering the dynamic measurements, FucoPol formulation showed a liquid-like behavior in
deionized water and in salt, while guar gum formula had a weak-gel behavior in deionized water
and liquid-like in salt.
Keywords:
xiii
List of Contents
INTRODUCTION ... 1
1.1. DRILLING FLUIDS ... 1
1.2. MICROBIAL EXOPOLYSACCHARIDES (EPS) ... 3
1.3. MOTIVATION ... 5
MATERIALS AND METHODS ... 7
2.1. FUCOPOL PRODUCTION ... 7
2.2. FUCOPOL CHARACTERIZATION... 8
2.3. RHEOLOGICAL MEASUREMENTS ... 9
RESULTS AND DISCUSSION ... 11
3.1. FUCOPOL PRODUCTION ... 11
3.2. FUCOPOL CHEMICAL COMPOSITION ... 12
3.2.1. Sugar composition ... 12
3.2.2. Molecular weight ... 12
3.3. RHEOLOGICAL STUDIES ... 12
3.3.1. Steady-shear behavior of EPS solution at different temperatures and concentrations ... 12
3.3.2. Steady-shear behavior of EPS solution at different temperatures in presence of KCl and CaCl2 19
3.3.3. FucoPol hydration tests ... 21
3.3.4. Oscillatory measurements ... 22
3.3.5. Rheological studies of synergetic effect between Fucopol and Xanthan and FucoPol and Guar gum: Steady-shear and mechanical behavior ... 26
3.3.6. Formulation for drilling mud using FucoPol ... 30
CONCLUSIONS AND FUTURE WORK ... 33
REFERENCES ... 35
xiv
List of Figures
Figure 3.1 - Flow curves (steady state) profile of FucoPol, xanthan and guar gum aqueous solutions in deionized water at different temperatures...14
Figure 3.2- Flow curves (steady state) profile of FucoPol, xanthan and guar gum aqueous solutions in NaCl
3 wt.% at different temperatures………..…….18
Figure 3.3 - Flow curves (steady state) profile of FucoPol, xanthan and guar gum aqueous solution 1 wt.% in KCl 3 wt.% and in CaCl2 3 wt.% at different temperatures………20
Figure 3.4 - Flow curves (steady state) profile of Fucopol aqueous solutions in dionized water with thermic
treatment at different temperatures………...22
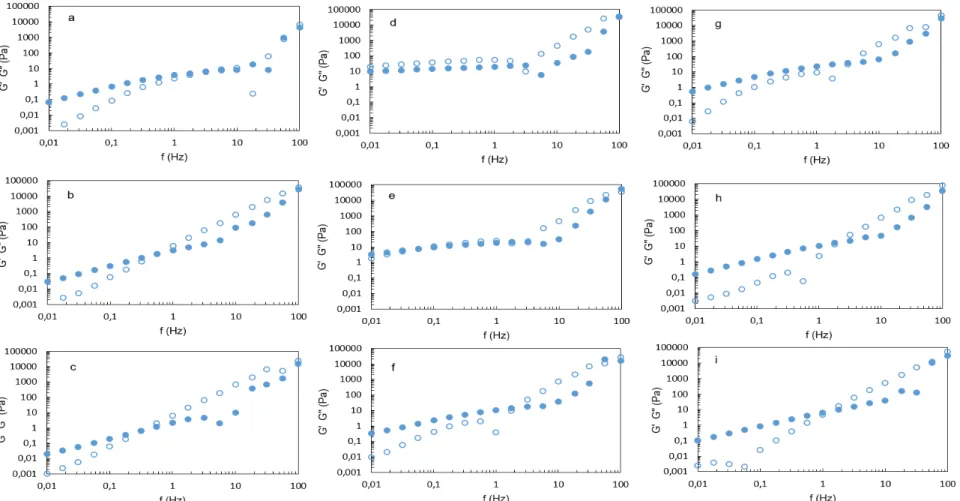
Figure 3.5 - Mechanical spectra of Fucopol, xanthan and guar gum 1 wt.% aqueous solutions in deionized
water at different temperatures………..23
Figure 3.6 - Mechanical spectra of Fucopol, Xanthan and guar gum 1% wt. aqueous solutions in brine (NaCl
3 wt.%) at 20ºC. ……….……….25
Figure 3.7 - Flow curves (steady state) profile of mixture of FucoPol and xanthan aqueous solution 1 wt.% thermic treated in deionized water at 20ºC in different proportions. ………..………....26
Figure 3.8 - Flow curves (steady state) profile of mixture of FucoPol and guar gum aqueous solution 1 wt.% thermic treated in deionized water at 20ºC in different proportions. ………..……….27
Figure 3.9 - Mechanical spectra of mixture of Xanthan:FucoPol and guar gum:FucoPol aqueous solution (1 wt.%) thermic treated in deionized at 20ºC in different proportions. ………28
Figure 3.10 - Flow curves (steady state) profile of mixture of FucoPol and xanthan aqueous solution and mixture of FucoPol and guar gum aqueous solution 1 wt.% thermic treated in 3 wt.% NaCl at 20ºC in different
proportions. ………..29
xv
Figure 3.12- Flow curves (steady state) profile of formulation of FucoPol and guar gum in deionized waterand in NaCl 3 wt.% at 20ºC……….31
Figure 3.13 - Mechanical spectra of formulation of FucoPol in deionized water and in NaCl 3 wt.% and Guar
gum in deionized water and in NaCl 3 wt.% at 20ºC………32
List of Tables
Table 3.1– Power law model parameters for FucoPol, xanthan and guar gum aqueous solutions in deionized
xvi
Table 3.2– Power law model parameters for FucoPol, xanthan and guar gum aqueous solutions in NaCl 3 wt.%....19xvii
DO Dissolved oxygen
EPS Exopolysaccharide
G’ Storage moduli
G’’ Loss moduli
HPLC High performance liquid chromatography
K Consistency index
n Power law index
OBM Oil based mud
SBM Synthetic based mud
SEC-MALLS Size exclusion chromatography-multi-angle laser light scattering
WBM Water based mud
1
Introduction
1.1. Drilling fluids
Drilling fluids (or muds) have a very important role in drilling processes, as they have to
possess a suitable viscosity in order to suspend and transport the cuttings efficiently. The role of
polymers in drilling muds is as thickeners, providing viscosity to those muds (Gao et al., 2015).
The general functions of drilling fluids in a drilling process is carrying cuttings from the
hole, cool and clean the drill bit, reduce friction between the drill pipe and wellbore, maintaining
the stability of the wellbore, form a thin, low-permeable filter cake and do not damage the product
and the environment. In the process of drilling, each of these functions has different relevance at
specific stages of the process (Caenn and Chillingar, 1995).
The research and development of these fluids have been centered on additives and
sys-tems for wellbore stability, hole cleaning, lubricity and environmental safety (Caenn and
Chillin-gar, 1995).
There is a large number of different processes in drilling, like horizontal and vertical
drill-ing, inclined drilling and sub-sea and deep-sea drilling. To drill in these different conditions the
fluid (mud) chosen has to be designed regarding the necessities of each well (Shah et al., 2010).
There are many factors that influence the design of a mud. These factors are mainly the
well’s type and design, rock mechanics, formation chemistry, the need to minimize damage to formations and economics. To correspond to these factors, a high number of properties must be
correlated upon designing drilling fluids. The five basic properties are rheology, density, fluid loss,
solids content and chemical properties. These properties are monitored during drilling and usually
are defined by well program (Bloys et al., 1994).
2
The rheological properties give information about the viscosity and viscoelastic propertiesof the mud. A high viscosity is important in the role of carrying cuttings to the surface. However,
if it is extremely high, friction may disable fluid circulation resulting in an excessive pump pressure
and in a decreasing of the drilling rate (Bloys et al., 1994).
Drilling muds can be classified as water based mud (WBM), oil based mud (OBM),
syn-thetic based mud (SBM), emulsions, invert emulsions, air and foam fluids. This classification
de-rives from the base fluid used in the fluid preparation (Bloys et al., 1994, Caenn and Chillingar,
1995).
Water based mud (WBM)
In this type of mud, the base fluid used is water or brine. Normally, WBM have polymers
as additives, possessing the function of thickening agents. Innumerous types of polymers can be
used, synthetic and biopolymers (for example, xanthan and guar gum) (Shah et al., 2010).
Bi-opolymers provide to the mud a great capacity of suspension and carrying the cuttings, because
of their high low-shear-rate viscosities. (Caenn and Chillingar, 1995)
The great advantage of this type of mud in relation with OBM is the environmental impact.
With the start of legislation prohibiting or limiting the use of oil based muds, because of their
negative environmental impact, the research in this type of muds (WBM) has increased a lot
(Bloys et al., 1994). Other advantage is economical, because this type of muds is relatively
cheaper than OBMs (Shah et al., 2010).
Oil based mud (OBM)
The base fluids in this case are oils, like diesel oil, paraffinic and naphthenic oils (Davies
et al., 1984). The formulations for these fluids are more complex and expensive than that for
WBM. This type of mud has great advantages, like great fluid loss control, no shale swelling, great
lubrication of the bit and good response in carrying cuttings. The biggest disadvantage of this
type of muds are the possible environmental concerns behind the use of this muds. One example
of concern is the oil penetration in aquifers. (Shah et al., 2010)
Synthetic based muds (SBM)
SBM are very similar with OBM being the base fluid the major difference. The base fluid
used in these muds are synthetic materials, like polyphia-olefins, esters and ethers. However,
SBMs uses a low aromatic content in comparison with OBMs, so is more environmental friendly
3
Air drilling fluidsThese drilling fluids are used when the reservoir presents some specifications, for
exam-ple, when there is no contact with hydrocarbons or water in the reservoir. Air drilling fluids’ best
advantage is their high rate of penetration, there is no solid contamination and no formation
dam-age. Economically, these fluids are very interesting because they may be recirculated numerous
times (Shah et al., 2010).
Biopolymers in drilling fluids
The drilling fluids have the role of ascending cuttings and clean the hole. For this, they
must present specific properties in relation with the rock reservoir where it will be used. One of
the most important are the rheological properties of the fluid. In water based muds (WBM) these
are intrinsically related to the hydrophilic polymers present in the formulations. The use of different
polymers confers different viscosity properties in water and in the mud where it is used (Hamed
et al., 2009).
The polymers normally used in WBM are xanthan gum, guar gum, cellulose based,
pol-yacrylates and others. In fact, guar gum and xanthan gum are used in large amounts. These
biopolymers are also used in the food industry. The shift of their application to WBM have had as
consequence a decrease of their availability in the market and an increase of their price. As such,
the study of the applicability in WBM of novel low cost biopolymers not used in the food industry,
such as novel microbial polysaccharides, is very welcome (Hamed et al., 2009, Cruz et al., 2011,
Torres et al., 2015).
1.2. Microbial Exopolysaccharides (EPS)
The production of biopolymers by microbial production permits an easy and higher
pro-duction than biopolymers produced by plants (galactomannans, starch, pectin, etc.) and algae
(carrageenan, alginate, agar, etc.), because microbial production is not dependent of season of
the year and climate conditions (Alves et al., 2010, Torres et al., 2011).
Microbial production using bioreactors enables an easier control and manipulation of
pro-cess conditions, in order to obtain the desired growth conditions, production rate and biopolymer
characteristics. The EPS quantity and composition produced by one bacteria is influenced by its
own genetic code, by the components present in the culture medium and by the cultivation
con-ditions (Freitas et al., 2010, 2011).
Bacterial exopolysaccharides are biopolymers that are resultant of cellular metabolism
4
Generally, EPS production is characterized by having excess of carbon source, havingother nutrient present in the fermentative process the role of limiting nutrient (nitrogen) (Freitas et
al., 2011, Torres et al., 2014).
In the majority of exopolysaccharides, the changes in the culture conditions do not modify
the basic structure of biopolymers, but change significantly the substituents groups and this
af-fects significantly the biopolymers properties (Freitas et al., 2011).
The majority of exopolysaccharides is normally composed by repeated units of sugars,
being the more common glucose, galactose and mannose, with varied sizes and branches. This
is possible because of glyosidic links that are possible to form during the polymerization (Freitas
et al., 2011).
The application of these EPSs in various industries has grown, because they can be used
as other biomaterials due to their unique properties, like their rheological properties. These
prop-erties are dependent on the chemical composition, molecular structure and average molecular
weight of the polymers (Freitas et al., 2011).
Exopolysaccharides structure
Polysaccharides are normally formed by repeated units of monomers of sugars linked by
glyosidic links. These linkages can be α or β and can be done between carbon one of one
mon-omer and carbon 3 of other monmon-omer (1→3), the same is true for (1→4), (1→2) and (1→5). This phenomenon permits the occurrence of linear or branched structures (Pinheiro, 2013).
The structure formed is determinant to polymers properties. For example, cellulose and
amylose are two glucans where the only difference between them are that the cellulose is β-1,4
linked and amylose is α-1,4 linked. However, the cellulose is water insoluble and amylose is water soluble (Feng and Ye, 2013). This can show how different structures can change significantly the
properties of a polysaccharide.
Examples of microbial exopolysaccharides
A large variety of bacterial EPSs have been studied and some of them commercialized.
Some examples are xanthan, gellan, dextran, hyaluronic acid and alginate.
Xanthan was the first microbial biopolymer produced industrially. This EPS is secreted by
bacteria of the Xanthomonas genus. This biopolymer is constituted by a glucose skeleton with
lateral substituents groups that can contain glucuronic acid, mannose, pyruvate and acetate. This
EPS has multiple applications in pharmaceutical, petroleum, food and cosmetic industries (Freitas
5
Gellan has an anionic character and is secreted by Pseudomonas elodea. Gellan iscon-stituted by repeating units of glucose, glucuronic acid, and rhamnose. The main applications of
this biopolymer are in food and pharmaceutical industries (Nickerson et al., 2002).
Dextran is a homopolysaccharide composed of glucose. This polymer is resultant of
su-crose catabolism. The enzyme responsible by this catabolic process is produced by bacterium of
the genus Streptococus and Lactobacillus. Dextran is mainly used in medicine and food industry
(Freitas et al., 2011).
Hyaluronic acid is produced by Pseudomonas aeruginosa strains and is composed of
repeating units of glucuronic acid and acetylglucosmine disaccharides. The applications for this
polymer are mainly cosmetic and medical (Freitas et al., 2011).
Alginate is a linear polymer constituted by glucuronic and mannuronic acid, extracted
from algae or secreted by Azotobacter and Pseudomonas bacteria. This EPS has multiple
appli-cations in food and medicine industries. (Freitas et al., 2011)
More recently, the production of a novel fucose rich bacterial exopolysaccharide
(Fuco-Pol), was reported. (Freitas et al., 2010, 2011). FucoPol is a polysaccharide with high molecular
weight ((2.0-10.0) x106), and is produced by Enterobacter A47 bacterium using a large variety of
carbon sources, like glycerol, glucose and xylose (Freitas et al., 2014, 2017).
This polymer is mainly constituted by sugars (galactose, glucose, fucose and glucuronic
acid) and acyl groups (pyruvate, succinate and acetate) (Antunes et al., 2016, Torres et al., 2014).
FucoPol in aqueous solution presents a thickening behavior, viscoelastic properties,
emulsifying and flocculating capacity (Cruz et al., 2011). These properties make FucoPol a
po-tential alternative to guar gum and xanthan in the formulation of water based drilling fluids for the
petroleum industry.
1.3. Motivation
The most efficient fluids from oil based sources are composed of oil, crude or synthetic,
however they have a high impact on the environment. In order to reduce the toxicity of these
fluids, water based solutions with natural polymers have been developed. These polymers should
have high viscosity at low concentrations, shear-thinning behavior and stability at different pH
(high) values, temperature and salinity. Nowadays, the most used natural polymers for oil
recov-ery are guar gum and xanthan. However, these polymers are also used in the food industry. The
high demand for these products can cause an increase in their price and, consequently, an
6
In order to solve this problem, the global aim of this work was to produce a water baseddrilling fluid using Fucopol, a bacterial polysaccharide produced by Enterobacter A47, that has
the capacity to form viscous solutions at low concentrations.
Rheological properties are one of the most important properties of a drilling fluid and
these properties are conferred by the polymers, which are one of the components of a drilling
fluid.
The following objectives were envisaged to understand if FucoPol fits the properties to be
used in water based drilling:
1 – Evaluation of the effect of concentration and temperature in the rheological properties of FucoPol aqueous solutions. Compare to xanthan and guar gum aqueous solutions.
2 – Evaluation of salt effect: NaCl, KCl and CaCl2.
3 – Study of synergetic relations between xanthan and FucoPol and guar gum and Fuco-Pol.
7
Materials and Methods
2.1. FucoPol Production
Microorganism
FucoPol was produced by the bacterium Enterobacter A47 (DSM 23139).
Cultivation media
Enterobacter A47 was grown on a slightly modified Medium E* (pH 7.0) (Brandl et al.,
1988), with the following composition (per liter): (NH4)2HPO4, 3.3 g; K2HPO4, 5.8 g; KH2PO4, 3.7
g; 10 mL of a 100 mM MgSO4 solution and 1 mL of a micronutrient solution. The micronutrient
solution had the following composition (per liter of 1 N HCl): FeSO4·7H2O, 2.78 g; MnCl2·4H2O,
1.98 g; CoSO4·7H2O, 2.81 g; CaCl2·2H2O, 1.67 g; CuCl2·2H2O, 0.17 g; ZnSO4·7H2O, 0.29 g (pH
7.0). Medium E* was supplemented with glycerol (Sharlau 86-88 wt.%) in a concentration of 40 g
L-1. The Medium E*, MgSO
4, micronutrient solution and glycerol were autoclaved (20 minutes at
120ºC, 1 bar) separately.
Inocula preparation
First, a single colony of Enterobacter A47 isolated from a Chromagar (CHROMagarTM)
plate (previously incubated at 30 ºC for 24 h) was inoculated in LB Medium (50 mL) and incubated
for 20 hours, at 30 ºC and 200 rpm. LB medium (per liter) was constituted by tryptone 10 g, yeast
extract 5 g and NaCl 10 g.
Then, the culture grown on LB Medium was used to prepare the inoculum for the
biore-actor experiment. The LB grown culture (80 mL) was transferred to 800 mL Medium E*
supple-mented with glycerol (200 g L-1), incubated for 72 hours at 30ºC and 200 rpm.
8
EPS production (Bioreactor assay)
This assay was performed in a 10 L bioreactor (BioStat B-plus, Sartorius) with an initial
volume of 7.96 L, with controlled temperature at 30 ºC and pH 7. Enterobacter A47 was grown
on a Medium E*, supplemented with glycerol (40 g L-1). This reactor was operated in a batch
mode on a first stage (~10 h). Then, after nitrogen depletion, a feeding solution containing
Me-dium E* supplemented with 200 g L-1 glycerol was add to the bioreactor at a rate of 20 mL h-1.
The dissolved oxygen (DO) concentration was controlled by automatic variation of the stirrer
speed (300-800 rpm), provided by two six-blade impellers. DO was maintained below 10% during
the fed-batch phase.
FucoPol Extraction and Purification
At the end of cultivation run, the culture broth was diluted (1:5, v/v) to reduce its viscosity.
The diluted broth was centrifuged (8000 rpm, 30 min) to remove bacterial cells. The supernatant
that resulted from the centrifugation was submitted to a thermal treatment (70 ºC, 1 h) to
guaran-tee the inactivation of bacterial enzymes. Then, it was centrifuged (8000 rpm, 30 min) again, to
remove precipitated proteins and remaining cells. After this, the supernatant was submitted to a
diafiltration process, using a crossflow membrane cassette (Hydrosart Ultrafiltration Cassetes,
Sartorius Stedim Biotech GmbH, Germany) with a cut-off of 100 kDa and a surface area of 0.6
m2, operated at transmembrane pressure of 0.4 bar, to remove low molecular weight
contami-nants, e.g. salts, glycerol and proteins. After impurities removal, the treated supernatant
contain-ing FucoPol was concentrated (5:1) uscontain-ing the same membrane module, switchcontain-ing to an
ultrafil-tration process mode. The obtained solution was freeze dried (Martin Christ, model Epsilon 2– 40, Germany) during 48 h and the obtained FucoPol was stored at ambient temperature in a
closed vessel.
2.2. FucoPol Characterization
Sugar Composition
For the analysis of the sugar composition of the FucoPol produced, dried samples (~5
mg) were hydrolyzed with trifluoroacetic acid (TFA) (0.1 mL TFA 99%). After this, the hydrolysate
was used for the identification and quantification of the constituent sugar monomers by liquid
chromatography (HPLC). For this, a CarboPac PA10 column (Dionex) was used. This analysis
was performed at 30 ºC, using sodium hydroxide (4 mM NaOH) as eluent, at a flow rate of 0.9
mL min-1. Fucose (98%, Sigma), glucose (99%, Merck), galactose (99%, Flucka) and glucuronic
9
Average Molecular Weight
The average molecular weight (Mw) of the produced FucoPol was determined by size
ex-clusion chromatography-multi-angle laser light scattering (SEC-MALLS). The FucoPol solution
were prepared in 0.1 M Tris-HCl, NaCl (0.2 M), pH 8.09 buffer, in form to achieve a concentration
of 2 mg mL-1. The buffer previously mentioned was also the SEC mobile phase. The SEC columns
(PL aquagel-OH mixed 8 µm, 300x7.5 mm) used were equilibrated for 24h before running the
analytical test. The flow rate used was 1 mL min-1. The resultant signals from MALLS were
rec-orded and treated to discover the purity and molecular mass distribution. Dn/dc of 0.190 mL g-1
was used to calculate the Mw of FucoPol.
2.3. Rheological Measurements
Flow Curves and Mechanical spectra
The rheology measurements of FucoPol, xanthan (Sigma) and guar gum (Sigma) aqueous
solutions were measured by loading directly the different solutions in the cone and plate geometry
(diameter 3.5 cm, angle 2º) of a controlled stress rheometer (Rheostress MARS III and
Rhe-ostress RS 75, Haake, Germany). The geometry was covered with paraffin oil during
measure-ments to prevent water evaporation.
To determine the linear viscoelastic region, strain sweeps at 1 Hz were performed. After
this, Frequency sweeps were performed to measure the storage moduli (G’) and loss moduli (G’’)
at different temperatures (20, 60 and 80 ºC). These measurements were executed at a controlled
stress that was within the linear viscoelastic region measuring the dynamic moduli G’ and G’’.
To resolve the flow curves were used a steady-state flow ramp (torque was imposed using
a logarithmic ramp) using a range of shear rates from 0.01-500 s-1.
Preparation of Polymer solutions
FucoPol, xanthan and guar gum solutions were prepared by dissolving each polymer in
deionized water, the polymer was added to the deionized water under stirring and maintained
under stirring overnight (~20 hours)
To study the effect of polymer concentration and temperature on the rheological
proper-ties, were prepared aqueous solutions with different concentrations (0.5; 1.0; 1.5 wt.%) and the
flow curves measurements were performed at different temperatures (20, 40, 60 and 80ºC).
In order to study the effect of salinity in the rheological properties of the polymers,
10
polymer concentrations were used and the same temperatures were tested (20, 40, 60 and 80ºC). To study the effect of two other salts (KCl and CaCl2), solutions with a polymer concentration
of 1 wt. % were prepared in KCl 3 wt. % and CaCl2 3 wt. % separately and the flow curves were
performed at three different temperatures (20, 60 and 80 ºC).
With the objective to study the hydration of FucoPol, the solutions of FucoPol were
pre-pared as described above (with agitation, overnight, ~20 hours), but after this a thermic treatment
was performed, where the solutions were submitted to 80 ºC, with agitation, for ~1 h. These
so-lutions were prepared with the same polymer concentrations (0.5; 1.0; 1.5 wt. %) and the flow
curves measurements were made at the same temperatures (20, 40, 60 and 80 ºC).
For the oscillatory measurements, the solutions were made as described for the hydration
studies, with a polymer concentration of 1.0 % wt., in deionized water, and the mechanical spectra
were performed at 20, 60 and 80 ºC. For the mechanical spectra in brine conditions (NaCl 3
wt.%), the polymer solutions were prepared in the same way (i.e., with the thermal treatment at
80 ºC) with a polymer concentration of 1 % wt. These mechanical spectra were obtained only at
20 ºC.
To evaluate the synergies between FucoPol and the two other polymers studied (xanthan
and guar gum), polymer solutions were prepared separately, with 1 % wt. of polymer
concentra-tion in dionized water. After the over-night agitaconcentra-tion (~20 h), FucoPol:xanthan and FucoPol:guar
mixtures were prepared in 20:80, 50:50 and 80:20 proportions, and submitted to the thermal
treat-ment at 80 ºC, for 1 h. The flow curves and the mechanical spectra were performed at 20 ºC. The
assays were repeated for solutions that were made with the same method but in NaCl 3 % wt..
Drilling Fluid Formulation
A drilling formulation containing FucoPol was prepared to evaluate its properties. A
Fu-coPol solution with 1 % wt. of polymer concentration was prepared in deionized water, as
de-scribed above (agitation for ~20 h at room temperature, followed by agitation at 80 ºC for 1 h).
Then, the other components of formulation were added under stirring: bentonite, in a
concentra-tion of 3.7 % wt., and calcium carbonate (CaCO3), in a concentration of 5.1 % wt.. The flow curves
and mechanical spectra for this formulation were performed at 20 ºC. The same method was
repeated for the study of rheological properties of the formulation in brine, where a solution of
NaCl 3 wt. % was used to dissolve the polymer instead of deionized water.
The same method was used to prepare formulations using guar gum instead of FucoPol,
11
Results and Discussion
3.1. FucoPol Production
For the execution of this work firstly it was necessary to produce the biopolymer. FucoPol
was produced by the bacteria Enterobacter A47 in a medium containing glycerol as carbon
source. The cultivation run took 94 h. During the first 10.0 h, the process worked on a batch mode,
thereafter a fed-batch phase started by the addition of a feeding solution, which was fed to the
bioreactor at a constant flow rate of 2.5 mL h−1 L-1. This feeding solution contained a low nitrogen
concentration (0.9 g L-1) and a high glycerol concentration (200 g L-1), which supressed the cell
growth and favoured polymer production.
An EPS concentration of 7.21 g L-1 was achieved at the end of the cultivation run (94 h).
This value is within the range presented in literature (6.00-10.18 g L-1) (Torres et. al., 2014). The
overall volumetric productivity was 1.83 g L-1 d-1, this value is below the ones presented in
litera-ture (Torres et al., 2011, 2012, 2014) 1.89 - 5.66 g L-1 d-1, however this value is in range of values
reported for other microbial EPS, like xanthan (0.96-12.24 g L-1 d-1) (Freitas et al., 2014).
After the end of cultivation run, FucoPol was recovered by diafiltration, because this
method allows obtaining a polymer with a high purification degree, since it removes remnants of
culture broth (e.g. proteins and salts) (Ferreira et al., 2014)
.
12
3.2. FucoPol chemical composition
3.2.1. Sugar composition
The glycosyl composition analysis of the purified polymer revealed that it had the typical
FucoPol composition, namely, it was composed of fucose, glucose, galactose and glucuronic
acid in a content of 37, 34, 23 and 6 % mol, respectively. This sugar composition is similar to
other FucoPol productions reported previously (Freitas et al., 2014; Cruz et al., 2011).
3.2.2. Molecular weight
Molecular weight is an important macromolecular parameter to determine the polymer
suitability and integrity. Itcan affect viscosity, diffusion, and mechanical properties.
The average molecular weight (Mw) of FucoPol was determined by size exclusion
chro-matography (SEC). FucoPol molecular weight was 2.14x10⁶, which is in accordance within the
values (1.7-5.7 x 10⁶) reported in literature (Freitas et al., 2013). The Mw obtained for this
pro-duction of FucoPol is in range with Mw of xanthan (2.0-15 x 106) and is superior to Mw of guar
gum (4.7 – 34.6 x 10⁵) (Funami et al.,2005; Holzwarth, 1978).
3.3. Rheological studies
3.3.1. Steady-shear behavior of EPS solution at different temperatures and
concen-trations
Purified FucoPol aqueous solutions in deionized water and in NaCl 3 wt.% were studied at
concentrations of 0.5; 1.0 and 1.5 wt.% at different temperatures (20, 40, 60 and 80 ºC). These
solutions were submitted to shear rates in a range of 0.1 to 500 s-1 (Figure 3.1). Xanthan and guar
gum solutions were tested in the same conditions and compared with FucoPol.
2.3.1.1. In deionized water
FucoPol has high molecular weight structures that form intramolecular and intermolecular
interactions in solution, like entanglements and hydrogen bonds. The energy transferred to the
molecules at high shear rates is responsible for deformation and disruption of the interactions. At
low shear rates, the disruption occurs in a rate that is balanced with the natural formation of new
interactions, maintaining the apparent viscosity higher (Alves et al., 2010; Cruz et al., 2011). At
higher shear rates, this balance is lost, and the rate of disruption become much higher than the
rate of formation of new interactions decreasing the apparent viscosity, this behaviour is typical
13
Figure 3.1 a, b and c shows that, as expected, with the increase in FucoPol concentrationthe apparent viscosity increases. Regarding the effect of temperature, the transition of the
New-tonian plateau to the shear thinning regime is observed at higher shear rates with the increase of
temperature and this can be explained by the fact that higher temperatures promote a faster
formation of new interactions. (Alves et al., 2010; Cruz et al., 2011). This behaviour was also
observed in the two other polymers studied (Figure 3.1 d, e, f, g, h and i). This behaviour is more
pronounced in the assay performed with a FucoPol concentration of 1.5 wt.%.
For higher shear rates, the apparent viscosity decreased with the increase of temperature,
the same behavior was reported by Cruz et al., 2011. This effect is enhanced at lower FucoPol
concentrations (Figure 3.1 a, b and c). Therefore, results seem to indicate that the increase of
FucoPol concentration in solution reduces the effect of temperature, i.e. with the increase of
con-centration more polymer molecules exist in solution, so the effect of temperature is dispersed for
a higher number of molecules what can result in a decreasing of the effect of temperature.
After subjecting the samples to shear rate values up to 500 s-1, the apparent viscosity is
not recovered (Figure 3.1 a) At higher shear rates, the flow curves obtained increasing and
de-creasing the shear rate were coincident, but this not occur at lower shear rates. However, this
effect is decreased with the increasing of polysaccharide concentration in solution and increased
with the increasing of temperature. This suggests that the polymer in solution may not be totally
hydrated, therefore at lower polymer concentrations, the number of molecules of EPS is lower
and more water are available to hydrate the polymer when subjected to shear, making the
15
The same studies were performed for xanthan and guar gum. Comparing the polymersstudied (Figure 3.1), FucoPol presented much lower apparent viscosity than xanthan for all the
concentrations studied (0.5, 1.0 and 1.5 wt.%). The effect of temperature in xanthan samples was
slightly different of FucoPol samples at higher shear rates. Increasing the concentration of
xan-than in the sample minimizes the effect of temperature. At xanxan-than concentrations of 0.5 and 1.0
wt.% the apparent viscosity remained the same with the increase in temperature, while at 1.5
wt.% the increasing of temperature from 20 to 60 ºC have no effect on apparent viscosity but at
80 ºC the apparent viscosity decreased. This phenomenon can occur because for xanthan the
solution’s viscosity is dependent of polymer dissolution temperature (García-Ochoa et. al., 2000). A frequency/temperature superposition reported by Rochefort and Middleman (1987) has showed
that a conformational change occurs at temperatures superior than 50-60 ºC at low
concentra-tions of salt, what suggests that this behaviour can be correlated with conformational changes in
xanthan molecules. In this study, polymer dissolution were performed at 20ºC and all the polymer
may have not been properly dissolved, so when the samples were submitted to shear and
tem-perature (rheological assays), a conformational changes of xanthan molecules can occur.
(Gar-cía-Ochoa et. al., 2000). This type of effect of temperature in xanthan samples is also reported
by Marcotte et al. (2001) On the other hand, Xu et al. (2013) reported that the xanthan apparent
viscosity decrease with the increasing of temperature.
In guar gum, as in the other polymers, the viscosity increased with concentration (Figure
3.1 h, I, j). Guar gum apparent viscosity was similar to FucoPol for most of the solutions studied.
Further, the effect of temperature is similar to FucoPol, at higher shear rates with the increasing
of temperature the apparent viscosity decreased and with the increase in polymer concentration
the effect of temperature diminishes. In literature, the same effect of the temperature in guar gum
solutions was also reported by Silva et al. (2017). After subjecting the samples to shear rate
values up to 500 s-1 and decreasing it again to 0.01 s-1 it is observed the same behaviour of
FucoPol, i.e. the apparent viscosity was not recovered at lower shear rates. This behaviour is
contrary to described by Cruz et al. (2011), this difference can be caused by differences in the
composition of the FucoPol studied.
The Power law model was used to fit the relationship between the apparent viscosity (η, Pa s) and shear rate (ẏ, s-1)
𝜂 = 𝐾ẏ𝑛−1 Equation 3.1
where K is the consistency index (Pa sn) and n is the power law index. The power law index
indicates the degree of non-Newtonian behavior. For n=1, the fluid is Newtonian, while for n<1 it
16
For all the assays performed, with the different polymers, in deionized water, it isob-served that with the increasing of temperature, the power law index (n) has increased, but always
remaining inferior to one (Table 3.1), which means that all the solutions kept the shear thinning
behavior whatever the conditions evaluated.
Table 3.2– Power law model parameters for FucoPol, xanthan and guar gum aqueous solutions in deionized water.
Polymer FucoPol Xanthan Guar gum
(% wt.) 0.5 1.0 1.5 0.5 1.0 1.5 0.5 1.0 1.5
T (ºC) K n K n K n K n K n K n K n K n K n
20 0.686 0.492 2.744 0.408 9.500 0.292 4.956 0.376 10.234 0,109 17.327 0.123 1.342 0.487 18.673 0.248 24.401 0.292
40 0.250 0.598 1.411 0.492 5.256 0.365 2.276 0.291 13.402 0,061 20.567 0.141 0.900 0.492 14.524 0.268 45.981 0.181
60 0.180 0.627 0.754 0.581 2.685 0.452 1.106 0.387 7.148 0,224 25.574 0.235 0.569 0.537 11.651 0.299 38.406 0.217
80 0.077 0.718 0.549 0.611 1.464 0.546 0.575 0.475 3.723 0,341 10.313 0.313 0.381 0.575 7.655 0.342 35.787 0.228 The consistency index (K) has decreased with the increase of the temperature, which is
related to the lower viscosity at higher temperatures. However, for xanthan and guar gum at 1.5
wt.%, the consistency index has not this linear decrease,
These results indicate, the temperatures studied did not alter the fluids behavior what is
good for the application proposed, because much of the drilling processes were carried out in
elevated temperatures and these polymers can maintain a behavior propitious for a good drilling.
Further, when the concentration of the polymers studied increased, the power law index
decreased which results in an increased of shear-thinning behavior, this can be due to the higher
number of molecules in solution. The results of consistency index and power law index of flow
curves obtained for shear rates range of 500 to 0.01 s-1 are present in Table A.1 in appendix.
2.3.1.2. In salt (NaCl 3 wt.%)
The effect of temperature and concentration were also studied in FucoPol, xanthan and
guar gum aqueous solutions in NaCl 3 wt.%, in form to imitate the salinity present in sea water,
because of the oil reservoirs presents in the oceans. These tests were performed to understand
the effect of this condition on the apparent viscosity of the polymeric solutions.
All the solutions tested presented a shear thinning behaviour. Regarding Fucopol aqueous
17
(Figure 3.1 a, b and c). The apparent viscosity of samples in NaCl, when submitted to highertemperatures, was slightly higher than in deionized water. Further, for FucoPol 1.0 and 1.5 wt.%,
it can be seen that the presence of NaCl enhanced the resistance to temperature by the polymer
(Figure 3.2 a, b, c). These results demonstrate that the polymer is resistant to higher
concentra-tions of NaCl 3 wt.%, which is in accordance with the work, reported by Torres et al. (2015),
Further, in the presence of NaCl the recovery of the apparent viscosity is better than in deionized
water. This suggests, the presence of the salt in solution helps to stabilize the polymeric
mole-cules through interactions between the ions in solution and FucoPol molemole-cules (Torres et al.,
2015).
The effect of temperature in xanthan samples in NaCl 3 wt.% were minimized. At xanthan
0.5 wt.% (Figure 3.2 d), with the increase of temperature, the apparent viscosity has a lower
decrease than in water. For higher concentration (1.0 and 1.5 wt.%) the salt effect was more
pronounced, since at lower shear rates the apparent viscosity was between 80 and 300 (1.0 wt.%)
and 200-800 Pa.s (1.5 wt. %), instead of 8-200 and 400-1000 Pa.s (1.0 and 1.5%, respectively).
A slight decrease for apparent viscosity at 40 and 60ºC was only observed at lower shear rates,
which may be related with a conformational transition that may occur around those temperatures,
as reported by Rochefort and Middleman (1987). Milas et al. (1979) reported that with the addition
of salt to xanthan samples, the molecules didn’t lose his ordered structure but change it for a secondary ordered structure. In the presence of salt xanthan solutions continue presenting a
su-perior apparent viscosity than Fucopolsolutions.
In case of guar gum samples, the presence of NaCl in a concentration of 3 wt.% diminished
the apparent viscosity of the solutions at 0.5 wt.% (Figure 3.2 g) in comparison with solutions of
guar gum in dionized water. For higher concentrations, the apparent viscosity at lower shear rates
was slightly higher for solutions performed at 20 and 40 ºC, while at higher shear rates the
be-haviour was similar for all the temperatures tested. Therefore, for higher concentrations guar gum
19
Flow curves in NaCl 3 wt.% were also fitted by the Power law, consistency index (K) andpower law index (n) are presented in Table 3.2.
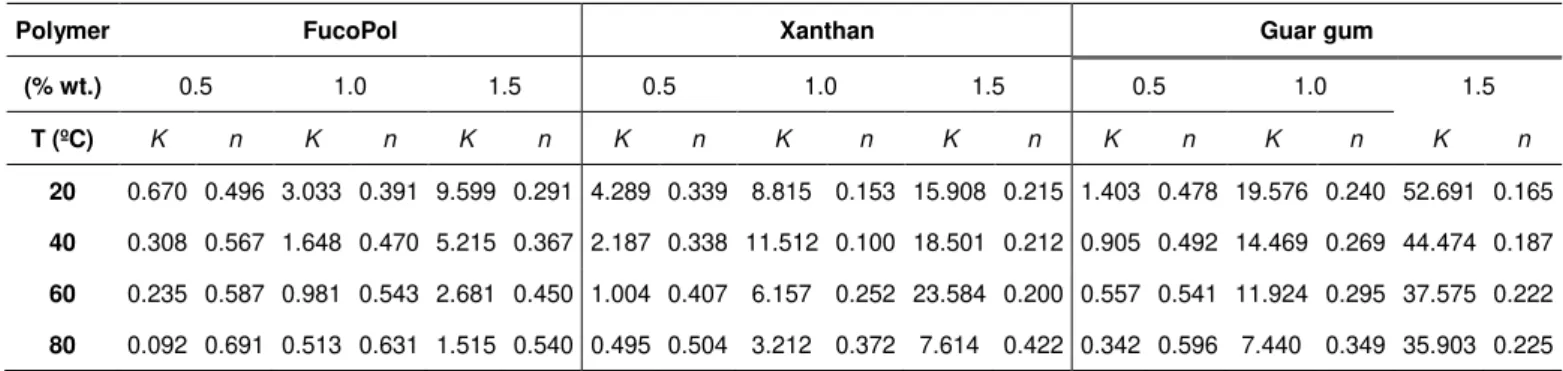
Table 3.2– Power law model parameters for FucoPol, xanthan and guar gum aqueous solutions in NaCl 3 wt.%.
Polymer FucoPol Xanthan Guar gum
(% wt.) 0.5 1.0 1.5 0.5 1.0 1.5 0.5 1.0 1.5
T (ºC) K n K n K n K n K n K n K n K n K n
20 0.670 0.496 3.033 0.391 9.599 0.291 4.289 0.339 8.815 0.153 15.908 0.215 1.403 0.478 19.576 0.240 52.691 0.165
40 0.308 0.567 1.648 0.470 5.215 0.367 2.187 0.338 11.512 0.100 18.501 0.212 0.905 0.492 14.469 0.269 44.474 0.187
60 0.235 0.587 0.981 0.543 2.681 0.450 1.004 0.407 6.157 0.252 23.584 0.200 0.557 0.541 11.924 0.295 37.575 0.222
80 0.092 0.691 0.513 0.631 1.515 0.540 0.495 0.504 3.212 0.372 7.614 0.422 0.342 0.596 7.440 0.349 35.903 0.225 For the samples in brine solution (NaCl, 3 wt.%), the behavior is practically the same of
those obtained in deionized water, because the values for consistency index (K) and for power
law index (n) are very identical. The consistency index (K) has decreased with the increase of the
temperature, which is related to the minor viscosity at higher temperatures. However, for xanthan
at 1.0 and 1.5 wt.%, the consistency index has not this linear decrease. These results
demon-strate the presence of NaCl do not have any significant effect in the power law index and in the
consistency index, because the interactions created between the polymer and the ions are not
sufficient to change the shear thinning behavior of the three polymers. The results of consistency
index and power law index of flow curves obtained for shear rates range of 500 to 0.01 s-1 are
present in Table A.2 in appendix.
3.3.2. Steady-shear behavior of EPS solution at different temperatures in presence
of KCl and CaCl2
The rheological properties of FucoPol aqueous solutions (1.0 wt.%) in KCl and in CaCl2 3
wt.% were studied at different temperatures (20, 60 and 80ºC). These solutions were submitted
21
Xanthan and guar gum solutions were tested in the same conditions. The respective steadyshear flow curves are presented in Figure 3.3.
All the polymers presented flow curves with a strong shear-thinning behaviour, for all the
salts tested (Figure 3.2 c, d, e and f). However, for FucoPol it was observed that the effect of
temperature was more pronounced than in water and in NaCl (Figure 3.1b and 3.2b), respectively.
In KCl, the apparent viscosity decreased from 8 to 0.5 Pa.s with the increase in temperature from
20 to 80 ºC, respectively.
As in NaCl the recovery of the apparent viscosity in both salts is better than in deionized
water. As in the tests performed in NaCl, xanthan in the presence of KCl or CaCl2 (Figure 3.2 c
and e), offer to the solution more resistance to temperature than in deionized water (Figure 3.1
e). The increase of the temperature in these solutions still making the apparent viscosity decrease
but this decreasing is lower than the occurred in in deionized water, since the apparent viscosity
in water varied between 8 and 200 Pa.s, while in salt are within 20- 300 Pa.s. Regarding guar
gum, the solutions in salt (NaCl, KCl and CaCl2) presented higher apparent viscosities (2-20 Pas)
than in water (1-2 Pa.s) (Figure 3.1h, 3.2h, 3.3e and f).
3.3.3. FucoPol hydration tests
As described in section 3.3.1, after subjecting FucoPol samples to shear rate values up to
500 s-1, the apparent viscosity, at lower shear rates was not recovered (Figure 3.1a). This
behav-iour may be due to the polymer in solution not be totally hydrated, probably exists some
mi-croaggregates that are only dissolved when subjected to the first shear. Therefore, to increase
the solution hydration, FucoPol solutions were stirred all night and then submitted to a thermic
treatment, where they were kept at 80ºC, for 1 hour and with stirring.
Figure 3.4 present FucoPol flow curves performed after thermic treatment. It is possible to
observe that apparent viscosity still not being totally recovered, but it was minimized. To the
as-says performed at 60 and 80 ºC it is observed that the flow curves with shear rates from 500 to
0.01 s-1 and from 0.01 s-1 to 500 s-1are almost coincident.
Therefore, temperature had a positive effect on polymer dissolution but 1 hour at 80ºC was
22
Figure 3.4 - Flow curves (steady state) profile of Fucopol aqueous solutions in dionized water with thermic treatment (a - 0.5 wt.%; b – 1 wt.%; c – 1,5 wt.%) at different temperatures (-20 ºC; -40 ºC; ♦-60 ºC; ▲ -80ºC); shear rate 0.01-500 s-1 (full symbols); shear rate 500-0.01 s-1 (open symbols).3.3.4. Oscillatory measurements
Figure 3.5 shows the angular frequency dependencies of storage (G´´) and loss (G´) moduli
of FucoPol, xanthan and guar gum samples at different temperatures Results of mechanical
spec-tra demonsspec-trated that FucoPol solutions in deionized water were viscous samples of entangled
polymer chains, since at low frequencies, the loss modulus (G’’) was higher than the storage
modulus (G’), indicating that polymer solution have a fluid behavior. For higher frequencies, a cross-over (G’’=G’) was observed and the storage modulus (G’) become higher than loss
modu-lus (G’’). These results occur for all the temperatures tested (20, 60 and 80ºC).(Figure 3.5 a, b and c)). However, for higher temperatures the cross-over moved to lower frequencies. (Figure
3.5 b and c). This suggests that the increase of temperature disrupts some of the inter-chains
interactions between polymer molecules, what turn the frequency needed lower, to the samples
24
Comparing these results, with the obtained for xanthan samples (Figure 3.5 d. e and f), iFucoPol samples stored and dissipated less energy than Xanthan samples for lower frequencies,
because the storage modulus (G’) and loss modulus (G’’), for these frequencies, were lower than the obtained for Xanthan. Also, for Xanthan samples at 20ºC, the storage modulus (G’) was su-perior to the loss modulus at lower frequencies, which indicates a weak-gel behavior (Figure 3.5
d). At higher temperatures (40 and 60ºC), this behavior was inverted due to the fact that G’’ be-came higher than G’ and the sample adopted a fluid behavior (Figure 3.5 e and f). This can be explained by the fact that when the temperature increased the viscosity of the solution decrease
and therefore the solution adopts a more viscoelastic behavior instead of an elastic behavior (Xu
et al., 2013).
The behavior obtained for guar gum in deionized water was similar to the obtained for
FucoPol samples, with results showing a G’’ superior to a G’ on linear viscoelastic region (Figure 3.5 g, h and i). However, the cross-over obtained for higher temperatures occur at higher
frequen-cies, indicating that more energy is needed in order to samples store more energy than that is
dissipated
Mechanical spectra of the three polymers were also performed in brine solution (NaCl 3
wt.%) at 20ºC, in order to understand the salt effect on polymer properties (Figure 3.6).
For the case of FucoPol (Figure 3.6 a), the G’’ continues superior to the G’ at lower fre-quencies, like in the mechanical spectra obtained for FucoPol in deionized water at 20ºC.
How-ever, the values of G’ and G’’ increased in presence of NaCl 3% wt., indicating the anionic char-acter of FucoPol, because this increasing in G’ and G’’ at lower frequencies represents a structure increasing that can be caused by the interactions between NaCl ions and anionic groups presents
in FucoPol polymer chain (Rochefort et al., 1987). The cross-over also occurred at a lower
fre-quency than in deionized water. This suggests that the increase in ionic strength and the fact that
FucoPol is an anionic polymer, make that less energy was necessary to the sample store more
energy, possibly because the cross-over occur at lower frequencies in comparison with deionized
water samples and at this time the elastic contribution is predominant (Maalej et al., 2016; Cruz
25
Figure 3.6 –Mechanical spectra of Fucopol (a), Xanthan (b) and Guar gum (c) 1% wt. aqueous solutions in brine (NaCl 3 wt.%) at 20ºC, G’ –open symbols; G’’ – full symbols.Mechanical spectra of Xanthan solution in NaCl 3 wt.% (Figure 3.6 b) presented
practi-cally the same behavior that was already presented in mechanical spectra of xanthan in deionized
water, with G’ superior to G’’ for lower frequencies. However, the values of G’ and G’’ also had increased slightly in the presence of NaCl in the medium. The result expected was a decrease of
this values, because the expected is the ions interact with polymer molecules decreasing the
intra-chain interactions in the polymer molecule causing a loss of the structure, like in the data
reported by L. Xu et al. (2013) and by Rochefort et al. (1987).
Regarding guar gum in NaCl 3 wt.% (Figure 3.6 c), the significant difference comparing
to results in deionized water, was the cross-over that occurred at a lower frequency. Further,
values for G’and G’’ have decreased significantly. These results indicates that presence of NaCl in the medium provoked significant changes to the guar gum mechanical properties.
All this data shows that FucoPol solution has mechanical properties more similar to the
guar gum than to the xanthan, suggesting that may be tested to be used in applications where
26
3.3.5. Rheological studies of synergetic effect between Fucopol and Xanthan and
FucoPol and Guar gum: Steady-shear and mechanical behavior
The objective of this study was to evaluate if FucoPol had some synergetic phenomenon
with xanthan or guar gum, in order to improve FucoPol rheological properties. Therefore, were
performed studies in steady and dynamic shear (flow curves and mechanical spectra,
respec-tively). Mixtures of FucoPol solution 1% wt. with xanthan and guar gum solutions 1% wt., in
dif-ferent proportions (20:80; 50:50; 80:20), were prepared.
Steady Shear
In the mixture between xanthan and FucoPol, we can observe that the increase of the
xanthan proportion increased the apparent viscosity due to the higher xanthan viscosity (Figure
3.7), like showed previously (section 3.3.1). Further, in the mixture with 80:20 (Xanthan:FucoPol)
the apparent viscosity increased comparing to the apparent viscosity obtained for xanthan
solu-tion in deionized water, which indicates that FucoPol may have an enhancer role in increasing
xanthan viscosity. The same as occurred for the mixture 20:80 (Xanthan:FucoPol) in comparison
with FucoPol in deionized water.
Figure 3.7 - Flow curves (steady state) profile of mixture of FucoPol and xanthan aqueous solution (Xan-than:FucoPol) 1 wt.% thermic treated in deionized water at 20ºC in different proportions (-20:80; - 50:50;
▲- 80:20); shear rate 0.1-500 s-1 (full symbols); shear rate 500-0.01 s-1 (open symbols).
Concerning the mixture of guar gum and FucoPol, it is visible that the apparent viscosity
has increased with the increase of proportion of guar gum. However, this increase was more
accentuated between the 20:80 and 50:50 (Guar gum:FucoPol) mixtures. For proportions 50:50
and 80:20 (Guar gum:FucoPol) the increase was much lower (Figure 3.8). Comparing the mixture
20:80 (Guar gum:FucoPol) with the flow curve obtained for FucoPol in deionized water (Figure
27
enhanced the apparent viscosity of FucoPol. The same has not occurred for the proportion 80:20(Guar gum:FucoPol) (Figure 3.8), when compared with guar gum in deionized water (Figure 3.1
h), the apparent viscosity were practically in the same values.
Figure 3.8 - Flow curves (steady state) profile of mixture of FucoPol and guar gum aqueous solution (Guar gum:FucoPol) 1 wt.% thermic treated in deionized water at 20ºC in different proportions (-20:80; - 50:50;
▲- 80:20); shear rate 0.1-500 s-1 (full symbols); shear rate 500-0.01 s-1 (open symbols).
Dynamic measurements
The mechanical spectra obtained for the mixture of xanthan and FucoPol showed that the
increase of xanthan´s proportion caused an alteration of the mechanical spectra (Figure 3.9 a, b
and c). For the mixture with lower proportion of xanthan it presents a fluid behavior, with G’’ su-perior to G, when the proportion of xanthan gum in the mixture is increased the cross-over
oc-curred at lower frequencies. The mixtures 80:20 (Xanthan:FucoPol) presented a weak gel
behav-ior with G’ superbehav-ior to G’’.
For mixtures of guar gum and FucoPol mechanical spectra presented practically the same
results with G’’ superior to G’ in all proportions. This may occur because Guar gum and FucoPol have similar mechanical.
This can indicate that the mixture adopted the mechanical behavior of the polymer that is
28
Figure 3.9–Mechanical spectra of mixture of Xanthan:FucoPol (a – 20:80; b – 50:50; c – 80:20) and guar gum:FucoPol (d – 20:80; e – 50:50; f – 80:20) aqueous solution (1 wt.%) thermic treated in deionized at20ºC in different proportions; G’ –open symbols; G’’ – full symbols
The same tests were performed in brine medium, 3% wt. NaCl, in order to observe if the
presence of NaCl create changes.
The results demonstrate that the presence of NaCl practically cause no changes in
appar-ent viscosity of the mixtures, like it can be seen comparing the flow curves of the mixtures (Figure
29
Figure 3.10 Flow curves (steady state) profile of mixture of FucoPol and xanthan aqueous solution (c - Xanthan:Fucopol) and mixture of Fucopol and guar gum aqueous solution (d – Guar gum:FucoPol) 1 wt.% thermic treated in 3 wt.% NaCl at 20ºC in different proportions (-20:80; - 50:50; ▲- 80:20); shear rate 0,1-500 s-1 (full symbols); shear rate 500-0,01 s-1 (open symbols).Dynamic measurements in NaCl 3 wt.%
The mechanical spectra obtained for the mixtures in 3wt.% NaCl (Figure 3.11) are similar
to the data obtained for deionized water (Figure 3.9). These results showed that the phenomenon
which occurred for mechanical behaviour of the mixtures in deionized water are the same that
30
Figure 3.11–Mechanical spectra of mixture of Xanthan:FucoPol (a – 20:80; b – 50:50; c – 80:20) and guar gum:FucoPol (d – 20:80; e – 50:50; f – 80:20) aqueous solution (1 wt.%) thermic treated in NaCl 3 wt.% at20ºC in different proportions (); G’ –open symbols; G’’ – full symbols
3.3.6. Formulation for drilling mud using FucoPol
Xanthan and guar gum are currently used in oil industry to develop water base mud
formu-lations, due to the fact that they create less pollution, being more environmental friendly (Hamed
et al., 2009). Taking this into consideration, FucoPol was studied about its potential for this
appli-cation.
To develop the FucoPol formulation, the clay (Bentonite) that has the role of varying the
load factor, and a weight material (calcium carbonate, CaCO3), responsible to control fluid loss
were added to the polymer aqueous solution (1 wt.%) (Hamed et al., 2009).
The formulations were made in deionized water and in brine solution (3 wt.% NaCl).
In order to compare a formulation with guar gum were produced, in the same conditions.
Formulations were evaluated about their rheological properties, steady-shear measurements and
31
Figure 3.12-Flow curves (steady state) profile of formulation of FucoPol () and guar gum () in deionized water (a) and in NaCl 3 wt.% at 20ºC; shear rate 0.1-500 s-1 (full symbols); shear rate 500-0.01 s-1 (open symbols).Flow curves (Figure 3.12) obtained for the formulations presents a shear thinning
behav-ior, which is necessary for a drilling fluid,to facilitate the injection and for suspension and carrying
of the cuttings. (Hamed et al., 2009; Caenn and Chillingar, 1995). Guar gum formula is 10 times
more viscous than FucoPol formula.
For FucoPol formulations the apparent viscosity suffered no changes when submitted to
a brine medium of high salinity, while the apparent viscosity of guar gum formulation decreased
slightly, despite still being much more viscous. FucoPol can have advantage in relation with Guar
gum for this application, because it’s necessary a good stability of the viscosity of the polymer in high salinity medium for a good drilling in these conditions, however the apparent viscosity of guar
gum formula continues to be higher than the apparent viscosity of FucoPol formula.
FucoPol formulation mechanical spectra showed no change between water and NaCl 3
32
Figure 3.13–Mechanical spectra of formulation of FucoPol in deionized water (a) and in NaCl 3 wt.% (b) and Guar gum in deionized water (c) and in NaCl 3 wt.% (d) at 20ºC; G’ –open symbols; G’’ – full symbolsIn case of guar gum the mechanical spectra changes when the formulation was submitted
to high salinity medium. For deionized water, the formulation presented a weak-gel behavior that
is not recommended for a drilling fluid. The same has not occurred in brine (NaCl 3 wt. %), where
a fluid like behavior was presented, with G’’ superior to G’ at lower frequencies. These results seems to indicate that guar gum may not be a good polymer to create a formulation destined to
some reservoirs that don’t have high salinity conditions.
Taking into consideration the results obtained, FucoPol formulation presented some
ad-vantages in relation to guar gum formulation, since its mechanical behavior keeps the same in
33
Conclusions and future work
In this work, the potential application of FucoPol for the design of water based drilling fluid
was studied. Before the design of the formulation, rheological measurements were performed, to
evaluate the behaviour of FucoPol aqueous solutions in different conditions. In steady-shear
rhe-ological measurements, different polymer concentrations (0.5, 1.0 and 1.5 wt.%), different
tem-peratures (20, 40, 60 and 80 ºC) and different salinity conditions (NaCl, KCl, CaCl2 3 wt.%) were
tested and the rheological behaviour of FucoPol was evaluated. The flow curves resultant of these
tests revealed that FucoPol presented a shear thinning behaviour for higher shear rates under all
conditions teste
The dynamic measurements were performed with a polymer concentration of 1 wt.% in
three different temperatures (20, 60 and 80 ºC) in deionized water and at 20 ºC in brine conditions
(NaCl 3 wt.%), where FucoPol presented a fluid like behaviour.
These tests were also done for xanthan and guar gum in a form of comparison with
Fu-coPol. Xanthan presented the highest apparent viscosity of the three polymers studied, followed
by guar gum. FucoPol presented the lowest apparent viscosity of the three polymers.
The study of the effect of the temperature in the rheological measurements revealed that
FucoPol apparent viscosity has decreased with by increasing the temperature and increased with
the increasing of polymer concentration. The same has occurred for guar gum but the effect of
temperature for xanthan has presented slight differences.
The tests in brine conditions (NaCl 3 wt.%) revealed that the presence of NaCl enhanced
the temperature resistance of FucoPol. The same has occurred for xanthan samples but not for