Softening Mechanisms of the AISI 410 Martensitic Stainless Steel Under Hot Torsion
Simulation
Thiago Santana de Oliveiraa, Eden Santos Silvaa,b, Samuel Filgueiras Rodriguesa*, Carmem Célia
Francisco Nascimentoa, Valdemar Silva Leala, Gedeon Silva Reisa
Received: October 24, 2016; Accepted: December 27, 2016
This study investigated the softening mechanisms of the AISI 410 martensitic stainless steel during torsion simulation under isothermal continuous in the temperature range of 900 to 1150 °C and strain rates of 0.1 to 5.0s-1. In the irst part of the curves, before the peak, the results show that the critical (ε
c)
and peak (εp) strains are elevated for higher strain rate and lower temperatures contributing for higher
strain hardening rate (h). Moreover, this indicated that dynamic recrystallization (DRX) and dynamic
recovery (DRV) are not efective in this region. After the peak, the reductions in stresses are associated to the diferent DRX/DRV competitions. For lower temperatures and higher strain rates there is a delay in the DRX while the DRV is acting predominantly (with low Avrami exponent (n) and high t0.5). The
steady state was reached after large strains showing DRX grains, formation of retained austenite and the presence of chromium carbide (Cr23C6) and ferrite δ at the martensitic grain boundaries. These
contribute for impairing the toughness and ductility on the material. The constitutive equations at the
peak strain indicated changes in the deformation mechanism, with variable strain rate sensitivity (m), which afected the inal microstructure.
Keywords: Martensitic steel AISI 420, dynamic recrystallization, dynamic recovery, stacking-fault energy.
* e-mail: [email protected]
1. Introduction
During hot forming processes, stainless steels are subjected to variations in temperature and strain rate, generating changes in the mechanical and microstructural behavior of the alloy1-3. The main hot working processes are
forging and rolling, followed by heat treatment, in which
the material is subjected to thermal cycles under variable strains in order to improve their mechanical properties3. In
this thermomechanical cycle, materials initially undergo
a hardening process, followed by slow dynamic recovery and predominantly dynamic recrystallization, which are dictated by the stacking-fault energy (SFE) and the applied
stain conditions4.
Stainless steels tend to soften by dynamic recrystallization
(DRX), after a certain amount of deformation1,5-6. This
threshold deformation, which is known as the critical strain (εc), corresponds to the minimum deformation necessary for
the onset of DRX, and the stress corresponding to this strain is called critical stress (σc)
7-10. This value corresponds to the
upper limit of the amount of energy that can be stored locally
in this type of hot deformed material. However, the critical
amount of stored energy alone is not enough to trigger the
onset of DRX, which also requires the energy dissipation rate to reach a critical value. Poliak and Jonas, who applied
the principle of thermodynamic irreversibility, determined
that the critical state for the onset of DRX occurs when11,12: a PPGEM, Instituto Federal do Maranhão, Av. Getúlio Vargas, 04, Monte Castelo, 65030-005, São Luís,
MA, Brazil
b Universidade Ceuma, Rua Josué Montello, Renascença, 1, 65075-120, São Luís, MA, Brazil
( )
0
1
2
2
2
2
v
v
i
-
=
S
X
where θ is the work hardening rate. The values of θ can be obtained by calculating the derivative of the σ vs. ε curve measured experimentally, Eq. 212:
( )
2
2
2
i
f
v
=
The θ vs. ε curves are then plotted to evaluate the width (w) and depth (d) of the dip generated in the dynamic recovery of
the material, using the parameters of t0.5 and Avrami exponent
(n), considering the conditions of temperature and strain rate. In the downward slope of the curve after the peak deformation, the fraction of dynamic recovery (Xs) is determined
as a function of applied strain (ε), and the parameter t0.5 (time to reach 50% of softening) is estimated from this curve:
.
( )
exp
X
1
0 693
t
t
3
.
S
P SS
P i n
0 5
v
v
v
v
=
!
-
-
$
= -
#
-
T
Y
&
where σp is the peak stress and σss is the steady-state
Avrami exponent (n) was determined by means of the log [ln(1/(1 – Xs))] vs. log t graph, where n equals the angular
coeicient of a straight line 13.
The AISI 410 martensitic stainless steel with 11.77% chromium and 0.12% carbon content has emerged as a
low-cost alternative for applications that combine good mechanical strength and corrosion resistance 14. This steel can be used
in the oil and natural gas extraction industry, turbine blades,
compressors, rods, valves, shafts and bearings. AISI 410 steel
has a body-centered tetragonal (BCT) crystal structure with low C content and high hardenability, owing mainly to the presence of nickel, cobalt and copper, which stabilize austenite
and enable martensitic transformation. A balanced addition of chromium is essential for the formation of martensite after tempering, since it arises from the transformation of austenite 15. This steel has low SFE due to the presence of
austenite, and DRX is essential to prevent the formation of defects prior to martensitic transformation, whereby the austenite grains are reined through metallurgical processes. However, because this martensitic stainless steel has only
been developed recently, many of its properties are still being
investigated, which justiies its study and characterization
under hot deformation on a laboratory scale. Thus, the aim of this study is to characterize the hot deformation of AISI 410 martensitic stainless steel based on isothermal continuous hot torsion tests, through constitutive analysis and parameterization of the phenomena that occur during dynamic recovery.
2. Materials and methods
The steel was supplied in the form of 6.0 m long by ¾
inch diameter cylindrical bars. The chemical composition of the steel is described in Table 1.
The bars were machined into torsion samples with one end threaded to adjust and ix them onto the torsion machine. The specimens were subjected to the isothermal continuous hot torsion tests. The heating rate applied was of 2.0 ºC/s up to the temperature of 1100ºC, where the samples were
held for 300 s to homogenize the microstructure. After, they
were then cooled at the same rate, to the test temperatures of
950oC, 1000oC, 1050oC and 1100oC, and held there for 30
s to eliminate thermal gradients before being deformed at strain rates of 0.1s-1, 0.5s-1, 1.0s-1 and 5.0s-1, until the strain
reached 3.5 or they ruptured.
The test parameters were programmed and controlled by a microcomputer with an interface program linked to the machine and designed speciically for this type of experiment. The responses were presented in the form of an equivalent stress (σ) vs. strain (ε) graph. The equivalent stress and strain
(σeq; ɛeq) was calculated using the Von Mises relations, based
on the Fields and Backofen method 16, where the curves
are dependent on the torque (M) and the rotation angle (θ), Equations 4 and 5:
Table 1. Chemical composition of AISI 410 martensitic stainless steel (mass%)
Material % C % Si % Mn % P % S % Cr % Ni % Mo % Fe
AISI 410 0.120 0.440 0.250 0.027 0.001 11.770 0.260 0.070 bal
( )
R
M
m
n
2
3
3
4
eq 3v
r
=
Q
+
+
V
( )
L
R
3
5
eq
f
=
#
&
i
where R is the radius and L is the length of the useful
portion of the test specimen. The coeicients n and m
represent the work hardening and strain rates, respectively.
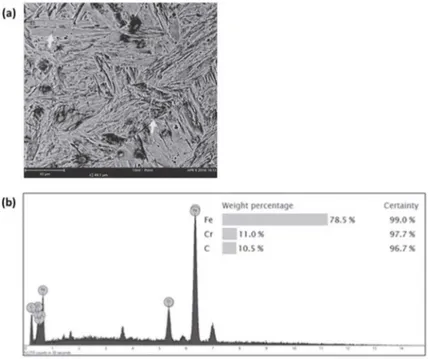
After the usual metallographic procedure, the microstructure
was analyzed under a Nikon Eclipse optical microscope. Before examining the microstructure, the material was chemically etched using Vilella’s reagent. Details of the competing DRV and DRX phenomena were conirmed by scanning electron microscopy (SEM), in which the microanalysis to identify the phases in the material were also made by EDS.
After plotting the curves, the characteristic points were determined using the well-known methodology proposed by Poliak & Jonas17. The values of critical stress and strain (σ
c,
εc) were determined starting from the minimum point of the
(-dθ/dσ vs. σ) curve, where dynamic recrystallization begins at the inlection point of the θ vs. σ curve. The values of peak stress (σp, εp), steady-state stress (σss, εss) and saturation
stress (σsat, εsat) were determined analytically from the θ vs.
σ and θ vs. ε curves, at the points where the work hardening rate (θ = 0) is zero.
3. Results and Discussion
3.1 Flow stress curves
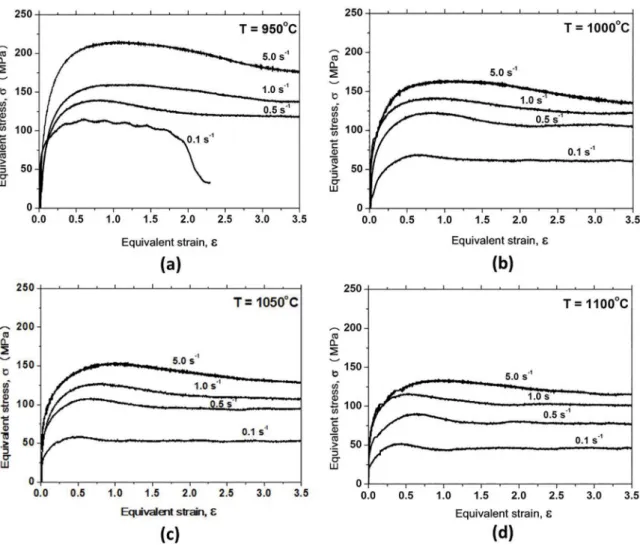
The low stress curves under isothermal continuous hot
torsion testing of the steel at a constant temperature and
variable strain rates are illustrated in Figure 1. The stresses
increase until reach a limit. This region presents a high level of
work hardening, particularly in conditions of low temperature and high strain rate, where the plastic low curves become
steeper. At this stage as the thermal activation mechanisms
and dislocation mobility are limited, the work hardening is predominant which prevents the action of dynamic recovery. This shifted the critical strain (εc) to higher values and
consequently the onset of dynamic recrystallization occurs
from this point where the curve neatly changes its slope.
Figure 1. Stress-strain diagram of AISI 410 martensitic stainless steel at constant temperature and variable strain rates: (a) 950ºC, (b)
1000ºC, (c) 1050ºC, (d) 1100ºC.
indicating the dynamic recovery (DRV) of the material until it reaches its peak stress, at which point the mechanisms of work hardening and dynamic softening is balanced locally.
After the peak strain, the stresses drop to an intermediate value (σss) which is governed by the temperature and strain
rate. These accelerate the kinetics of dynamic softening leading to a steady state stress, where the hardening and softening
mechanisms establish a dynamic balance at further strains.
However, in the condition at low temperatures and higher
strain rates, i.e. 5.0s-1, it seems that the curves show a sluggish
decrease in the stress level resulting from the dominant role of dynamic recovery mechanism. This contributed to generating a delay in the action of the thermally activated mechanisms and consequently the dynamic recrystallization.
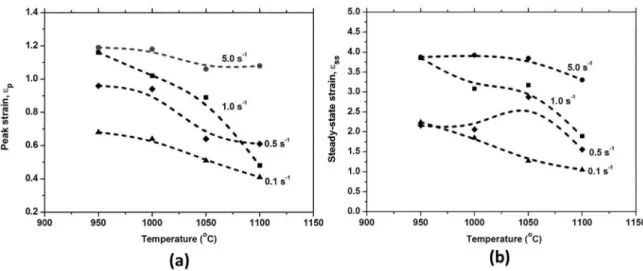
3.2 Characteristic points of the curves
The characteristic points on the curves were determined
using the methodology already described in section 2. The
dependence of peak strain and steady strain on temperature
and strain rate is shown in Figure 2(a) and (b) respectively.
Note the tendency of the strain to decline in response to increasing temperature and decreasing strain rate favoring
the dynamic recrystallization. However, there are some
variations in behavior. There is a visible increase in the
steady-state strain (εss) in the condition of intermediate temperature
(1050ºC/0.5s-1), indicating that greater deformation is required
to complete the process of dynamic recrystallization, which the dynamic recovery is more efectiveness. Note that the diference between the peak and steady-state strains (∆ε = εss – εp) decreases with increasing temperature and decreasing
strain rate because dynamic recrystallization in these conditions
is more intense. However, because the phenomenon of
dynamic recovery occurs during the hot deformation of
AISI 410 steel, there is a delay in the kinetics of dynamic recovery, which is expressed by the relation εp/εss ~ 0.32.
The behavior of stress (σ) as a function of the strain rate applied in two diferent regions of the low stress curves: at close to the peak strain (εp ~ 0.5) and at the steady-state
Figure 2. Dependence of (a) peak (εp) and (b) steady-state strains (εss) on temperature and strain rate.
Figure 3. Determination of strain rate sensitivity (m) in the conditions of hot deformation. (a) 0.5 and (b) 3.5 strains.
are two diferent behaviors with diferent slopes, indicating
a possible change in deformation mechanism.
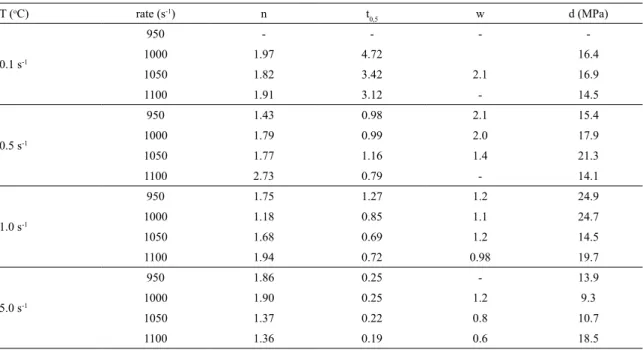
3.3 Evaluation of dynamic recovery
The work hardening rate (θ) behavior as a function of applied strain (ε), where the negative θ points correspond to the region of dynamic softening after the peak strain, is depicted in Figure 4. The proile of the curve enables one to evaluate the efect of the strain rate and temperature on the softening kinetics, where the lowest point in the dip represents the strain (ε) at the highest rate of dynamic softening, which is higher the lower the strain rate. At a given strain rate, the width (w) of the curve decreases as the temperature increases (see Table 2). On the other hand, the width (w) of the curve increases at a constant
temperature and varying strain rate, indicating a delay
the kinetics of dynamic recrystallization and evidence of
dynamic recovery with more intense softening. However, in some conditions of low temperature and high strain rate,
the point of steady-state strain is not reached.
3.4 Constitutive equations
The relationship between the low curves, temperature
and strain rate in the process of plastic deformation of the
alloy can be expressed according to the relation18:
( )
exp
sinh
Z
RT
Q
A
6
def
p n
f
av
=
o
T
Y
=
"
Q
V
%
where ε is the strain rate, Qdef is the deformation activation
energy (kJ/mol), R is the universal gas constant (8.31 J/mol.K), T is the absolute temperature (K), Z is the Zener-Hollomon
parameter, and σp is the peak stress (MPa). The variables A,
Figure 4. Behavior of the θ x ε curve at temperatures of (a) T = 950oC, (b) T = 1000ºC, (c) T = 1050ºC and (d) T = 1100ºC, determination
of the parameters w and p.
Table 2. Values of the Avrami exponent (n), 50% of softening time (t0.5), width (w) and depth (d) of the dip in dynamic recovery
T (oC) rate (s-1) n t
0,5 w d (MPa)
0.1 s-1
950 - - -
-1000 1.97 4.72 16.4
1050 1.82 3.42 2.1 16.9
1100 1.91 3.12 - 14.5
0.5 s-1
950 1.43 0.98 2.1 15.4
1000 1.79 0.99 2.0 17.9
1050 1.77 1.16 1.4 21.3
1100 2.73 0.79 - 14.1
1.0 s-1
950 1.75 1.27 1.2 24.9
1000 1.18 0.85 1.1 24.7
1050 1.68 0.69 1.2 14.5
1100 1.94 0.72 0.98 19.7
5.0 s-1
950 1.86 0.25 - 13.9
1000 1.90 0.25 1.2 9.3
1050 1.37 0.22 0.8 10.7
some manipulations, one arrives at two relations that enable one to determine the stress exponent (n) and the activation energy (Qdef):
( )
ln sin
ln
n
7
p T2
2
av
f
=
"
Q V
o
%
/
( )
ln sinh
Q
T
nR
1
8
def p2
2
av
=
foQ
V
Q
V
"
%
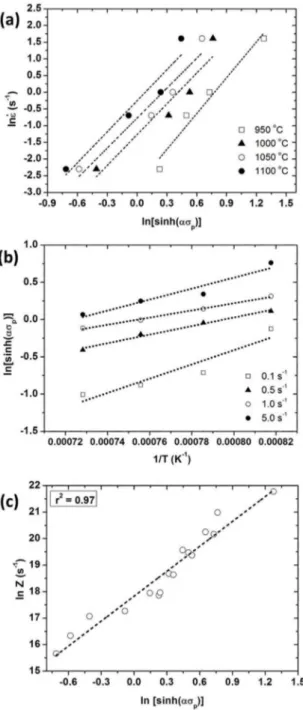
The least squares method was used to determine the
value of α = 0.00924 MPa-1, which presented the lowest
standard deviation. Then, the lnε vs. ln[sinh(ασp)] curves
were plotted to estimate the average value of the exponent n = 3.18, from the slopes of the straight lines (Figure 5(a)). After obtaining the values of α and n, the ln[sinh(ασp)] vs.
1/T curves were plotted (Figure 5(b)), where the slopes enabled the calculation of the activation energy, Qdef = 205
kJ/mol, which is necessary to overcome the barriers in the hot forming process. The value of the constant A = 5.54 x
107 s-1 was determined by linear regression of ln [sinh(ασ p]
vs. ln Z, with a correlation coeicient of 0.97 (Figure 5(c)). After determining the values of Q, α, n and A, a constitutive
equation is proposed for the peak stress (σp) as a function of Z:
.
sinh
.
z
( )
108 22
1 8
10
.9
p
1 8 0 31
#
v
=
"
-Q
-V
%
This constitutive equation for σp as a function of the
deformation conditions and the intrinsic characteristics of the material can be used to predict the levels of strength of
AISI 410 martensitic stainless steel over a wide range of workability in hot rolling processing, forging, etc.
3.5 Analysis of the σ vs. ε curve, before the peak
The irst part of the low stress curves, shown in Figure 1, indicted high levels of strain hardening coeicient (h) at low temperatures and high strain rates, determined according to
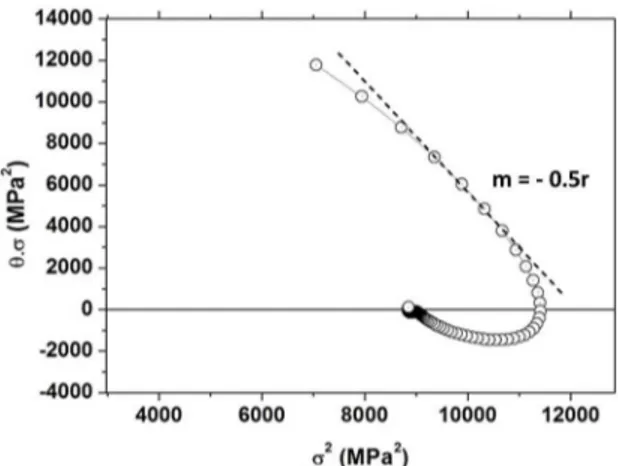
methodology shown in Reference 19, expressed in Figure 6. After a slight strain, one can see that the coeicient of DRV (r), which speciies the inlection of the plastic low curve, which is
determined from the slope of the θ.σ vs. σ2 curve, is higher as the
temperature increases and the strain rate decreases (Figure 6). The strain hardening coeicient (h) as a function of peak
stress (σp) and parameter Z of power law tends to increase
with increasing strain rate and decreasing temperature, resulting in more efective hardening in the irst part of the stress-strain curves. This high value of h is due to the low value of SFE ~ mJ/m2 with delay of the action of thermally
afected mechanisms, resulting in an increase in the work
hardening rate. Using the method proposed by Dai et. al.
4, not shown here, the calculated value of the SFE for this
steel was approximately 21 mJ/m2.
Figure 5. Plots for determination of the constants (a) n, (b) the
activation energy for hot deformation (Qdef) and (c) A.
The coeicient h contributes to increase the level of stress during deformation on the upward slope of the curve, modifying its proile, particularly at low temperature and high strain rates (High Z). The literature reports that in this stage, there is formation and increased density of dislocations, which
accumulate and interact, entrapping and forming sub-grains
with reduced mobility, requiring a higher stress level to trigger
greater plastic deformation 20-22. However, the operations of
thermally activated mechanisms, such as scaling and cross-slip, favor the rearrangement and elimination of these defects,
Figure 6. Determination of the coeicient of DRV (r) in hot
deformation conditions, m = -0.5r, condition of 1050 ºC/5.0 s-1.
hardening rate parabolically and increasing the coeicient of dynamic recovery (r), as indicated in Figure 7.
In Figure 7, note that the behavior of the coeicient of DRV (r) decreases until it becomes constant in response to the peak stress (σp) and parameter Z of power law. In other
words, the r value decreases in response to the increase in stress achieved at low temperature and high strain rate (higher Z). DRV is efective at higher temperatures, even with low SFE, and reaches the saturation point faster. On the other hand, the h and r coeicients present the opposite behavior
in the test conditions because of the competing mechanisms
of DRV and DRX, which occur concomitantly, with the low values of Z and SFE providing a favorable condition for the occurrence of DRX, which reduced the levels of strain, particularly of εc and εp, which characterize the onset of
DRX. The constitutive equations found for the low curve region before the peaks are shown as follow.
.
( )
r
57 98
p .10
0 47
#
v
=
-.
( )
h
7 87
10
.11
p 11 1 49
#
v
=
.
( )
r
=
66 01
#
z
-0 13.12
.
( )
h
=
6 8
#
10
11z
0 27.13
3.6 Analysis of the σ vs. ε curve, after the peak
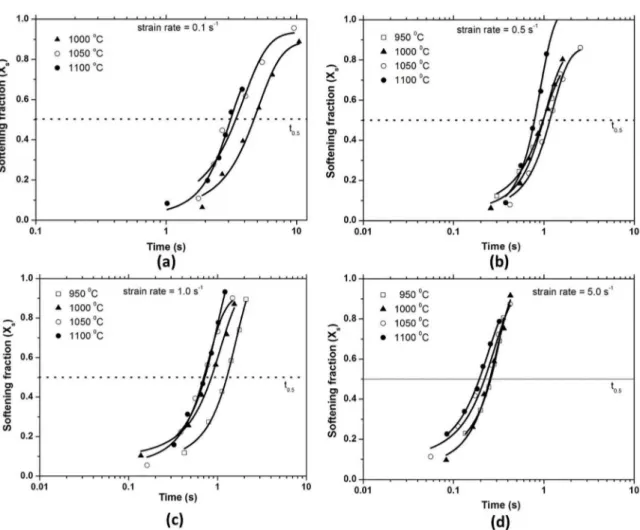
Figure 8 illustrates the behavior of the fraction of dynamic recovery (XS) as a function of deformation time,
showing a sigmoidal proile that indicates the time spent
to reach 50% of dynamic recovery, t0.5. As can be seen, the
recovery rate increases with temperature and strain rate.
At the same temperature, t0.5 decreases with increasing strain rate, since the process of deformation occurs more rapidly. At the same strain rate, t0.5 decreases with increasing temperature, because of the more favorable condition for dynamic recrystallization resulting from the greater mobility of dynamically recrystallized grain boundaries.
Figure 9 depicts the behavior of log [ln (1/1 – Xs))] vs. log t for determination of the Avrami exponent (n). Note that the values of n range from 1.2 to 2.7, and that these
values fall within the range reported in the literature (Table
2). The highest n values occur more frequently at higher
temperatures and low strain rates, a condition in which the kinetics of dynamic recrystallization is accelerated. Note that some points do not show this tendency, probably because of a decline in grain nucleation and growth rates. Low n values indicate retardation of the process of dynamic recovery.
3.7 Inluence of microstructure on the
thermomechanical behavior
The X-ray difraction analysis in Figure 10 reveals the presence of martensitic phase (BCT structure) in samples solubilized at 1100 ºC for 300s. This resulted from the difusionless transformation of austenite during heat treatment, with C retained in the octahedral sites of martensite. This generates the BCT microstructure, which prevents movement at the grain boundaries, making the material harder. The fraction of martensite is dependent on cooling below the
transition temperature.
The calculations of the phase diagram using FactSage 7.0 software indicated the formation of ferrite δ and austenite γ phases and M23C6 carbides (see Figure 11). Studies in the
literature 1,5,14,23-26 report the formation of delta ferrite phase (δ)
and chromium carbides at the martensitic grain boundaries in
hot forming processes, possibly associated with sensitization
or intergranular corrosion, even though martensite is not an equilibrium phase formed at high cooling rates, particularly due to the chemical composition of thermally activated C
and Cr (Figure 11). These results are in agreement with the EDS microanalysis, which indicated the homogeneity of the
chemical composition of the as received material. This phase
strongly inluences the microstructural transformations that occur in hot rolling processes, and can induce cracking and
reduced toughness and ductility at high temperatures and
low strain rates, which favors breakdown of the material, as can be seen in the curve at 950ºC at 0.1 s-1.
Figures 12 show the microstructural transformations
that occurred during the thermomechanical process. Coarse
martensitic transformations are visible before the peak strain, Figure 12(a), with deformation twins resulting from
the applied stresses in the shape of uniformly distributed
needles (laths) possibly having the same crystallographic
orientation. The microstructures also suggest the possibility of decarburization in the austenitic Widmanstätten structure in the form of laminae to better accommodate the
stress-induced strain associated with the formation of martensite. Note the presence of δ ferrite grains (white regions) among
the martensite grains, resulting from the instability of the
Figure 7. Dependence of coeicients (a) r and (b) h on peak stress (σp).
Figure 8. Diagram of the evolution of Xs as a function of deformation time (t) at diferent strain rates: (a) 0.1 s-1, (b) 0.5 s-1, (c) 1.0 s-1
and (d) 5.0 s-1.
After the peak strain, Figure 12 (c), the microstructure shows a martensitic matrix with the presence of retained austenite between the needles resulting from incomplete
martensitic transformation. Also, there are a considerable
amount of δ ferrite at the grains, which are iner due to the
higher levels of strain and the onset of thermally activated
mechanisms. As can be seen, the presence of δ ferrite at the grains in a martensitic matrix could inluence the material
toughness because this phase dissolves almost no C in its
Figure 9. log [ln (1/1 – Xs))] vs. log t curves used to calculate the values of the Avrami exponent at diferent strain rates: (a) 0.1 s -1, (b)
0.5 s-1, (c) 1.0 s-1 and (d) 5.0 s-1.
Figure 10. X-ray difraction analysis of the as received samples of
AISI 410 martensitic stainless steel (BCT structure). Figure 11. analysis of the AISI 410 martensitic stainless steel.Phase diagram calculated by FactSage software 7.0
Figure 13 shows the presence of Cr23C6 precipitates
in the grain boundaries. These should reduce the steel
toughness associated with the formation of δ ferrite which
is more susceptible to phase transformations than austenite.
Also the instability of δ ferrite may lead to the formation of
secondary phases during heat treatments.
4. Conclusions
The focus of this study was the thermomechanical
behavior of AISI 410 martensitic stainless steel in isothermal continuous hot torsion tests. The main results of these tests
Figure 12. Optical microscopy of the steel along the plastic low curves at 1050 ºC: a) region before the peak, ε = 0.36, 0.1 s-1; b)
intermediate region, ε = 2.42, 5.0 s-1; c) ε = 2.03 to 1.0 s-1 and d) Region before the peak, ε = 0.72 to 5.0 s-1.
(i) On the irst part of the curve, before the peak, the results indicated that the critical (εc) and peak (εp) strains
are higher the higher the strain rate and the lower the temperature, showing high level of work hardening as well as the DRV mechanism acting. This contributed to retard the DRX associated to the moderate SFE (γefe ~ 21 mJ/m
2). This
SFE applicable for the material studied here was calculated
by using the empirical procedure described in reference 4.
(ii) The constitutive equation that best represented the
thermomechanical behavior of the deformation mechanisms
of AISI 410 steel, with respect to critical, peak and
steady-state strains and stresses, according to the Zener-Hollomon
parameter, was:
. . .
exp sinh
Z 204 954RT 5 54 10 0 00952 . p
7 3 18
#
f v
= o
S
X
= "Q
V
%(iii) After the reaching the peak strain, the material’s softening mechanism was found to be governed predominantly by the
parameters t0.5 and n, which represent the form and kinetics of
DRX in the steady state. This was obtained after large strains with low Avrami exponent (n) and high t0.5, with dynamically recrystallized grains and the presence of precipitates of chromium
carbide (Cr23C6) and δ ferrite at the boundaries of martensitic grains.
5. Acknowledgements
The authors thank the Brazilian research funding agencies FAPEMA (Maranhão Foundation for Scientiic Research and Development), the Federal Institute of Maranhão (IFMA) and CNPq (National Council for Scientiic and Technological Development). They would also like to acknowledge Prof. In-Ho Jung from McGill University for providing access to FactSage thermodynamic software.
6. References
1. Ebrahimi GR, Keshmiri H, Maldar AR, Momeni A. Dynamic Recrystallization Behavior of 13%Cr Martensitic Stainless Steel under Hot Working Condition. Journal of Materials Science & Technology. 2012;28(5):467-473.
2. Montheillet F, Jonas JJ. Dynamic recrystallization. In: Trigg GL,
ed. Encyclopedia of Applied Physics, volume 16. Hoboken:
Wiley-VHC; 1996. p. 205-225.
3. Baczynski J, Jonas JJ. Torsion textures produced by dynamic recrystallization in α-iron and two interstitial-free steels.
Metallurgical and Materials Transactions A. 1998;29(2):447-462.
4. Dai QX, Wang AD, Cheng XN, Luo XM. Stacking fault energy
of cryogenic austenitic steels. Chinese Physics. 2002;11(6):596.
5. Ebrahimi GR, Keshmiri H, Mazinani M, Maldar A, Haghshenas M.
Multi-stage thermomechanical behavior of AISI 410 martensitic steel. Materials Science and Engineering: A. 2013;559:520-527.
6. Nkhoma RKC, Siyasiya CW, Stumpf WE. Hot workability of
AISI 321 and AISI 304 austenitic stainless steels. Journal of Alloys and Compounds. 2014;595:103-112.
7. Najaizadeh A, Jonas JJ. Predicting the Critical Stress for
Initiation of Dynamic Recrystallization. ISIJ International.
2006;46(11):1679-1684.
8. Momeni A, Dehghani K, Ebrahimi GR. Modeling the initiation
of dynamic recrystallization using a dynamic recovery model. Journal of Alloys and Compounds. 2011;509(39):9387-9393.
9. Mirzadeh H, Najaizadeh A. Flow stress prediction at hot working conditions. Materials Science and Engineering: A.
2010;527(4-5):1160-1164.
10. Jafari M, Najaizadeh A. Comparison between the Methods
of Determining the Critical Stress for Initiation of Dynamic Recrystallization in 316 Stainless Steel. Journal of Materials Science & Technology. 2008;24(6):840-844.
11. Poliak EI, Jonas JJ. A one-parameter approach to determining the
critical conditions for the initiation of dymanic recrystallization. Acta Materialia. 1996;44(1):127-136.
12. Poliak EI, Jonas JJ. Initiation of Dynamic Recrystallization
in Constant Strain Rate Hot Deformation. ISIJ International.
2003;43(5):684-691.
13. Jonas JJ, Quelennec X, Jiang L, Martin E. The Avrami kinetics of dynamic recrystallization. Acta Materialia.
2009;57(9):2748-2756.
14. Isfahany AN, Saghaian H, Borhani G. The efect of heat treatment
on mechanical properties and corrosion behavior of AISI420 martensitic stainless steel. Journal of Alloys and Compounds.
2011;509(9):3931-3936.
15. Bissey-Breton S, Vignal V, Herbst F, Coudert JB. Inluence of
Machining on the Microstructure, Mechanical Properties and
Corrosion Behaviour of a Low Carbon Martensitic Stainless
Steel. Procedia CIRP. 2016;46:331-335.
16. Fields DS, Backofen WA. Determination of Strain-Hardening Characteristics By Torsion Testing. ASTM Proceeding. 1957;57:1259-1272.
17. Jonas JJ, Poliak EI. The Critical Strain for Dynamic
Recrystallization in Rolling Mills. Materials Science Forum. 2003;426-432:57-66.
18. Sellars CM, Tegart WJM. La relation entre la résistance et la
structure dans la deformation à chaud. Memoires Scientiiques de la Revue de Metallurgie. 1966;63:731-746.
19. Uvira JL, Jonas JJ. Hot compression of Armco iron and silicon
steel. Transactions of the Metallurgical Society of AIME. 1968;242:1619-1626.
20. Rodrigues SF, Silva ES, Reis GS, Sousa RC, Balancin O. Prediction of hot low plastic curves of ISO 5832-9
steel used as orthopedic implants. Materials Research.
2014;17(2):436-444.
21. Sousa RC, Silva ES, Jorge AM Jr., Cabrera JM, Balancin O.
Dynamic recovery and dynamic recrystallization competition on a Nb- and N- bearing austenitic stainless steel biomaterial:
Inluence of strain rate and temperature. Materials Science and Engineering: A. 2013;582:96-107.
22. Silva ES, Sousa RC, Jorge AM Jr., Balancin O. Hot deformation
23. Cardoso PHS, Kwietniewski C, Porto JP, Reguly A, Strohaecker TR. The inluence of delta ferrite in the AISI 416 stainless steel hot workability. Materials Science and Engineering: A.
2003;351(1-2):1-8.
24. Chakraborty G, Das CR, Albert SK, Bhaduri AK, Paul VT, Panneerselvam G, et al. Study on tempering behaviour of AISI
410 stainless steel. Materials Characterization. 2015;100:81-87.
25. Kenvalo E, Ebrahimi GR, Sani SAA, Momeni A. Dynamic recrystallization kinetics of AISI 403 stainless steel using
hot compression test. Iranian Journal of Materials Forming.
2014;1(2):32-43.
26. Lei X, Feng Y, Zhang J, Fu A, Yin C, Macdonald DD. Impact of Reversed Austenite on the Pitting Corrosion Behavior of Super 13Cr
![Figure 9. log [ln (1/1 – X s ))] vs. log t curves used to calculate the values of the Avrami exponent at diferent strain rates: (a) 0.1 s -1 , (b) 0.5 s -1 , (c) 1.0 s -1 and (d) 5.0 s -1 .](https://thumb-eu.123doks.com/thumbv2/123dok_br/18883884.423349/9.765.70.713.94.611/figure-curves-calculate-values-avrami-exponent-diferent-strain.webp)