Vanadium
|Very Important Paper|
Interaction of [V
IV
O(acac)
2
] with Human Serum Transferrin and
Albumin
Isabel Correia,
[a]Ielyzaveta Chorna,
[a]Isabel Cavaco,
[a, b]Somnath Roy,
[a, c]Maxim L. Kuznetsov,
[a]N#dia Ribeiro,
[a]GonÅalo Justino,
[a]Fernanda Marques,
[a, d]Teresa Santos-Silva,
[e]Marino F.A. Santos,
[e]Hugo M. Santos,
[e, f]Jos8 L. Capelo,
[e, f]James Doutch,
[g]and Jo¼o Costa Pessoa*
[a]Abstract: [VO(acac)2] is a remarkable vanadium compound
and has potential as a therapeutic drug. It is important to clarify how it is transported in blood, but the reports ad-dressing its binding to serum proteins have been contradic-tory. We use several spectroscopic and mass spectrometric techniques (ESI and MALDI-TOF), small-angle X-ray scattering and size exclusion chromatography (SEC) to characterize
sol-utions containing [VO(acac)2] and either human serum
apo-transferrin (apoHTF) or albumin (HSA). DFT and modeling protein calculations are carried out to disclose the type of
binding to apoHTF. The measured circular dichroism spectra, SEC and MALDI-TOF data clearly prove that at least two VO– acac moieties may bind to apoHTF, most probably forming
[VIVO(acac)(apoHTF)] complexes with residues of the HTF
binding sites. No indication of binding of [VO(acac)2] to HSA
is obtained. We conclude that VIVO–acac species may be
transported in blood by transferrin. At very low complex concentrations speciation calculations suggest that [(VO)(a-poHTF)] species form.
1. Introduction
Bis(acetylacetonato)oxidovanadium(IV), or [VIVO(acac)
2 (1), is
one of the most remarkable vanadium compounds. In the
solid state it consists of discrete molecules of [VIVO(acac)
2 in
which vanadium(IV) presents an almost square pyramidal
ge-ometry (Figure 1).[1] It forms quite stable VIVO-complexes,[2,3]
the reported stability constants in aqueous solution being log b1=8.73 and log b2=16.27, respectively.[4]
[VIVO(acac)
2] has found uses in multiple areas. Namely, it has
been used as the vanadium precursor for the preparation of
many vanadium complexes where one[5–7] or both[8,9]acac@
li-gands are replaced.[10]It has also been used directly as catalyst
precursor in organic chemistry, for example, in aerobic oxida-tions,[10, 11]epoxidations (e.g. of allylic alcohols, geraniol),
sulfox-idations[12] in combination with tert-butylhydroperoxide or
H2O2,[13,14]or immobilized in solid supports.[15]
[VIVO(acac)
2] exerts interesting biological effects; namely it
exhibits insulin-enhancing properties, in that in can stimulate the phosphorylation of protein kinase B (PKB/Akt) and
glyco-gen synthase kinase-3 (GSK3).[16]It has also been shown to
in-hibit tyrosine phosphatases (PTPases), such as PTP1B.[16]The
ef-fects of [VIVO(acac)
2], [VIVO(Et-acac)2] and of a few other VIV
O-compounds on the glycemia of streptozotocin-induced
diabet-[a] I. Correia, I. Chorna, I. Cavaco, S. Roy, M. L. Kuznetsov, N. Ribeiro, G. Justino, F. Marques, J. C. Pessoa
Centro de Qu&mica Estrutural, Instituto Superior T8cnico Universidade de Lisboa
Av. Rovisco Pais, 1049-001, Lisboa (Portugal) E-mail: [email protected]
[b] I. Cavaco
Departamento de Qu&mica e Farm#cia Universidade do Algarve
Campus de Gambelas, 8005-139 Faro (Portugal) [c] S. Roy
Department of Chemistry Ananda Chandra College Jalpaiguri, West Bengal (India) [d] F. Marques
Centro de CiÞncias e Tecnologias Nucleares Instituto Superior T8cnico
Universidade de Lisboa
Estrada Nacional 10 (km 139.7), 2695-066 Bobadela LRS (Portugal)
[e] T. Santos-Silva, M. F. Santos, H. M. Santos, J. L. Capelo
UCIBIO, REQUIMTE, Departamento de Qu&mica, Faculdade de CiÞncias e Tec-nologia
Universidade Nova de Lisboa 2829-516 Caparica (Portugal) [f] H. M. Santos, J. L. Capelo
PROTEOMASS Scientific Society
Madan Park, Rua dos Inventores, 2825-152 Caparica (Portugal) [g] J. Doutch
ISIS Pulsed Neutron and Muon Source, Science and Technology Facilities Council
Harwell Science and Innovation Campus, Didcot, OX11 0QX (UK) Supporting information and the ORCID identification number(s) for the au-thor(s) of this article can be found under https://doi.org/10.1002/ asia.201700469.
This manuscript is part of a virtual issue on advances in vanadium chemis-try. The complete issue can be found on the journal website www.chema-sianj.org
ic rats (STZ-rats) were examined.[17,18][VIVO(acac)
2] was also
re-ported to have antiproliferative effects[2,19–21] and to have
po-tential as both antidiabetic and antipancreatic cancer agent to
prevent or treat patients suffering from both diseases.[19]
Another property of [VIVO(acac)
2] is its remarkable activity in
degrading plasmid DNA in the absence of any activating
agents, air and photoirradiation.[20,21] The nature of the pH
buffer was found to be determinant in the nuclease activity, and in phosphate-buffered medium single-strand cleavage is clear for concentrations of 1 as low as 1.2 mm (corresponding to a ri=0.08), and in the presence of activators it is much
more extensive.[20,21] The mechanism is oxidative and mainly
associated with the formation of reactive oxygen species
(ROS).[21] Hydrolytic cleavage of the phosphodiester bond is
also promoted by 1, but at much slower rate, not competing
with the oxidative mechanism.[20] These properties may have
important implications in the interpretation of the biological activity of [VIVO(acac)
2].
[VIVO(acac)
2] thus exhibits insulin-enhancing properties and
several other relevant biological effects.[2,16, 22,23,24]Since human
serum albumin (HSA) serves as a drug transport carrier and human serum transferrin (HTF) is an important metal ion blood carrier, the understanding of the interactions that may be
es-tablished between [VIVO(acac)
2] and these plasma proteins is of
major importance to understand its pharmacokinetics and pharmacodynamics. Additionally, most proposals explaining the insulenhancing properties of vanadium compounds in-volve formation of protein-vanadium complexes, namely in
blood,[21] thus, the understanding of the speciation of
[VIVO(acac)
2] in blood and how this might be important in the
uptake of vanadium by cells, are relevant issues.
Regarding the transport of vanadium compounds in blood in vivo, most studies agree that these are predominantly
trans-ported bound to serum proteins, particularly HTF.[24–32]More
re-cently the uptake of V-species by red blood cells (RBCs) and its
possible role was highlighted,[33–35]but at the low total
vanadi-um concentrations expected in vivo in the blood following oral administration of V antidiabetics, most probably signifi-cantly less than ca. 20 mm even upon oral treatment with
a VC,[30,36] HTF appears to be the main vanadium transporter
and RBCs possibly play some role in the pharmacokinetics of these compounds and in providing a reducing effect,
eventual-ly allowing the formation of VIII, which may strongly bind to
HTF.[37]
The binding of [VIVO(acac)
2] to albumin was studied by EPR
and ENDOR spectroscopies,[38] and Mustafi et al.[39] used
iso-thermal titration calorimetry (ITC) and spectrofluorometry to
determine the binding constant of [VIVO(acac)
2] to bovine
serum albumin (BSA). It was reported that glucose uptake by 3T3-L1 adipocytes was significantly higher when using [VIVO(acac)
2] in the presence of HSA (when the albumin:
[VIVO(acac)
2] ratio +1.0).[2,38] These authors also stated that
serum albumin enhanced the insulin-like activity of all studied V-complexes, including 1, more than human serum
transfer-rin,[40]and that the characteristics described are related to the
high stability and capacity of [VIVO(acac)
2] to remain intact
upon binding to HSA. Moreover, the specificity of 1 for highly glycolytic cells, its low toxicity[25]and its anti-tumorigenic
prop-erties[23,24, 41,42] contribute to make 1 a potentially useful
con-trast agent for early tumor detection, and possibly also for
treatment. The advantage of [VIVO(acac)
2] for this purpose
would result from its binding to serum albumin increasing its serum half-life and allowing its transport and delivery to its tar-geted tumor site.[39]
Garribba and co-workers[27,29,43–45] studied extensively the
binding of VIVO-complexes to blood components, mainly by
using EPR spectroscopy. Namely, the anisotropic EPR spectra of solutions containing VIVO2+-HTF, VIVO2+-acac, VIVO2 +
-apoHTF-acac and VIVO2+-holoHTF-acac, in the presence and absence of
other blood serum components, were recorded at pH 7.4. Globally the authors report that two different species could be distinguished, one in higher concentration, identified as (VIVO)
2apoHTF, and the 2ndone as [VIVO(acac)2], and no VIV
O-acac-apoHTF species were identified. These authors further stated that the EPR spectroscopic data suggest that no mixed complexes are formed, this being in agreement with
acetyla-cetonate not acting as a synergistic anion.[29, 45]In similar
stud-ies with HSA, the authors report that only [VIVO(acac)
2] is
de-tected, and that the EPR spectra of solutions containing [VIVO(acac)
2] and 1-methylimidazole are practically
indistin-guishable from those of the binary system VIVO2+-acac,[29] no
VIVO-acac-HSA species being identified.[29,44]Similar conclusions
were made from the measurement of the anisotropic EPR
spectra of solutions containing [VIVO(acac)
2] and holoHTF: no
[VIVO(acac)
2(holoHTF)] species were detected,[45] and again it
was considered that [VIVO(acac)
2] has a square-pyramidal
coor-dination geometry and has no tendency to form complexes of the type cis-[VIVO(carrier)
2(protein)], this being allegedly
corro-Figure 1. Structural formulae of [VIVO(acac)
2] (1) (left). In [VIVO(acac)2(L)] complexes, the donor atom of ligand L may bind trans or cis to the O-oxido. If the
binding is trans, also often called the axial position, no particular rearrangement of the two acac@ligands is required; if the binding is cis, also often called
the equatorial position, one of the acac@ligands will then have one of its O-atoms bound trans to the O-oxido ligand (as in [VIVO(acac)
borated by the conclusion that no ternary species are formed
by VIVO2+, acetylacetonate and 1-methylmidazole. Similar
con-clusions were made by the same group in studies with Immu-noglobulin G.[43]
Notwithstanding, contradicting the initial statements of Selbin,[46] [VIVO(acac)
2] is a weak Lewis acid, and for example,
upon dissolution in organic solvents or in solutions containing potential ligands, the vanadium may coordinate a donor ligand in the vacant site, forming complexes expressed as
[VO(acac)2(L)], sometimes designated as adducts, with for
ex-ample, amide, amine, sulfoxide and pyridine solvents/ligands,[3]
and this process [Eq. (1)] has been studied by several meth-ods.[3,47,48–54]
½VIVOðacacÞ
2A þ L Ð ½VIVOðacacÞ2ðLÞA ð1Þ
In earlier work, solvent effects were explained by coordina-tion to the vacant axial posicoordina-tion, but this was later quescoordina-tioned
in several publications[3] and the available literature is not
always in agreement. In fact, in solution, while some authors state that [VIVO(acac)
2] bind solvents in trans position,[49,50]
sev-eral studies also showed that some solvents bind to the VIV
equatorially, and other publications report either cis- or
trans-binding depending on the ligand added.[51–53]With some
sol-vents, the interaction (e.g. hydrogen bonding) with the
O-oxido ligand has also been proposed.[55–58] For example, IR
studies with pyridine derivatives demonstrated the existence of adducts with the sixth ligand bound cis rather than trans to
the oxido O-atom (Figure 1),[52,54] and ENDOR studies showed
that while for example, methanol binds to the vacant axial
6thposition, it was shown that either cis or trans isomers are
formed with some substituted pyridines.[51] In fact, although
this may result from solid state effects, a single crystal X-ray diffraction (XRD) study of the 4-phenylpyridine (Phpy) adduct 3 confirmed the possibility of cis binding of substituted pyridines
(Figure 2).[59] On the other hand, the structure determined by
single crystal XRD of [VIVO(acac)
2(4-methylpyridine)] consists of
discrete molecules with 4-methylpyridine in the trans position and short V=O (1.557 a) and long V-N (2.447 a) bond
lengths.[60] In the adduct formed with dioxan,
[VIVO(acac)
2(dioxan)],[61] the dioxan bridges two [VIVO(acac)2]
molecules axially (trans) to the V centers; in [VIVO(acac)
2
(2-pyri-done)] the 2-pyridone is bound axially,[62] as pyrazole (Pz) in
[VIVO(acac)
2(Hpz)] (2).[63]
Overall, taking into account the literature data, the interac-tion of ligands (solvent or a dissolved molecule) with [VIVO(acac)
2] may involve:[3] (i) coordination in a sixth position
trans to the oxido O-atom, (ii) coordination in a sixth position cis to the oxido atom, and (iii) hydrogen bonding to the
O-oxido or atoms of the ligand (e.g. with chloroform[51,56]).
HTF has 8 tryptophan residues (3 in the N-lobe, 5 in the
C-lobe) and 25 tyrosines (14 in the N-lobe, 12 in the C-C-lobe).[64]
The two iron binding sites are located near the junction of two domains formed by Cys-117 to Cys-194 bond in the N-termi-nus. Potential amino acid residues that may act as ligands for
VIV in the iron binding sites are Tyr188, Tyr95, His249 and
Asp63 (N-lobe) and Tyr426, Tyr517, His585 and Asp392
(C-lobe). Side groups of other residues of HTF may bind VIV,
namely imidazole donors from histidines, and His-14, His-289, His-349, His-350, His-473, His-606 and His-642 have been
con-sidered as good candidates.[45] The structure of human serum
albumin consists of a single polypeptide chain with 585 amino acid residues, with a 3-dimensional structure normally de-scribed in terms of 3 homologous chains (I, II and III), each of them formed by two subdomains (A and B). HSA has one tryp-tophan residue (Trp214 located in subdomain II-A) and 18 tyro-sine residues.
As described above, there are many reports on in vitro and in vivo experiments proving several relevant biological effects of [VIVO(acac)
2]. It has been repeatedly emphasized[2,4,45,65]that
[VIVO(acac)
2] is a stable entity. However, there are also many
studies confirming the formation of mixed-ligand complexes [VIVO(acac)
2(L)] or [VIVO(acac)(L1)(L2)(L3)]. Therefore, the
forma-tion of such complexes where L1, L2 and L3 could be donor atoms from HTF (or HSA) appears plausible. The binding to HTF could involve some of the donor atoms of the Fe-binding site, or donor atoms of side groups of other amino acid resi-dues. This reasoning and the contradictory reports of the groups of Garribba and Makinen, regarding the binding of [VIVO(acac)
2] to HSA (and apoHTF), and the conclusion of
Gar-ribba and co-workers that cis-[VIVO(acac)
2(protein)] or
[VIVO(acac)(protein)] do not form with serum proteins, mainly
based on EPR spectroscopic measurements, when there are
many other papers confirming the formation of [VIVO(acac)
2(L)]
and [VIVO(acac)(L)] compounds, made us study the systems
VIVO-acac-HTF and VIVO-acac-HSA using several
dis-tinct experimental techniques to clearly prove if VIV
O-acac species can bind these proteins or not.
2. Results and Discussion
2.1. [VIVO(acac)
2] in aqueous solution.
2.1.1. UV/Vis absorption studies.
In aqueous solutions of [VIVO(acac)
2] Crans and
co-workers[17,65] reported the observation of three
spe-cies by EPR spectroscopic measurements at room temperature whose concentrations were time, pH, temperature and salt dependent. The three
com-Figure 2. Structural formulae of two [VIVO(acac)
2] adducts characterized by single crystal
X-ray diffraction: [VIVO(acac)
plexes were assigned as the trans-[VIVO(acac)
2(H2O)],
cis-[VIVO(acac)
2(H2O)] and a VIVO-hydrolysis product containing one
acac@ ligand. No evidence for VVwas found in fresh solutions
of [VIVO(acac)
2], but slow oxidation occurs.[17]The speciation
di-agram depicted in Figure 3 shows that in the system VIVO2++
acac around the physiological pH VIVO is mostly present as the
neutral complex [VIVO(acac)
2], the hydrolysis degree being low.
At pH &3.3 [VIVO(acac)+] species predominate, while for pH<
2.0 [VIVO(H
2O)52+] is the predominant VIVO-complex.
Mustafi et al and Makinen et al.[2,38,58]provided a distinct
spe-ciation diagram where [VIVO(acac)
2] is considered stable in
aqueous solutions of pH 2. However, this contradicts other
ob-servations,[4,17] considered compatible with the formation of
[VIVO(H
2O)52+]![VIVO(acac)+]![VIVO(acac)2] as the pH is
in-creased. In the SI section we discuss why we consider Figure 3 to correspond to the correct speciation, also demonstrating that [VIVO(acac)
2] is not stable in aqueous solutions of pH 2.
As mentioned above, there are several studies in the litera-ture reporting the coordinative binding of amines and of other
monodentate ligands to [VIVO(acac)
2] in solution, namely
in-cluding the determination of binding constants K [Eqs. (1) and (2)].[47, 48]
K ¼½VOðacacÞ2ðLÞA
½VOðacacÞ2A½LA ð2Þ
Most of these studies were done by electronic absorption measurements in organic solvents (e.g. benzene, nitrobenzene, dichloromethane); for example, for pyridine the values
deter-mined in CH2Cl2 and benzene were 867:53[48] and 56 :5,[47]
respectively. The value of K obviously also depends on the amine considered; for example, for piperidine and pyrrolidine, the values determined in benzene were 1400:400 and
2900 :1000,[47]respectively. In aqueous media the K values will
certainly differ from these, and the degree of formation of the adducts [VIVO(acac)
2(L)] will also depend on the pH of the
solu-tion and pKaof the amine.
We measured the spectra of aqueous solutions containing [VIVO(acac)
2] and several potentially monodentate ligands (see
experimental and SI sections for details): imidazole, 2-Me-imi-dazole, benzimi2-Me-imi-dazole, pyrazole, 4-t-buthylphenol at pH 7.0:
0.2. Considering the speciation diagram of the VIVO-acac
system with CVO=2 mm and Cacac= 4 mm (Figure 3), in the pH
range ca. 6.2–7.2 the amount of [VIVO(acac)
2] is maximized,
while maintaining its hydrolysis at a reasonable low level (less than ca. 5% of total vanadium). Figure 4 depicts data for imi-dazole and pyrazole. The absorption spectra of these solutions were measured in the range 380–900 nm, each measurement starting always after the same period of time upon adding the
required amount of the [VIVO(acac)
2] solution (in MeOH) to the
aqueous solution containing the buffered solution of the ligand L. The additions of imidazole, 2-Me-imidazole, or pyra-zole to the [VIVO(acac)
2] solutions all yielded an increase in the
absorbance values in the range 380–900 nm. This effect is
clearly observable at a L:[VIVO(acac)
2] ratio of 1:1, but larger
amounts of ligand present in the final solution almost did not cause further increase; because no significant shift of the ab-sorption maxima is seen in these visible abab-sorption spectra probably the interaction is weak.
Figure 3. Speciation diagram calculated for total VIVO and acetylacetone
concentrations of 2 and 4 mm, respectively, considering the formation con-stants log b1=8.73 and log b2=16.27, reported in [4] and the VIV
O-hydrolyt-ic constants: [VO(OH)+], [(VO)
2(OH)22+], [(VO)2(OH)5-] and [VO(OH)3-] in
refs. [3,25].
Figure 4. Absorption spectra of solutions of [VIVO(acac)
2] added to solutions of (A) imidazole (Im), and (B) pyrazole (Pz) containing a 40 mm carbonate buffer.
The maximum amount of methanol of the samples was ca. 3%. The spectra recorded correspond to independent samples with a concentration of [VIVO(acac)
It is clear that, in the presence of imidazole (or 2-Me-imida-zole or pyra2-Me-imida-zole), a significant global increase in the e values in the 380–900 nm range takes place, which can only be ex-plained by the binding of the N(3) atom of imidazole (or
N-atoms of 2-Me-imidazole or pyrazole) to [VIVO(acac)
2]. It may
be observed that for Im:[VIVO(acac)
2] ratios of 1:2 or 1:4 the
spectra do not differ much from the one recorded at a 1:1 ratio, this meaning that at this ratio most of the imidazole was
already bound to [VIVO(acac)
2]. The possibility of
non-coordi-nating interactions explaining the increase in absorption values cannot be ruled out. However, the change in the spec-tra observed is similar to those observed in the monodentate
binding of O-carboxylate of several hydroxycarboxylic acids[66]
and amino acids,[67–73] where the monodentate coordinative
binding was demonstrated by several spectroscopic methods and pH-potentiometric titrations.
To further prove the possibility of monodentate binding of
these monodentate ligands to [VIVO(acac)
2], rather similar
ex-periments were carried out with l-lactic acid at pH&6.0; these are described in the SI section (SI-8.4). Figure SI-8.4-1 depicts absorption spectra of some of these solutions and Figure SI-8.42 the CD spectra. There are some subtle changes in the
ab-sorption spectra of the solutions at lmax& 560 and 820 nm akin
to those observed in the similar experiments described above (e.g. Figure 4). Importantly, weak but clearly measurable CD spectra were recorded with the same samples which can only be explained by the coordinative
monoden-tate binding of the O-carboxylate to [VIVO(acac)
2]. If this
corresponded to bidentate binding the absorption
spectra would certainly have distinct lmaxfrom those of
[VIVO(acac)
2], and that is not the case. Establishment of
hydrogen bonding of the O-hydroxyl of lactate to the O-oxido or to O-acac atoms cannot be ruled out.
The additions of benzimidazole and of 4-tert-butyl-phenol were examples where this effect of absorption increase did not depict a clear trend (see SI section). In the case of benzimidazole possibly because of steric hindrance; in the case of 4-tert-butylphenol probably
also because of its relatively high pKavalue (10.2), thus
at pH 7.0 the phenolic OH remains protonated and its
propensity to bind [VIVO(acac)
2] is low.
2.1.2. Mass spectrometric studies.
To further confirm the formation of [VIVO(acac)
2(L)]
spe-cies in aqueous media, solutions of the same potentially monodentate ligands: imidazole, methylimidazole, ben-zimidazole, pyrazole and phenol (this instead of
4-tert-butylphenol) were prepared in 10 mm NH4CH3COO
aqueous solution (previously set to pH 6.5). Accurately measured volumes of each of these solutions and of
the NH4CH3COO aqueous solution were added to six
distinct vials, and accurately measured volumes of [VIVO(acac)
2] in methanol (80 mm) was added to each of
the six vials. Final solutions were 1.1 mm in [VIVO(acac)
2]
and 2% v/v MeOH, and the molar ratios ligand:VIVO
was 7:1 in all samples; pH values ranged from 6.58 to 7.15. For each of the six solutions, ESI-MS (+/-) was carried out
ca. 5–10 minutes after the addition of [VIVO(acac)
2]; samples of
these solutions were also taken for EPR spectroscopic
measure-ments and immediately frozen in liquid N2 (see below). The
ESI-MS of the solution containing only [VIVO(acac)
2] differed
sig-nificantly from those of [VIVO(acac)
2] and monodentate ligands.
The results of these experiments are described in the SI section and the data is summarized in Table 1. Globally the mass
spec-trometric data confirm the formation of [VIVO(acac)
2(L)] species
in aqueous media for L=imidazole, methylimidazole, benzimi-dazole and pyrazole. Only in the case of L=phenol no assign-ments could be made confirming the formation of [VIVO(acac)
2(phenolato)] in the conditions used.
2.1.3. EPR spectroscopy studies.
With the solutions prepared for the MS experiments men-tioned in the previous section, samples were collected for EPR spectroscopic measurements. The results are described in the SI-section. All measured EPR spectra for aqueous solutions at
pH ca. 6.6–7.1 of [VIVO(acac)
2] and of [VIVO(acac)2]+ L (L=
imi-dazole, methylimiimi-dazole, benzimiimi-dazole, pyrazole and phenol) and almost superimposable, thus it is plausible that the
inter-action of these ligands with [VIVO(acac)
2] is axial. Figure
SI-8.3-Table 1. Summary of assignments in ESI-MS experiments with solutions of [VIVO(acac)
2] upon addition to solutions of several potential monodentate ligands.a
System and tentative assignment Mass
ob-served System and tentative as-signment Mass ob-served [VIVO(acac) 2] [VIVO(acac)2]+Imidazole [VIVO(acac) 2-H]@ (@) 264.04 [V IVO(acac) 2(Im)-H]@(?) (@) 331.58 [VIVO(acac) 2+H]+ (++) 266.08 [V IVO(acac) 2(Im) +H]+ (++) 333.65 [VIVO(acac) 2+MeOH+ H]+ (++) 297.9 [VIVO(acac)(Im)2]+ (++) 301.9 [VIVO(acac) 2+H2O+H]+ (++) 283.9 VIVO(acac) 2·+VIVO(acac)+(?) (++) 430.96 [VIVO(acac)
2]+Me-Imidazole [VIVO(acac)2]+pyrazole
[VIVO(acac) 2(MeIm)-H]@ (@) 381.49 – – [VIVO(acac) 2(MeIm)+H2O+H]+ (@) 317.91 [V IVO(acac) 2(Pz)+H2O+H]+ (++) 351.91 [VIVO(acac)(MeIm) 2+H]+ (++) 384.3 [VIVO(acac)(Pz)]+ (++) 231.14 [VIVO(acac) 2(MeIm)+H2O+Na+]+ (++) 401.91 [V IVO(acac)+2(Pz)]+ (++)302.00 [VIVO(acac)
2]+Benzimidazole [VIVO(acac)2]+phenol
[VIVO(acac) 2(Bz)]@ (@) 381.49 No assignment [VIVO(acac)(Bz)+(OH@) 2]@ (@) 317.91 [VIVO(acac) 2(Bz) +H]+ (++) 384.3 [VIVO(acac) 2(Bz) +H2O+H]+ (++) 401.91
[a] Although during the ESI process free ligands may bind non-specifically to [VIVO(acac)
2], resulting in false positives,[74, 75]we explain our our data considering
coordinative binding. Non-coordinative binding is much more probable with sol-vent or buffer molecules, present in much higher amounts.
25 depicts the low field range of these spectra. Thus, although the visible absorption and mass spectrometric measurements
indicate the formation of [VIVO(acac)
2(L)] complexes in aqueous
solution, the EPR spectra of all systems measured are almost equal and superimposable with the EPR spectrum of [VIVO(acac)
2].
2.2. Interaction of [VIVO(acac)
2] with human serum
transfer-rin
2.2.1. Circular dichroism
In the visible range, because the protein does not absorb, only
charge transfer or VIVO-d-d electronic transitions are observed.
Thus, clearly measurable De values can only be recorded in the visible range of the circular dichroism (CD) spectra when there is coordination of donor atoms of the protein to vanadium(IV); otherwise no induced CD-bands due to charge transfer or d-d transitions can be measured.[31,67,76,77]
The type of spectrum obtained for VIVO-compounds in the
visible range depends on the particular binding and
environ-ment of the chiral donors around the VIVO center. If more than
one chiral VIVO-complex forms in solution, the measured CD
spectrum is the weighted sum of the CD spectra of all VIV
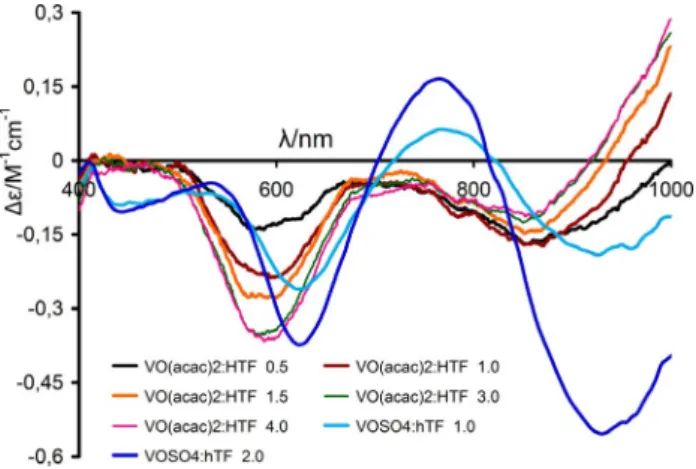
O-complexes formed in the system being studied, each corre-sponding to a set of distinct De(l) values (see SI-section). Figure 5 includes CD spectra in the 400–1000 nm range of
sol-utions containing apoHTF and VIVOSO
4(blue lines). It is known
and accepted[26,27, 29,31,34,64,68, 78]that in such solutions the VIVO2+
is bound by donor atoms of residues of the iron binding site
of HTF, forming either 1:1 or 2:1 (VIVO:apoHTF ratio)
com-plexes.
The fact that non-zero De values are measured in the visible
range for solutions containing [VIVO(acac)
2] and apoHTF
(Figure 5) and that the pattern of CD spectra obtained differs
from those of solutions containing VIVOSO
4 and apoHTF
(con-taining (VIVO)
nHTF complexes), means that:
(i) significant amounts of VIVO-acac species bind to HTF and
(ii) there is no extensive hydrolysis of the VIVO-acac species
leading to the formation of (VIVO)
nHTF complexes.
It is also noteworthy that the order of magnitude of the
measured De values for the system [VIVO(acac)
2] and apoHTF is
the same as those measured for solutions containing (VIVO)
nHTF complexes. From the CD spectra shown in Figure 5
it cannot be concluded with certainty what type of VIV
O-acac-HTF complexes are formed, but the relatively high De values measured suggests that a significant fraction of these
com-plexes correspond to [VIVO(acac)(HTF)] species, where the
VIVO:acac molar ratio is 1:1, and the VIVis bound to more than
one chiral residue of apoHTF,[26] as otherwise the De values
would be significantly lower, as was the case of those
mea-sured in solutions containing [VIVO(picolinato)
2] and
lyso-zyme,[79] or in solutions containing VIVO2+ and amino acids
with monodentate coordination of the a-COO@ moiety to
VIV.[67–72]
At least two distinct types of CD spectra may be distinguish-ed in Figure 5, this also corresponding to at least two distinct
VIVO-acac complexes. In fact, in the spectrum of the solution
with the [VIVO(acac)
2]:apoHTF molar ratio of 1:0.5 (black line)
the De values are <0 in the range 700–1000 nm (band I),
cor-responding to transitions dxy!dxz,dyz (both dxz and dyz have
similar energy)[3] while for higher molar ratios two distinct
bands (corresponding to dxy!dxzand dxy!dyz, often
designat-ed by bands IA and IB) are clearly observdesignat-ed, the De values pro-gressively increasing and becoming > 0 for l>& 930 nm as the [VIVO(acac)
2]:apoHTF molar ratio increases. The two distinct
patterns of the CD spectra measured imply that two different
types of chiral VIVO-acac-apoHTF species form as [VIVO(acac)
2] is
added. It is also noteworthy that the addition of one more
mole equivalent of [VIVO(acac)
2] to the solution with
[VIVO(acac)
2]:apoHTF molar ratio of 3 does not produce
signifi-cant changes in the CD spectra measured. Thus, if more than
two VIVO-acac species bind to apoHTF, this is not clearly visible
in the CD spectra measured.
2.2.2. Small-angle X-ray scattering (SAXS).
Data from native apo-transferrin were evaluated for
concentra-tion dependence using Primus,[80] and extrapolated to zero
concentration. Using this method, a radius of gyration of 33.2 a was derived from the experimental data, with approxi-mate molecular weight of 74 kDa, and Porod volume
137000 a3. This is in agreement with the known molecular
weight of &79 kDa. The Kratky plot indicates a globular, multi-domain protein, as expected from the published PDB
struc-tures. The P(r) function derived from the data indicates Dmax
(the maximum atomic distance vector in the system) to be 112 a as shown in Figure SI-9-1. Shape reconstruction using the data pipeline described in the SI section was carried out, with the filtered and refined structures shown in Figure SI-9-2. The data indicates interesting differences between the solution state structure and that derived from X-ray crystallography.
Using the PDB model 2HAV,[81]a theoretical R
g(radius of
gyra-tion) of 31 a was obtained using the CRYSOL package.[82] The
Figure 5. Circular dichroism spectra in the visible range of solutions contain-ing apoHTF (&600 mm) and [VIVO(acac)
2], and of VIVOSO4and apoHTF
(&750 mm) at pH 7.4, with the indicated VIV:apoHTF molar ratios. The
base-line in this Figure corresponds to the CD spectrum of the solution of apoHTF. A quartz cell with optical path of 2.0 cm was used.
theoretical fit, shown in Figure SI-9-3, is satisfactory, suggesting
that, despite the described Rgdifference, the overall envelope
shape of the solution state and crystallographic structure is similar.
A similar methodology was followed for the apoHTF-[VIVO(acac)
2] sample. Comparing the results obtained from
both samples, the sample containing apoHTF and [VIVO(acac)
2]
showed immediate, detectable differences on the SAXS length scales (Figure SI-9-4). In particular, the incubated sample was shown to possess significantly smaller radius of gyration at 30.8 a, and smaller derived molecular weight, at 66 kDa. More-over, even if the indicated globular structure is conserved, the normalized Kratky plot appears to indicate significant differen-ces in domain structure from the native apoHTF. Not surpris-ingly, there is also a significant difference in the P(r) function between the native and the incubated sample (Figure 6) with
the concomitant discrepancy in Dmaxvalues (112 a and 104 a,
respectively). A shape reconstruction is shown in Figure SI-9-6. Therefore, the analysis of the SAXS data strongly suggests a clear modification on the conformation of apoHTF upon [VIVO(acac)
2] binding, suggesting the existence of relatively
strong protein-complex interactions. 2.2.3. Maldi-TOF Mass spectrometric data.
As described in the experimental section the samples for
MALDI-TOF MS were prepared with apoHTF:[VIVO(acac)
2] molar
ratios of 1:0, 1:1, 1:2, 1:3 and 1:5 by mixing different volumes
of the stock solutions with a NH4HCO3buffer (pH 7.4, 25 mm).
The results hereby reported were obtained with samples pre-pared by the Dried Droplet procedure, and each final spectrum was the accumulated result of at least 1000 laser shots that were obtained from 10 different manually selected regions of the same sample, over the range 14000–160 000 Da.
In a set of experiments, the average mass obtained for apoHTF was 79247(:20), while the average mass obtained
with samples containing 1:3 apoHTF:[VIVO(acac)
2] molar ratios
was 79 581(:20). Thus, the difference in masses is significant (&334). We assign this difference to the binding of two
[VIVO(acac)+] moieties to apoHTF, which corresponds to
&332 Da. Figure 7 depicts two representative Maldi-TOF mass spectra.
In a distinct set of experiments the [VIVO(acac)
2]:apoHTF
molar ratios were increased and the differences in masses were 201 (for 1:1), 346 (for 2:1) and 346 (for 3:1), this agreeing
with the binding of one [VIVO(acac)+] moiety to apoHTF for
the 1:1 molar ratio, and two for the 2:1 and 3:1 molar ratios. Interestingly, in similar MALDI-TOF experiments carried out
with 5:1 [VIVO(acac)
2]:apoHTF molar ratios the obtained
aver-age difference in mass between the samples of apoHTF and [VIVO(acac)
2]:apoHTF was 653(:60, considering the several
spectra obtained for different samples of these solutions). This is consistent with the binding to apoHTF of for example, two [VIVO(acac)(H
2O)+] moieties +one [VIVO(acac)2] (total mass=
633).
By doing experiments (described in the experimental sec-tion) doing laser shots in separate but very close spots, one containing the apoHTF, the other containing the solution of [VIVO(acac)
2], where the m/z peaks obtained were equal to
those of apoHTF alone, the existence of false positives can be ruled out (or at least the probability of their existence consid-ered extremely low). We cannot totally rule out the possibility of non-covalent interactions explaining the increase in mass. However, it should be highlighted that the peak shapes (of m/ z=1 and 2) are both similar and sharp. If several different pro-tein-complex interactions were established (as for non-covalent
interactions), this would lead to broadening of the peaks.[83]
Figure 6. Superposition of pair distance distribution function for both ana-lyzed samples—native apoHTF (black) and apoHTF-[VIVO(acac)
2] (reddish)—
highlighting their disparity.
Figure 7. MALDI-TOF mass spectra obtained for samples of (a) apoHTF and (b) apoHTF + [VIVO(acac)
2.2.4. Use of size exclusion columns.
To further confirm the binding of [VIVO(acac)
2] to transferrin,
solutions containing apoHTF (ca. 140 mm) and different
amounts of [VIVO(acac)
2] were prepared, with molar ratios
rang-ing from 1 to 8, and eluted with a tris buffer solution through desalting columns (PD-10 size exclusion columns, see experi-mental and SI sections). When using these columns the frac-tions first eluted contain apoHTF (and species bound to it), while the small molecules not bound to the macromolecule are retained inside the pores of the packing of the column, and are only eluted after significantly larger volumes of buffer pass through it. The eluate of the first eluted fractions were an-alyzed by inductively coupled plasma—atomic absorption spectroscopy (ICP-AES). The dilution effect from the elution (&67 %) was determined taking into account the absorbance of an apoHTF solution before and after eluting it, in
experi-ments with no addition of [VIVO(acac)
2]. Results of the ICP-AES
analysis are included in Table 2. In this table, the similarly ob-tained values for HSA are also included (see section 2.3.3).
From these experiments it is clear that the eluted apoHTF fractions contain bound vanadium complexes. The
vanadiu-m:apoHTF molar ratios determined in these fractions (3rd
column of Table 2) are lower than those in the corresponding solutions added to the top of the size exclusion columns, the differences increasing with the increase in the initial [VIVO(acac)
2]:apoHTF molar ratios. In fact, for the 1.01:1 ratio
the difference between the ratios V:HTF in the added and
eluted solutions is &11%, this meaning that the VIVO-complex
is quite strongly bound to apoHTF. For the 2.05:1 molar ratio, ca. 73 % of vanadium remains bound to the protein, while for the 7.89:1 molar ratio only ca. 39 % of total vanadium initially
added remained bound to apoHTF. This suggests that up to a [VIVO(acac)
2]:apoHTF molar ratio of ca. 2 the vanadium
com-plex binds quite tightly to the protein, while higher amounts
of VIVO-acac species do not bind so strongly. Thus the
equilibri-um:
Vanadium bound to apoHTF
Ð Vanadium ðnot bound to apoHTFÞ þ apoHTF ð3Þ
is, in proportion, more shifted to the right as the [VIVO(acac)
2]:apoHTF molar ratio of the solutions prepared
in-creases, this indicating that the “first” two moles of vanadium bind to distinct sites (thus forming distinct and more tightly bound complexes) from those that start being “occupied” only when having higher molar ratios.
In these experiments, where the vanadium amount is deter-mined by ICP-AES, no information may be obtained regarding
which VIVO-containing species bind to apoHTF.
Notwithstand-ing, the data obtained by mass spectroscopy are compatible with those obtained with the size exclusion columns: a total of
at least three VIVO-moieties might bind to apoHTF. The mass
spectrometric data suggests that when taking excess of [VIVO(acac)
2], two [VIVO(acac)+] moieties may be bound to
apoHTF residues, for example, of the Fe binding sites, as well as one [VIVO(acac)
2] (more weakly bound). We cannot rule out
the possibility that the binding of VO-acac species to apoHTF might be non-covalent, but the pattern of results obtained and the fact that almost no binding was found for HSA indi-cates that at least two VO-acac species bind to apoHTF involv-ing coordinative bonds.
2.2.5. Electron Paramagnetic Resonance
Our present CD data clearly confirm that VIVO-acac-apoHTF
species do form in solutions containing [VIVO(acac)
2] and
apoHTF, contradicting previous conclusions[29,44]mainly based
on EPR spectroscopic measurements, where no VIV
O-acac-apoHTF species were identified. In studies with HSA[29,38] and
with Immunoglobulin G[43] it was also reported that only
[VIVO(acac)
2] (not bound to the proteins) is detected.
The EPR spectra for aqueous solutions of [VIVO(acac)
2] depict
broad lines due to solute aggregation upon samples freezing. Addition of & 2% of ethylene glycol favors glass formation and well-resolved spectra are obtained. Several solutions of [VIVO(acac)
2] in this work were made in DMSO and later diluted
in buffers, the content of DMSO varying from 4 to 10%; the
EPR spectra of frozen solutions of [VIVO(acac)
2] containing 2%
of ethylene glycol or 4–10 % of DMSO were identical. Figure SI-4-1 depicts examples of these EPR spectra and Table 3 summa-rizes the spin Hamiltonian parameters obtained. The spectra of [VIVO(acac)
2] in water was simulated considering either (i) axial
symmetry and the presence of 2 species; or (ii) rhombic sym-metry considering only one species. Although both simulations gave good fittings, the bandwidth in the low and high field re-gions is quite large, suggesting that 2 species coexist (see Fig-ures SI-4-2 to SI-4–5 and discussion in SI section). Therefore, in Table 3 we consider the existence of two species. The spin
Table 2. [VIVO(acac)
2]:apoHTF and [VIVO(acac)2]:HSA molar ratios of the
solutions prepared and applied to the top of size exclusion columns, and the same ratios determined on the fraction collected containing the pro-tein.[a,b]
[VIVO(acac) 2]:protein
molar ratio before elution Vanadium concentration (M) in the 1st eluted fractio-n[a] Vanadium:protein molar ratio in the 1steluted frac-tion[b] Relative values (in %) of the V:protein molar ratios before and after elu-tion apoHTF 1.01 0.8(4)V10@4 0.9 89% 2.05 1.4 V10@4 1.5 73% 4.02 1.9 V10@4 2.1 52% 7.89 2.9 V10@4 3.1 39% HSA 2.0 <10V10@6 <0.2 <10% 5.0 5.1 V10@5 &0.5 &10%
[a] The concentrations of vanadium in the first eluted fractions were de-termined by ICP-AES. [b] The concentration of apoHTF and of HSA in the eluted fractions was determined by UV absorption spectroscopy upon eluting samples only containing the protein. In the case of apoHTF the solutions applied on the top of the column were &140 mm and in the 1st
eluted fraction were &94 mm; in the case of HSA they were 137.4 mm and in the 1steluted fraction were &96.1 mm.
Hamiltonian parameters calculated theoretically using DFT methods and considering either water or methanol as solvent
both yielded Az=167.3V10@4cm@1, thus giving good
agree-ment with the experiagree-mental values obtained in this work or with those of Garribba et al.[49]and other authors.[2,51]
The EPR spectra of the solutions containing [VIVO(acac)
2] and
apoHTF frozen ca. 10 min. and 24 h after preparation are iden-tical (Figure SI-5-2). Figure SI-5-3 depicts X-band EPR spectra,
measured at 77 K, of a solution of [VIVO(acac)
2] in water
(con-taining & 10% DMSO) and of solutions con(con-taining [VIVO(acac)
2]
and apoHTF (2:1 and 4:1 molar ratios). Noteworthy is the ob-servation that while the EPR spectra for solutions containing [VIVO(acac)
2]:apoHTF molar ratios of 4:1 (typically the
condi-tions used in the experiments of Garribba and co-workers[29,44])
are almost identical to those of [VIVO(acac)
2], that of the
sample with 2:1 molar ratio differs significantly. This is empha-sized in Figure 8, where an amplification of the high field
range of the same spectra is depicted. The species
designated by D (with gz=1.949; Az= 171.5 V
10@4cm@1) differs from those of [VIVO(acac)
2]. It
resembles the spin Hamiltonian parameters of
the VIVO-apoHTF species B (Table 3), but the
corresponding CD spectra differ significantly, thus
species D should be assigned to a VIVO-acac-HTF
complex.
The spin Hamiltonian parameters determined for
solutions containing [VIVO(acac)
2] in the presence or
absence of apoHTF are quite similar, but not identi-cal; they are also not much different from those
ob-tained for the VIVO-apoHTF system (Table 3).
Regard-ing the identification of the VIVO-acac-apoHTF
spe-cies that form, namely if either [VIVO(acac)
2-apoHTF]
or [VIVO(acac)-apoHTF] species form, it is not possible
to indicate definite formulations from the EPR spec-tra measured. In fact, although frozen solution EPR spectra are an extremely useful tool to characterize
and distinguish distinct VIVO-species that may be
present in a certain medium,[84–89] EPR spectra of
frozen solutions may not be a totally reliable guide
for judging the molecular structure of VIV
O-com-plexes,[51,84] particularly when several species may
form which yield similar spin-Hamiltonian parame-ters, as is the case here (see also below).
The formation of [VIVO(acac)(apoHTF)] species is
akin of the formation of [VIVO(acac)(L)] compounds.
Such type of complexes have been often reported, some of them with molecular structure characterized by single-crystal XRD and with data of frozen solu-tion EPR spectra (see for example, Figure 9). In most of the complexes depicted in Figure 9 the ligands L have donor atoms resembling those available in HTF, namely in its iron binding sites. Table SI-8.5-1 includes EPR spectroscopy data for several distinct systems
containing VIVO-acac species, with data including
either [VIVO(acac)
2(L)] complexes (e.g. with L= Mepy
or py)[51]or [VIVO(acac)(L)] (e.g. with L=bzpy-tch[6](4)
and sal-dmen (6),[92]Figure 9), where the spin
Hamil-tonian parameters are quite similar, some of them involving
the acac@ ligand with one of the O
acacdonor atoms bound cis
to the Ooxido.
Considering complexes [VIVO(acac)
2(4-Phpy)] (3) and
[VIVO(acac)
2(py)] (9), while the DFT calculated energies of the
trans- and isomers in MeOH solution are similar (the cis-isomer is more stable than the trans-one by 3.3 and
7.5 kJmol@1, respectively), their corresponding theoretical A
z
values are also almost identical, that is, 160.6V10@4 (3-trans),
161.2V10@4cm@1 (9-trans), 159.5 V10@4 (3-cis) and 159.7V
10@4cm@1(9-cis). These values are lower by &4% than those
observed experimentally for the system bearing [VIVO(acac)
2]
and pyridine (165.5V10@4cm@1,[51] Table SI-8.5-1), the latter
being closer to the Azvalue of the penta-coordinated complex
[VIVO(acac)
2] (165–168V10@4cm@1, Table 3). The calculations
also suggest that the coordination of Phpy or py to [VIVO(acac)
2] is not favorable thermodynamically, being both
Table 3. Spin Hamiltonian parameters obtained for the systems VIVOSO
4and apoHTF
and [VIVO(acac)
2] and apoHTF in this work and in previous publications. The present
data were obtained by simulation of the experimental EPR spectra with the computer program of Rockenbauer and Korecz.[90]
System gx, gy gz Ax, Ay (V104cm@1) A(V10z 4cm@1) g(iso),A(iso) VIVO-HTF spe-cies[26,29, 30,32,84,88,89,91] A 1.938:0.002 168.5:0.5 VIVO-HTF[29,30,84, 89] B 1.939:0.003 171.0:1.0 [VIVO(acac) 2] in MeOH (axial)[51] 1.9751.981 1.948 60.4, 56.2 166.8 1.968,96.6 [VIVO(acac) 2] in MeOH[2] A’ B’ 1.9781.976 1.9461.948 55.460.0 168.5164.6 1.967,93.2 1.967, 94.6 [VIVO(acac) 2] in MeOH, this work 1.9841.981 1.9501.952 5661 169166 [VIVO(acac) 2] in water or methanol, DFT calcula-tions, this work
60, 62.6 167.3 [VIVO(acac) 2] in water[65] Major minor 1.970,92 1.970, 97 [VIVO(acac) 2] in water[49] 1.977 1.970 1.946 51.456.1 166.5 [VIVO(acac) 2] in water (containing 2% EtGly-col), this work[a]
1.985 1.982 1.9551.957 55.259.3 168.0167.5 [VIVO(acac) 2] in water[2] 1.976 1.974 1.9461.945 54.459.0 165.3168.0 1.966,91.3 1.964, 95.4 [VIVO(acac) 2] and apoHTF (4:1)[29] 1.948 166.8 [VIVO(acac) 2]:apoHTF 2:1 this work[b] C D MinorMajor 1.9841.982 1.9551.949 58.856.6 167.1171.5 [VIVO(acac) 2]:apoHTF 4:1 C this work 1.984 1.956 58.7 167.4
[a] EPR spectra of frozen solutions of [VIVO(acac)
2] containing 2% of ethylene glycol
(EtGlycol) or 4-10% of DMSO are identical. [b] The EPR spectra of frozen solutions con-taining [VIVO(acac)
2] and apoHTF in the presence or absence of carbonate are identical
endothermic (by & 21 kJmol@1) and endergonic (by 70.7–
74.9 kJmol@1).
Comparison of the data included in Tables 3 and SI-8.5-1 allows stating that, the assignment of a particular
formula-tion or concluding the non-formaformula-tion of VIVO-acac-apoHTF
spe-cies, based on the solution EPR spectra measured for the [VIVO(acac)
2]—apoHTF system, cannot be made reliably. Other
techniques must also be used (e.g. CD, MS measurements, etc.) and the conclusions made must be compatible with all experi-mental results obtained.
The similarity of the spin Hamiltonian parameters of several [VIVO(acac)
2(L)] and [VIVO(acac)(L)] complexes and the CD and
EPR spectra obtained for the [VIVO(acac)
2]—apoHTF system
lead us to state that the formation of [VIVO(acac)(apoHTF)]-type
species appears quite plausible. Thus, the EPR spectra obtained in this work may be considered compatible with the sugges-tion made above, that a significant fracsugges-tion of the complexes
formed in solutions of [VIVO(acac)
2] and apoHTF correspond to
[VIVO(acac)(apoHTF)] species, such as the example depicted in
Figure 10 A, where the VIVO:acac molar ratio is 1:1 and the VIV
is bound to more than one chiral residue of apoHTF.
According to the data of Table 2, at least three VIVO centres
may bind to apoHTF. If two bind to residues of the two iron binding sites (e.g. as the example of Figure 10A), then it is
plausible that at least one [VIVO(acac)
2] may be bound to
apoHTF at a side group of an available imidazole, amino or car-boxylate moiety of HTF residues (see Figure 10, trans and
B-cis). The formation of these [VIVO(acac)
2(apoHTF)] species
re-sembles that of the many [VIVO(acac)
2(L)] complexes reported
in the literature, for example, 2–8 and 3 (Figure 2, 9 and 10A), this by itself supporting the plausibility of their formation.
At this point it is also worth to mention that the immobiliza-tion of [VIVO(acac)
2] onto solid supports has been
report-ed[15,95–97]and the binding established has been considered to
involve: (i) hydrogen bonding between the pseudo p system
of the acac@ ligand and the silanol protons of the supports,
and/or (ii) ligand-exchange with the formation of a covalent bond between the V centre and an O-atom from the support, (iii) interactions between the complex vacant orbitals and the p electrons of the polymer benzene rings of polystyrene
sup-ports,[97] (iv) Schiff base formation by condensation between
the carbonyl group of the acac@ ligand and the free NH
2
groups previously grafted onto the support’s surface.[95]
Namely, the immobilization of [VIVO(acac)
2] onto silica
nanopar-ticles functionalized with 3-aminopropyltriethoxysilane (APTES) was reported to involve a covalent bond of the N-amino atom
with the VIV centre, as depicted in Figure 11.[15] This grafted
complex was applied in the catalytic epoxidations and it could be recycled and reused four times, with similar catalytic activity and regioselectivity. This means that the bond established is strong enough for the complex to remain attached to the solid support.
Thus, whatever the correct formulation of these anchored
VIVO-acac species to solid supports, besides the VIV
O-acac-apoHTF species discussed above (probably bound to some of the amino acid residues of Fe binding sites), the formation of [VIVO(acac)
2(apoHTF)] complexes most probably also occurs,
but correspond to weaker interactions. In these species, be-sides the monodentate coordination of donor atoms of avail-able imidazole, amino or carboxylate moieties of HTF residues, probably several types of intermolecular interactions are also operating, for example, hydrogen-bond formation.
The formation of a Schiff base between -NH2 of amino acid
residues, for example, a lysine, and acac ligands probably does not occur, as no electronic transitions due to imine bonds were detected in the range 300–400 nm; additionally, the Gibbs free energy of the reaction depicted in Scheme 1 sug-gests that the process might not be thermodynamically fa-vored.
Figure 8. High field range of the 1stderivative EPR spectra of solutions of
[VIVO(acac)
2] (black), or [VIVO(acac)2] and apoHTF with 2:1 molar ratio (blue)
and 4:1 molar ratio (red), recorded at 77 K. The vertical lines are inserted to better identify the position of the maxima. The full spectra are depicted in Figure SI-5-3.
Figure 9. Several [VIVO(acac)(L)] complexes reported in the literature, some
of them with spin Hamiltonian parameters closely resembling (see Table SI-8.5-1) those obtained for the VIVO-acac-apoHTF system. For compounds 5–8
2.2.6. DFT calculations
To investigate the plausibility of coordination of the
[VIVO(acac)+] moiety to Tyr, Asp and His, the amino acid
resi-dues of the iron binding site of HTF, DFT calculations of the
model complexes [VIVO(acac)(T)(A)(H)]@ (1T),
[VIVO(acac)(T)
2(A)]2@ (2T) and [VIVO(acac)(T)2(H)]@ (3T)
(T=p-EtC6H4O@, A= EtC(=O)O@, H=4-ethylimidazole) (Figure 12)
were carried out for water solution. Model complexes 1T
simu-late the binding of [VIVO(acac)+] to one tyrosine, one aspartate
and one histidine residues of apoHTF, while complexes 2T and 3T model the binding with two tyrosines and either one
aspar-tate or one histidine residues. For each type of complex, all possible geometrical isomers were calculated (Figure 12). The results indicate that the isomer 6 of model complex 1T, with the mutual trans-position of A and H, is the thermodynamically most stable one. For model complexes 2T, the most stable one, isomer 3, bears two T ligands trans to each other. Finally, for model complexes 3T, the most stable one, isomer 4, has the H and one of the T model ligands in the mutual trans-posi-tion. In all of these most stable isomers, one of the O-acac donors is trans to the O-oxido ligand. Other isomers of each
type of model complexes are less stable by 3.3–25 kJmol@1.
Figure 10. Sketches of types of binding of VIVO–acac species to apoHTF. A: binding of [VIVO(acac)+] to donor atoms of amino acid residues of apoHTF,
belong-ing or not to the iron bindbelong-ing sites (here amino acids of residues from the N-lobe are specified); B-trans: bindbelong-ing of a donor atom trans to O-oxido of [VIVO(acac)
2]; B-cis: binding of a donor atom cis to O-oxido of [VIVO(acac)2]. Atom X may be for example, an N-amino, N-imidazole or O-carboxylato. The
inser-tion of dashed lines emphasize that hydrogen bonds or p-type bonds may be established between VIVO-acac complexes and residues of apoHTF.
Figure 11. [VIVO(acac)
2] immobilized of onto silica nanoparticles
functional-ized with 3-aminopropyltriethoxysilane (APTES), as indicated in ref. [15].
Scheme 1. Scheme modeling the reaction of [VIVO(acac)
2] with -NH2of an
amino acid residue to form a Schiff base. The Gibbs free energy of this reac-tion in CHCl3solution calculated by DFT procedures is +55.6 kJmol@1. The
DFT calculated EPR spectroscopic parameters Az, Axand Ayfor the complex
The calculations also indicate that model complex 3T is
ther-modynamically more stable than 1T, the DGsvalue of the
reac-tion 1T+T!3T+A being @22.6 kJmol@1. The stability of
com-plex 2T relative to 1T or 3T cannot be estimated with any rea-sonable accuracy due to different overall charge of these spe-cies. Note that in 1T-3T the ligands are not linked with each other.
Taking into account the rather small energy difference of
various geometrical isomers, the binding mode of [VIVO(acac)+]
to apoHTF is conceivably controlled by the secondary structure of the protein and intermolecular interactions with groups from the protein, rather than by the thermodynamic stability of a particular ligand configuration in the metal coordination sphere. Noteworthy is the finding that in all these simulated
[VIVO(acac)(L1)(L2)(L3)] structures, those found more stable
in-volve one of the Oacac donor atoms bound axially. It should
also be emphasized that hydrogen bonds to for example, the Ooxidoor Oacacatoms may change significantly the relative
ener-gies and the Az values corresponding to calculated 1T-3T
model structures.
The calculated hyperfine coupling constants Azfor the
vari-ous isomers of 1T-3T are in the range of 153.6–161.6 V
10@4cm@1(Figure 12) and they are lower than the values found
experimentally for the system [VIVO(acac)
2]+ apoHTF (Table 3).
However, in similar structures including one water molecule bound equatorially, instead of for example, a O-Tyr donor
atom, the corresponding Az values increase by (3 to 6)V
10@4cm@1(Figure 13).
The calculated DHs values of the reactions: [VIVO(acac)2]+
T+A +H!acac@+ 1T (isomer 6) and VO(acac)
2+2T+H!
acac@+3T (isomer 4) are significantly positive (62.8 and
41.0 kJmol@1, respectively) indicating that the formation of
complexes 1T and 3T from VO(acac)2is thermodynamically
un-favorable. This again suggests that the binding of [VO(acac)+]
to apoHTF should be stabilized also by intermolecular H-bond-ing rather than by simple coordination of T, A and H to the
Figure 12. Calculated structures of complexes 1T-3T. Gibbs free energies in water solution relative to the most stable isomer and Ax, Ayand Azvalues are
metal. These effects are not taken into account in the calcula-tions corresponding to Figures 12 and 13, neither possible ef-fects from rearrangement of the apoHTF conformation upon binding of VO-acac species. In the next section these effects are somewhat taken into account.
2.2.7. Modeling of the binding of VO-acac species to HTF
VIVO and various VIVO-acac complex species, namely
[VIVO(acac)
2], [VIVO(acac2)(H2O)], [VIVO(acac)(H2O)2] and
[VIVO(acac)(H
2O)], were optimized at the PM7 semi-empirical
level as implemented in MOPAC2016[98,99] and were checked
against B3P86/6–311 g DFT geometries.[100]The N-lobe of HTF
was modelled using (a) the closed conformation (PDB ID
1a8e),[101](b) the oxalate-bound conformation (PDB ID 1ryo)[102]
(3), which is not as tightly packed around the iron site as the closed conformation, as well as using (c) the open
conforma-tion (PDB ID 1bp5);[103]in the latter, the V atom was located at
the geometric centre of the iron-coordinating residues (see ex-perimental and SI sections).
No meaningful structures of VIVO-acac complexes with the
closed conformation of HTF (after removing the FeIIIand
car-bonate ions) were found due to the small volume available to bind these complexes. For the other protein forms, the most energetically favourable protein complexes were formed with the [VIVO(acac)(H
2O)2] species. For the association of all VIVO
complexes, after re-optimization of protein conformation, com-puted heats of formation with the open form of the protein is always energetically preferred when compared with the associ-ation with the oxalate-bound form. Table SI-10-1 includes the computed heats of formation for the various systems before carrying out the re-optimization of protein conformation. Table SI-10-2 includes these data after the re-optimization. Globally,
it may be stated that the binding of either [VIVO(acac)+] or
[VIVO(acac)
2] correspond to favourable thermodynamic
process-es, but it should be noted that in these calculations entropy changes are not taken into account.
The modelling of the binding of the [VIVO(acac)+] moieties
correspond to lower computed heats of formation than those
for the binding of [VIVO(acac)
2]. In each structure refined the
VO-acac complexes are tightly held in place by a large range of interactions, including water bridges, hydrogen bonds and metal cation-p interactions. Additionally, the processes where the lower energies were obtained gave rise to a type of
bind-ing of vanadium to a tyrosine residue which was not anticipat-ed. In fact, in the structures refined, apart from the V= O bond lengths of ca. 1.6–1.7 a, and the binding to two O-acac atoms
at ca. 1.7–1.8 a, the VIVis bound to the aromatic ring of a
tyro-sine, with V-C distances in the 2.30–2.40 a range, resulting in half-sandwich complexes; this type of binding has been found
for vanadocene(IV)-type compounds[105,106](see more details in
the SI section, namely Figures SI-10-1, -2 and -3). Coordinating residues, and other relevant residues in the vicinity of the li-gands, involve the Fe-binding residues, Asp63, Tyr95, Tyr188, and His249, but also other protein residues, in particular Lys206, Ser125, Ala126 and Pro247, also participate in the ligand-protein interaction, which is in agreement with previous results on the VO interaction with the N lobe of hTF in the
presence of carbonate.[104] However, the A
z values calculated
for the model structures, upon freezing its coordinates similarly
to what was done in [104] are rather low, ca. 141V10@4cm@1,
so we rule out this type of binding of VIVO-acac species.
The structure (model A, Figure SI-10-4) where in equatorial position are O-acac (at 1.9 a), two O-atoms from Tyr188 (O at 1.9 a) and Tyr95 (HO at 2.5 a), O-carboxylate from Asp63 at (2.0 a), and O-oxido and another O-acac axially, at 1.6 and
2.2 a, respectively, correspond to Az= 162V10@4cm@1, thus not
far from experimental. The water molecule in the vicinity is at
a 2.4 a V-Owaterdistance and there is a hydrogen bond between
the NH3+ of Lis296 and the O-oxido (H-O distance of 1.9 a).
We are not stating that this particular structure (model A) is the one formed in the system: N-lobe of apoHTF + [VIVO(acac)
2], but instead that the binding of VIVO(acac)+
moi-eties to residues of the Fe-binding site can be modelled, the reaction corresponding to this process is thermodynamically
favoured and may yield structures with Azvalues not far from
those of [VIVO(acac)
2] complexes.
2.2.8. Fluorometric assays
Intrinsic protein fluorescence is mainly due to tryptophan and tyrosine residues. Fluorescence assays have been used to mon-itor the binding of several compounds to proteins, namely to
HTF and HSA. The study of the binding of [VIVO(acac)
2] to BSA
by fluorometric measurements was reported before,[39]but not
to HSA.
Tryptophan residues are the least common amino acids in proteins but normally dominate their fluorescence
proper-Figure 13. Calculated structures and spin-Hamiltonian parameters for some of the complexes of proper-Figure 12, substituting equatorially bound O-Tyr donor atoms, by Owaterdonor atoms.
ties,[107–109] and are the most commonly used intrinsic
fluoro-phores. The fluorescence emission from Trp residues is very
sensitive to changes in local environment[110]and this
sensitivi-ty has been used extensively to monitor numerous biological processes. However, often it is not possible to pinpoint the precise causes of changes in the fluorescence yield, thus limit-ing the usefulness of the fluorometric measurements. If there is more than one Trp in a protein, as is the case of HTF, further complications arise when trying to interpret the changes in fluorescence at the molecular level. However, it was reported that emission from the N-lobe of HTF is dominated by Trp264.[108]
Except one study with vanadocene dichloride,[111] to our
knowledge fluorometric techniques were not previously re-ported for studies of binding of vanadium compounds to HTF.
The binding of VIVO-complexes to apoHTF, namely at the iron
binding sites, leads to the presence of the VIVO-species not far
from a Trp residue at each site; moreover, the hydrodynamic volume of the protein may change. Both these effects may change the fluorescence intensity.
Figure 14 depicts fluorescence emission spectra of the
apoHTF-[VIVO(acac)
2] system, when using the excitation
wave-length (lex) of 295 nm. ApoHTF demonstrates strong
fluores-cence emission with a maximum at &322 nm. As the complex concentration increases the HTF fluorescence decreases; thus, the fluorescence quenching is concentration-dependent and
apparently [VIVO(acac)
2] binds close enough to the tryptophan
residues, namely Trp264, to quench their fluorescence. Under our experimental conditions, no fluorescence emission in the range 295–550 nm was displayed for the studied compounds and therefore there was not any interference with the fluores-cence of apoHTF.
It is common to use fluorescence quenching measurements to evaluate binding constants of compounds to proteins. In
the case of organic compounds, the conditions required for such methods to be reliable for use for this purpose have been discussed.[112,113]If these conditions are nor fulfilled,
fluo-rescence quenching measurements should not be applied to evaluate binding constants of compounds to proteins, but in practice many studies are published without verifying the val-idity of the procedures. In the case of metal complexes there are further requirements that will be discussed below.
The methodology typically used in many publications was used in this work and is described in the SI section (SI-6); namely the fluorescence quenching measurements were made
with a concentration of protein (apoHTF) of ca. 10@6m, and
varying the metal complex concentration from ca. ca. 10@6to
ca. 10@5m (see Figure 14).
Upon applying the Stern–Volmer equation the
correspond-ing quenchcorrespond-ing constant KSVwas obtained (Table 4). Following
the typical calculation methodologies used in the literature, the quenching mechanism was considered to be static (due to binding of a VO-acac complex to apoHTF) and the binding
constant KBCgiven by equation 4, and number of binding sites
(n) were determined (Table 4). n ½VIVOðacacÞ
2A þ protein Ð f½VIVOðacacÞ2Agn-protein ð4Þ
When excitation was made at 280 nm (for which the other protein fluorophores, Phe and Tyr, may also be excited) a higher quenching % was obtained (45%), as well as a higher
KSV constant (3.9 V104m@1). The calculated binding constant
was: KBC=1.4V104m@1.
Considering the procedure described above and in the SI section (SI-6), from the fluorescence measurements we would
conclude that [VIVO(acac)
2] is able to bind apoHTF, although
the quenching of the fluorescence is only moderate. Around
30% quenching of the Trp fluorescence is observed, the KSV
being 1.9V104m@1, the binding constant K
BCestimated in these
measurements being 1.0V104m@1.
Comments to the use of fluorescence quenching measurements to calculations of binding constants. The fluorescence and its quenching is a rather indirect measurement of the interaction of [VIVO(acac)
2] with apoHTF, as the Trp residues may not be
close to the binding site responsible for the quenching effect, and there might be binding at sites which do not affect the fluorescence emission. Moreover, in the case of metal com-plexes, besides the requirements discussed in [112,113] for the validity of use of fluorescence emission to calculate binding constants, there are further aspects/issues related to the speci-ation of the systems at low concentrspeci-ations of labile metal
com-Figure 14. Variation of the fluorescence intensity of apoHTF upon addition of [VIVO(acac)
2]. The apoHTF concentration was 1.02V10@6m and that of
[VIVO(acac)
2] was increased from 0 to 1.77V10@5m, that is, from
[VIVO(acac)
2]:HTF: ratios from 1 to 17. Conditions: T=298 K, pH 7.4 (buffer)
and lex=295 nm. Concentration of the mother solution of [VIVO(acac)2]
added: 188 mm.
Table 4. Stern–Volmer constant (KSV), R2(from SV plot), binding constant
(KBC), number of binding sites on the protein (n) and R2(from KBCfitting)
for the interaction of [VIVO(acac)
2] with HTF and HSA (see below).
Protein 10-4K
SV(M@1) R2 10@4KBC(M@1) n R2
HTF 1.9 0.993 1.05 1.15 0.995
![Figure 4. Absorption spectra of solutions of [V IV O(acac) 2 ] added to solutions of (A) imidazole (Im), and (B) pyrazole (Pz) containing a 40 mm carbonate buffer.](https://thumb-eu.123doks.com/thumbv2/123dok_br/18725211.919135/4.892.104.797.842.1063/figure-absorption-solutions-solutions-imidazole-pyrazole-containing-carbonate.webp)
![Table 1. Summary of assignments in ESI-MS experiments with solutions of [V IV O(acac) 2 ] upon addition to solutions of several potential monodentate ligands](https://thumb-eu.123doks.com/thumbv2/123dok_br/18725211.919135/5.892.410.822.637.1050/summary-assignments-experiments-solutions-addition-solutions-potential-monodentate.webp)
![Figure 6. Superposition of pair distance distribution function for both ana- ana-lyzed samples—native apoHTF (black) and apoHTF-[V IV O(acac) 2 ] (reddish)—](https://thumb-eu.123doks.com/thumbv2/123dok_br/18725211.919135/7.892.470.809.231.585/figure-superposition-distance-distribution-function-samples-native-reddish.webp)
![Figure 8. High field range of the 1 st derivative EPR spectra of solutions of [V IV O(acac) 2 ] (black), or [V IV O(acac) 2 ] and apoHTF with 2:1 molar ratio (blue) and 4:1 molar ratio (red), recorded at 77 K](https://thumb-eu.123doks.com/thumbv2/123dok_br/18725211.919135/10.892.100.412.101.447/figure-high-field-derivative-spectra-solutions-apohtf-recorded.webp)
![Table 4. Stern–Volmer constant (K SV ), R 2 (from SV plot), binding constant (K BC ), number of binding sites on the protein (n) and R 2 (from K BC fitting) for the interaction of [V IV O(acac) 2 ] with HTF and HSA (see below).](https://thumb-eu.123doks.com/thumbv2/123dok_br/18725211.919135/14.892.77.431.738.1016/volmer-constant-binding-constant-binding-protein-fitting-interaction.webp)

![Figure 17. Fluorescence emission spectra measured for a solution of HSA and upon adding [V IV O(acac) 2 ]](https://thumb-eu.123doks.com/thumbv2/123dok_br/18725211.919135/16.892.91.421.90.353/figure-fluorescence-emission-spectra-measured-solution-hsa-adding.webp)

