article
The ShearStress importance on the spatial distribution pattern of the invader
Limnoperna
fortunei
in the Upper Parana´ River Basin. - An assessment based on the Spatial
Distribution Models
Moˆnica de Ca´ssia Souza Campos1,3, Daniel Peifer1& Paulo de Tarso Castro2 1
Centro de Inovac¸a˜o e Tecnologia SENAI, Campus CETEC, Instituto Senai de Tecnologia em Meio
Ambiente, Belo Horizonte, MG, Brazil.
2Universidade Federal de Ouro Preto, Ouro Preto, MG, Brazil. 3
Corresponding author: Moˆnica de Ca´ssia Souza Campos, Av. Jose´ Caˆndido da Silveira, 2000, Santa Ineˆs, CEP 31035-536, MG Brazil, e-mail:[email protected]
CAMPOS, M.C.S., PEIFER, D., CASTRO, P.T.The ShearStress importance on the spatial distribution pattern of the invaderLimnoperna fortuneiin the Upper Parana´ River Basin. - An assessment based on the Spatial Distribution Models. Biota Neotropica. 16(1): e20140164. http://dx.doi.org/10.1590/1676-0611-BN-2014-0164
Abstract:The introduction of the golden mussel,Limnoperna fortunei(Dunker, 1857) in South America was related to the discharge of ballast water, with its first record in 1991 in the La Plata River estuary. Since then, the species is spreading throughout the continent, with several economic and ecological negative consequences.
Aim: To model, in the headwaters of Parana River, the spatial distribution ofL. fortuneiand to understand the determinants of the current pattern of species distribution and the risk of invasion of areas not yet colonized.
Methods:The ecological niche ofL. fortuneiwas modeled using the algorithm MAXENT (Maximum Entropy Method) combined with records of occurrence of the bivalve, limnological data and the shear force measured by the index Hack (SL). The evaluation of the performance of different models was based on AUC (Area Under the Curve).The analysis of each variable’s contribution to the responses of the models was made based on the Jackknife test, available in the Maxent program. The models were validated with real absence data collected between 2006 and 2007. Based on the limnological characterization of the area and on outputs of the models, this analysis sought to understand the contributing aspects to the current and potential spatial distribution and to verify the risk of invasion of environments not yet colonized by the species.
Results/Conclusion:The limnological characterization showed that the ecological requirements for the species as, pH, calcium, oxygen and chlorophylla, were appropriate in both the connected stretches, invaded and non-invaded. Turbidity showed significant spatial differences which proved to be higher in environments with higher levels of Hack (SL), i.e. higher energy fluvial. In addition, the algorithm showed the importance of hydrodynamical aspects expressed by Hack index (SL) to the spatial distribution of species, since the models with the best performances were those that considered the Hack index (SL) as one of the environmental layers of the mussel’s niche. All models indicated a high risk of invasion into the reservoir of Sa˜o Sima˜o.
Keywords: invasive species, biological invasions, niche modeling, Maxent, ecological requirements.
CAMPOS, M.C.S., PEIFER, D., CASTRO, P.T. Importaˆncia da forc¸a de cisalhamento no padra˜o de distribuic¸a˜o espacial do invasor Limnoperna fortunei na Bacia do Alto rio Parana´. – Uma avaliac¸a˜o com base em Modelos de Distribuic¸a˜o Espacial.Biota Neotropica. 16(1): e20140164.http://dx.doi.org/10.1590/ 1676-0611-BN-2014-0164
Resumo: A introduc¸a˜o do mexilha˜o dourado,Limnoperna fortunei(Dunker, 1857) na Ame´rica do Sul
esteve relacionada a`s descargas de a´gua de lastro, com seu primeiro registro em 1991, no estua´rio do rio da Prata. Desde enta˜o a espe´cie vai adentrando o continente – com va´rias consequeˆncias negativas em aˆmbitos econoˆmicos e ecolo´gicos.Objetivo: modelar em escala local a distribuic¸a˜o espacial deL. fortunei
buscando melhor entender os fatores determinantes do padra˜o atual de distribuic¸a˜o da espe´cie e estimar
o risco de invasa˜o de a´reas ainda na˜o colonizadas.Me´todos:A modelagem do nicho deL. fortuneifoi realizada por meio do algoritmo MAXENT (Maximum Entropy Method) aliado a registros de ocorreˆncia do bivalve, a` dados limnolo´gicos e a` forc¸a de cisalhamento medida pelo ı´ndice de Hack (SL).
A avaliac¸a˜o do desempenho dos diferentes modelos foi feita com base na AUC (A´ rea sob a Curva). A
ana´lise da contribuic¸a˜o isolada das diferentes varia´veis para as respostas dos modelos foi feita com base
no teste Jackknife disponı´vel no programa Maxent. Os modelos gerados foram validados com dados reais de auseˆncia coletados entre 2006 e 2007. Com base na caracterizac¸a˜o limnolo´gica da a´rea e nas
respostas geradas pelos modelos de distribuic¸a˜o potencial, buscou-se entender quais aspectos estariam
http://dx.doi.org/10.1590/1676-0611-BN-2014-0164 http://www.scielo.br/bn
Biota Neotropica 16(1): e20140164, 2016
contribuindo para a distribuic¸a˜o espacial atual e potencial e verificar o risco de invasa˜o de ambientes ainda na˜o
colonizados pela espe´cie.Resultados/Conclusa˜o: A caracterizac¸a˜o limnolo´gica mostrou que os requerimentos
ecolo´gicos para a espe´cie como pH, ca´lcio, oxigeˆnio e clorofilaaforam igualmente adequados entre trechos invadidos e na˜o invadidos conectados. Diferenc¸as espaciais significativas foram encontradas em relac¸a˜o a`
turbidez, que se mostrou mais elevada nos ambientes com maiores ı´ndices de Hack (SL), ou seja, com maior energia fluvial. O algoritmo utilizado mostrou a importaˆncia de aspectos hidrodinaˆmicos, expressos pelo ı´ndice de Hack (SL) na distribuic¸a˜o espacial da espe´cie, uma vez que, os modelos com melhor desempenho foram
aqueles que consideraram o ı´ndice de Hack (SL) como uma das camadas ambientais na composic¸a˜o do nicho
da espe´cie. Todos os modelos indicaram tambe´m o alto risco de invasa˜o para o reservato´rio de Sa˜o Sima˜o.
Palavras-chave: espe´cies invasoras, invaso˜es biolo´gicas, modelagem de nicho ecolo´gico, Maxent, requerimentos ecolo´gicos.
Introduction
Exotic invasive species can cause the extinction of vulner-able native species, either by predation, competition, or even the alteration of the habitat. These modifications have been taking place globally (Morton 1997, Karatayev et al. 2007, Karatayev et al. 2008, EPA 2013) and will continue into the future (Ricciardi & MacIsaac 2000), with predictable declines in biodiversity (Sala et al. 2000). Therefore, it is essential to understand the invasion process, predict its successes and effects on the new environment. This includes, among other aspects, the identification of the invading species and the evaluation of probable areas of invasion (Mack et al. 2000).
Knowledge of the environmental characteristics of a given region, together with records of the occurrence of a species, can be used to indicate a range of environmental factors which determine locations in which a species could maintain populations or not – known as the ecological niche (Chase & Leibold 2003). In general, potential distribution models can be considered as the adjustment of a function between the points of occurrence of a species and a multivariate group of environmental data (Phillips et al. 2006). However, an invading species must overcome some filters in order to settle in a new region (Power et al. 1992). These filters include: geographical barriers; the physical environment, which charac-terizes the target habitat and may constitute a more or less favorable environment to a certain invading species; the demo-graphical resistance; and, finally, the biological filter, which can be defined by the competition and predation between previously settled species and invading species (Williamson 1996). The points of occurrence assumed in the modeling process represent areas in which the physical habitat conditions are favorable to the invading species. However, other areas with similar conditions must exist, where the presence of the species is halted by the existence of filters related to inter-specific interactions, the existence of geographical barriers, long distances, and also the non-existence of the species dispersion vector. For this reason, in order to the use potential distribution models it is necessary to take into account the distinctions between the space for the conditions and the sub-space for the resources (Sobero´n 2007). The available environ-mental data must represent the sub-space for the conditions only, rather than the species niche as a whole (see Hutchinson’s (1957) concept).
Limnoperna fortunei(Dunker, 1857) – popularly known as the golden mussel, is a non-native species which is currently spreading unchecked in South America. It was introduced in 1991 on the Argentinian shore, close to the Rio de la Plata (Pastorino et al. 1993), by means of ballast water discharges (Darrigran & Pastorino 1995). It is a freshwater bivalve originally from Chinese and Southeastern Asian rivers (Morton 1975), which has been causing considerable economic and
environmental impact. The occurrence ofL. fortunei from the southern part of South America to the headwaters of the upper Parana´ River (Campos et al 2012) shows how much its spatial distribution has been expanding in Brazil since 1998. For this reason, a better prediction of the environment’s potential to accept or avoid the establishment ofL. fortuneion the basis of niche modeling is essential for developing prevention and control strategies.
Different studies involving the prediction of the spatial distribution of aquatic species have focused on distinct environmental characteristics at the regional or continental levels (Peterson 2001, Peterson & Vieglais 2001, Drake and Bossenbroek 2004, Iguchi et al. 2004, Kluza & McNyset 2005, Campos et al 2014). The first studies related to the generation of ecologic niche models for aquatic species (Strayer 1991, Iguchi et al. 2004, Drake and Bossenbroek 2004, Bossenbroek et al 2007 ) utilized environmental variables (environmental layers) restricted to global climatic environmental variables (e.g., rainfall and air temperature).
In the case of bivalve molluscs, variables such as temper-ature, pH, concentration of calcium in the water, alkalinity, hardness, chlorophyll, granulometric characteristics of natural substrates or even the presence of artificial substrates for settlement may be very important for its establishment in a new environment (Hincks & Mackie 1997 Claudi & Mackie, 1994 Mac Mahon, 1996). Ramcharam et al. (1992) and Mellina & Rasmussen (1994) used pH and dissolved calcium in niche modeling for aquatic species; Koutnik & Padilla (1994) focused on geological information (especially rock types).
Among the studies of theL. fortuneipotential distribution which considered limnological variables, two used data points, from field sampling, to evaluate the distribution of the mussel in the Upper Paraguay River basin in Brazil and in some rivers in North America (Oliveira et al, 2010a, 2010b).
overcome the geographic barrier represented by the Sa˜o Sima˜o hydroelectricity plant and to establish in the river segment upstream. To prove this hypothesis, we modeled theL. fortunei
niche using the algorithm Maximum Entropy Method (Ma-xent), incorporating the shear strength of the aquatic environ-ments as one of the environmental layers of the ecological niche ofL. fortunei.
This paper uses a model of potential distribution of the species based on limnological data and validation with real data. From the evaluation of the best-case and worst-case scenarios, we sought to illustrate that the distribution pattern of the invasive bivalve in a river stretch of the Upper Parana´ River basin may have been influenced by a hydraulic component that has been neglected in studies of this species’ niche modeling.
Material and Methods
1. Area of Study
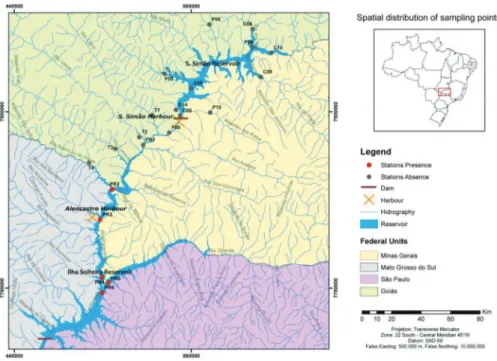
The region of study comprises the confluence of the Paranaı´ba and Grande Rivers, in the borders of the states of Minas Gerais, Goia´s, Mato Grosso do Sul and Sa˜o Paulo (Figure 1). This region is part of the headwaters of the Parana´ River and its tributaries, which are geographically connected to watercourses of other very important Brazilian watersheds. The segment of the lower Paranaı´ba River, downstream from the Hidroeletric Powerplant of Sa˜o Sima˜o, which belongs to Cemig (Companhia de Energia de Minas Gerais – Electric Energy Company of Minas Gerais), corresponds to the initial portion of the Parana´-Tieteˆ waterway, where vessels transporting grains represent the main dispersion mechanism of the invading mussel. The records of the bivalve occurrence, as well as the physical-chemical data used for the construction of the environmental layers, were obtained in 12 field campaigns which took place between 2006 and 2007, encompassing the
rainy and dry seasons, in the lower Paranaı´ba River. Even eight years late, it must be emphasized that the spatial distribution pattern was not drastically modified and until now, the mussel has not invaded the Sa˜o Sima˜o reservoir.
In general, the presence points were used to construct the ecological niche models while the absence points were helpful in validating the generated models.
When modelling invasive species it must be considered that invasives are not in equilibrium with their environment and niche quantification and transferability in space and time are limited (Gallien et al. 2012). For the purpose of this study, only records from the Brazilian invaded region were used. In the case of an invasive species likeL. fortunei, the true potential range of occurrence may differ from the realized range because of dispersal limitation, competition or other factors, so that evaluating model performance is a complex task and the use of observed absences may be misleading (Elith et al 2006). For instance, true absences could be allocated in areas that are either unsuitable for the species, or that are suitable but currently do not host any population. In this way for the case of modelling the potential distribution of an invasive species the techniques that play down the importance of absence information may be better suited to estimation of the ecological and distributional potential of the species, whereas methods incorporating absence information more directly may be more suitable for estimating actual distributions of species (Jimenez– Valverde et al 2011).
1.1 Occurrence points (presence). Six presence points of the species occurrence (Figure 1) were found within a sampling net with 21 points located upstream and downstream from the Sa˜o Sima˜o reservoir (Figure 1). According to Stockwell & Peters (2002), who assessed the accuracy of predictive models generated by different algorithms by comparing them with the number of occurrence records, under a machine-learning methods, average success rate at predicting occurrence of a species at a location or accuracy was 90% within ten sample
Figure 1. Sampling stations and golden mussel occurrence points along the Paranaı´ba River, upstream and downstream from the Sa˜o Sima˜o reservoir (MG/GO), Upper Parana´ River Basin.
http://dx.doi.org/10.1590/1676-0611-BN-2014-0164 http://www.scielo.br/bn
Biota Neotrop., 16(1): e20140164, 2016 3
points. So such a number of recorded presences represents a very satisfactory percentage for the purposes of this study.
1.2 Absence points. The species was not found in the Sa˜o Sima˜o reservoir and its affluents or in the tributaries of the Paranaı´ba River right margin – Claro (T1), Verde (T2), Corrente (T3) Rivers. In relation to the Apore´ (T4) River, the invasive bivalve was found only in the confluence of the Apore´ and Paranaı´ba Rivers (PR2), as it was showed in the Figure 1.
2. Environmental Layers
The choice of the environmental layers was based on the importance of the variables to the species’ biology and its representability of the local heterogeneity (Table 1). As well, the correlation degree between the variables was evaluated to identify a possible collinearity among them. In this way, pH / dissolved oxygen / chlorophylla/ turbidity / conductivity and calcium were considered as directly important to L. fortunei
survival (Morton 1975, Ricciardi 1998, Sylvester et al. 2004, Karatayev et al. 2007, Pareschi et al. 2008). The spatial variation of the physical-chemical properties of water, chloro-phyllaconcentrations and theL. fortuneidensity were assessed by applying a one-way ANOVA and the Tukeys method a posteriori or, a Kruskal-Wallis test for non-normal distribution cases with post-hoc comparisons of mean ranks of all pairs of group (Siegel & Castellan 1988). The degree of correlation between the variables was tested using the non-parametric Spearman’s correlation coefficient. Analyses were performed and graphed using STATISTIC 7 software (StatSoft South America, Sa˜o Caetano do Sul – SP, Brazil).
For this study, an additional variable was chosen: the Hack Index or Stream Length-Gradient Index (SL), which expresses the energy of a fluvial environment and consequently its shear strength (Hack 1973, Etchebehere et al. 2004, Etchebehere et al. 2006).
The Hack Index is generally calculated using a topographic map and is mathematically defined as: SL¼DDHLL; where: L
represents the length of the river segment, taken from its source (longest reach);DH represents the altimetric variation, andDL represents the horizontal distance – thus signifying the average declivity of the segment. From these empirical evidences (Hack 1957, Hack & Young 1959), Hack observed that the river competence is proportional to the channel declivity (S) and the channel length (L) – an increase in size of the particles being deposited in the river channel corresponds to an increase in SL – in other words, the Hack Index (Hack 1973). Assuming that the competence of a river is directly related to its energy, it is understandable that the Hack Index (SL) should be taken as a measure or an indication of the river energy – and, therefore, as a comparative basis between them (Etchebehere et al. 2004, Etchebehere et al. 2006).
The environmental layers used in the simulation resulted from georeferencing the sampling points indicated in Figure 1, and from which abiotic data was obtained. From the spatial distribution of these points in a drainage network, interpola-tions of the spatial variation of limnological data were possible for segments with no punctual sampling. A total of 420 registers were used to create and to test the model. The points of confluence were taken into account in the calculation of the concentrations of abiotic constituents in river segments devoid of information. In these sites, there is a sudden increase in the discharge and sediment load transported by the river, making
adjustments in the river physical-chemical characteristics necessary, in order to compensate for the perturbation of a previous state (Best 1986, Leopold & Langbein 1964, Benda et al. 2004).The interpolation tools used were the Inverse Distance Weighting (IDW) and Kriging, these methods are available on the ArcGIS Spatial Analyst, version 9.
3. Algorithm
The software MAXENT version 3.2.1 (http://www.cs.prince-ton.edu/~schapire/maxent/) was used to model the L. fortunei
ecological niche and ArcGis (version 9.3) was used to spatially represent the output data. The Software MAXENT - Maximum Entropy Method uses the maximum entropy principle, which states that the best approximation for an unknown probability distribution is the one that complies with any restriction to the distribution. This is a method used to make predictions or inferences using incomplete information (Phillips et al. 2006). The application of MAXENT to generate spatial distribution models results in the estimation of the probability of the species occurrence by finding the maximum entropy probability distribution submitted to a set of restrictions that represent the incomplete information on the target distribution.
The option ‘‘Auto features’’ was selected, using as output format the ‘‘Logistic’’ option – which offers an estimate between 0 and 1 for the probability of the presence of the species. 75% of the data was considered training points and was used to construct the model, and the remaining 25% was used as testing points, which are the points (data) used to assess the quality of the model.
From all possible combinations in the Maxent simulations, eight models of the golden mussel ecological niche were selected as representative of the extreme model performance situations – the best-case and worst-case scenarios of potential distribution. The eight chosen models, using different combi-nations of environmental layers, were: (1) all environmental layers; (2) all layers, excepting chlorophyll a; (3) all layers, excepting dissolved oxygen; (4) all layers, excepting the Hack Index (SL); (5) all layers, excepting dissolved oxygen / pH; (6) all layers, excepting dissolved oxygen / pH / calcium / conductivity; (7) all layers, excepting conductivity /pH / dissolved oxygen; (8) only the layers chlorophylla/ SL.
The statistic method used to ascertain the model quality was the Area Under the Curve (AUC) calculated by Maxent software itself.
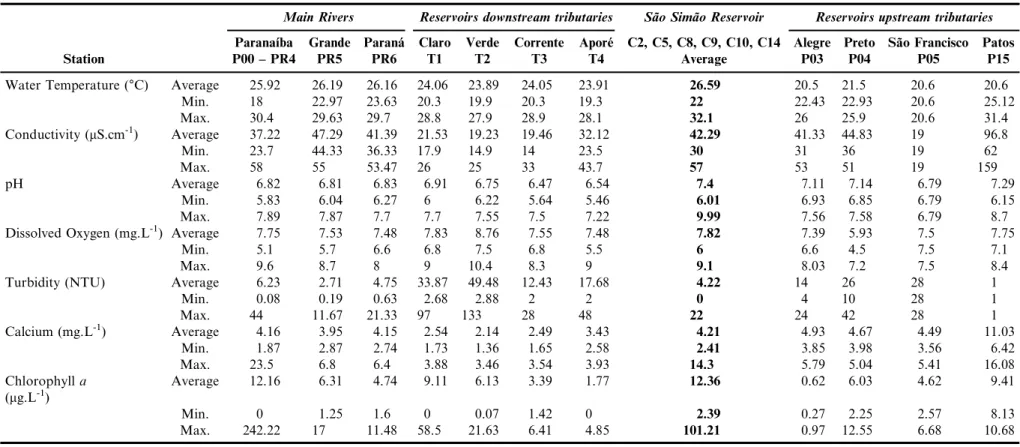
Table 1.Mean, minimum and maximum values of limnological variables from Sa˜o Sima˜o dam and tributaries upstream the dam, Paranaı´ba river and right bank tributaries, Grande and Parana´ Rivers.
Main Rivers Reservoirs downstream tributaries Sa˜o Sima˜o Reservoir Reservoirs upstream tributaries
Paranaı´ba Grande Parana´ Claro Verde Corrente Apore´ C2, C5, C8, C9, C10, C14 Alegre Preto Sa˜o Francisco Patos
Station P00 – PR4 PR5 PR6 T1 T2 T3 T4 Average P03 P04 P05 P15
Water Temperature (°C) Average 25.92 26.19 26.16 24.06 23.89 24.05 23.91 26.59 20.5 21.5 20.6 20.6
Min. 18 22.97 23.63 20.3 19.9 20.3 19.3 22 22.43 22.93 20.6 25.12
Max. 30.4 29.63 29.7 28.8 27.9 28.9 28.1 32.1 26 25.9 20.6 31.4
Conductivity (mS.cm-1) Average 37.22 47.29 41.39 21.53 19.23 19.46 32.12 42.29 41.33 44.83 19 96.8
Min. 23.7 44.33 36.33 17.9 14.9 14 23.5 30 31 36 19 62
Max. 58 55 53.47 26 25 33 43.7 57 53 51 19 159
pH Average 6.82 6.81 6.83 6.91 6.75 6.47 6.54 7.4 7.11 7.14 6.79 7.29
Min. 5.83 6.04 6.27 6 6.22 5.64 5.46 6.01 6.93 6.85 6.79 6.15
Max. 7.89 7.87 7.7 7.7 7.55 7.5 7.22 9.99 7.56 7.58 6.79 8.7
Dissolved Oxygen (mg.L-1) Average 7.75 7.53 7.48 7.83 8.76 7.55 7.48
7.82 7.39 5.93 7.5 7.75
Min. 5.1 5.7 6.6 6.8 7.5 6.8 5.5 6 6.6 4.5 7.5 7.1
Max. 9.6 8.7 8 9 10.4 8.3 9 9.1 8.03 7.2 7.5 8.4
Turbidity (NTU) Average 6.23 2.71 4.75 33.87 49.48 12.43 17.68 4.22 14 26 28 1
Min. 0.08 0.19 0.63 2.68 2.88 2 2 0 4 10 28 1
Max. 44 11.67 21.33 97 133 28 48 22 24 42 28 1
Calcium (mg.L-1) Average 4.16 3.95 4.15 2.54 2.14 2.49 3.43 4.21 4.93 4.67 4.49 11.03
Min. 1.87 2.87 2.74 1.73 1.36 1.65 2.58 2.41 3.85 3.98 3.56 6.42
Max. 23.5 6.8 6.4 3.88 3.46 3.54 3.93 14.3 5.79 5.04 5.41 16.08
Chlorophylla (mg.L-1)
Average 12.16 6.31 4.74 9.11 6.13 3.39 1.77 12.36 0.62 6.03 4.62 9.41
Min. 0 1.25 1.6 0 0.07 1.42 0 2.39 0.27 2.25 2.57 8.13
Max. 242.22 17 11.48 58.5 21.63 6.41 4.85 101.21 0.97 12.55 6.68 10.68
http
:/
/dx.
doi.o
rg/1
0.1
590
/1676
-061
1-B
N-2
014
-016
4
http
:/
/www
.sci
elo.
br/b
n
Bio
ta
N
eot
ro
p
.,
16(
1):
e201
401
6
4,
201
6
5
Im
p
o
rt
anc
e
o
f
S
h
ear
S
tre
2006). The AUC varies from 0 to 1, where 1 indicates high performance, while values lower than 0.5 indicate low performance (Luoto et al. 2005; Elith et al. 2006). In spite of recent criticisms (e.g., Lobo et al. 2008), AUC can still be useful comparing models of the same species in a similar geographical space. In this work, true records of absence were not considered, so the calculation of the AUC made use of the ‘‘background’’ data (also called pseudo-absences), chosen uniformly and randomly from the study area (Phillips et al 2006). Only the models that yielded an AUC value higher than 0.75 were considered in this study. Some measures were taken to minimize the limitations of the AUC as the use of true absences to validate the output scenarios and a good spatial distribution of the presence registers along of the study area.
Jackknife analysis was used to test the importance of the variables in the predictive ability of each model generated by Maxent.The Jackknife assessment excludes one variable at a time and recreates the model to determine the relative contribution of the predictor variable to the habitat suitability. It also considers each variable separately to determine whether it alone contributes significantly to the model.
Results
5.1 Limnological characterization of the environments in 2006/2007
The average larval densities were low in the Paranaı´ba (that includes stations P00-PR4), Grande (PR5) and Parana´ (PR6) rivers never exceeding 300 ind.m-3. A longitudinal distribution gradient was noticed, which increased significantly between upstream and downstream, from the PR2 station on the Paranaı´ba River, to its confluence. A large density of golden mussel larvae was found at the PR3 station, on the Paranaı´ba River (Kruskal-Wallis test: H ¼ 58.69 and p ¼ 0.0001) and downstream.
The surface waters yielded mean temperatures of 20-26°C with a range of 18.0-30.4°C (Table 1). The lowest average dissolved oxygen concentration corresponded to the tributaries located in the upstream portion of the dam of the hydroelectric plant of Sa˜o Sima˜o (F¼3.66 and p ¼ 0.013), although all
environments present themselves well oxygenated, measuring always above the average value of 5.0 mg.L-1. In general the conductivity was low, but varied significantly between envi-ronments (H¼94.80, p¼ 0.000). The average conductivity of
the reservoir’s downstream tributaries was smaller than that of the reservoir and its upstream tributaries. For the Paranaı´ba, Grande and Parana´ Rivers, the average conductivity was between 37.22mS.cm-1and 47.29
mS.cm-1, measuring higher in
the main rivers than in the downstream tributaries and lower than in the upstream tributaries of the Sa˜o Sima˜o reservoir. The maximum value recorded was 159 mS.cm-1 in the Patos River, where the presence of organic load was noticed.
The waters were more turbid in the upstream tributaries (average¼17.25 NTUs) and downstream tributaries (28.37
NTUs) than in the others environments (H¼36.17 and
p¼0,000). The highest turbidity values were found in the
Claro and Verde rivers, which correspond to typical lotic environments, with very expressive water speed and turbulence, resulting in high-energy segments (Figure 1). The turbidity in the Sa˜o Sima˜o reservoir and in the confluence of the Paranaı´ba, Grande and Paranı´ba Rivers was low (o6.23 NTUs).
Chlorophyllaconcentrations in the study area were usually high, with mean values varying from 1.77 to 12.16 mg.L-1. Chlorophyllavalues were higher in the Paranaı´ba River than in its right-margin affluents, reaching a maximum of 242.22mg.L-1,
probably, due to blooms. The mean values in the Paranaı´ba River varied around 12.22 mg.L-1 and were close to the mean values obtained for the reservoir. In tributaries and other rivers, the chlorophyll concentrations were never higher than 10mg.L-1.
However, differences between means were not statistically significant. In general, the environments downstream from the reservoir were more acid than upstream, but these differences were not statistically significant. The lowest pH recorded was 5.83. The average calcium (Ca) values were around 4.1 mg.L-1in the main rivers, the lowest being 1.8 mg.L-1 and the highest 23.5 mg.L-1. Mean Ca concentrations were lower in the
downstream tributaries than in the Paranaı´ba, Grande and Parana´ rivers (F¼7,66 and p¼ 0,000). Ca concentrations were
lower than 2.56 mg.L-1 in the Claro, Verde and Corrente tributaries and corresponded to 3.4 mg.L-1in the Apore´ River. In
the Sa˜o Sima˜o reservoir, the total mean Ca values were around 4.2 mg.L-1. The highest mean values were obtained from tributaries upstream from the reservoir, especially in the Patos River, where organic and industrial wastes are discharged.
In relation to the spatial distribution of the surface drainage energy (Figure 2), the segments of higher energy are the initial, lotic portion of the Sa˜o Sima˜o reservoir, its right-margin affluents (P03, P04 e P05) and the tributaries that flow to the Paranaı´ba River right margin, downstream from the reservoir (Claro River, T1, and Verde River, T2). The Paranaı´ba River channel is narrower and the water speed is higher up to station PR1, being highly energetic in this portion. From this point on, the Hack Index (SL) progressively decreases, indicating the enlargement of the Paranaı´ba River flooding area, which includes the backwater of the Ilha Solteira Dam, located downstream the confluence of the Parana´ and Paranaı´ba rivers.
5.2 L. fortunei’s potential distribution simulated by the MAXENT algorithm
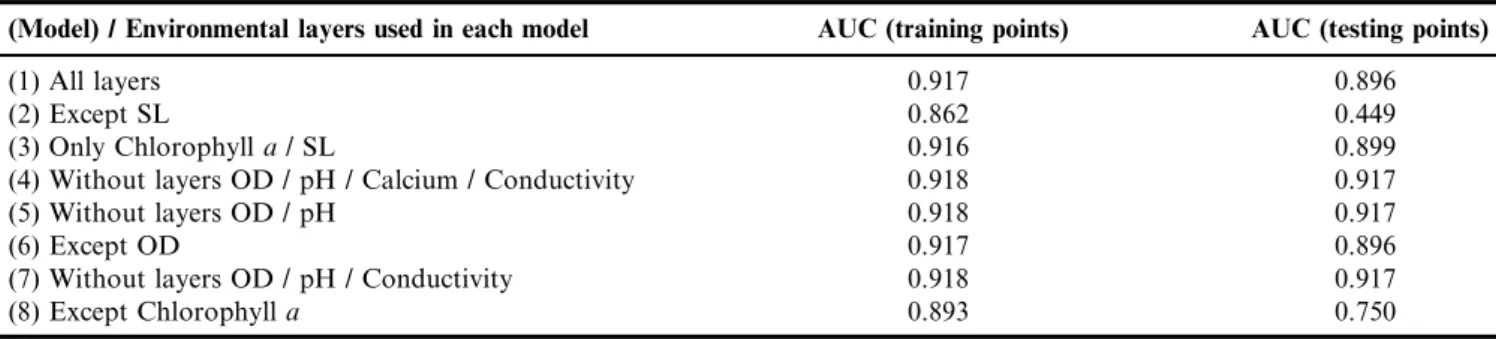
The parameters used to evaluate the models’ performance, generated by MAXENT, are recorded in Table 2, where it is possible to see a greater similarity between the responses for models 1, 3, 4, 5, 6, and 7, with very close AUC values for the training points. In relation to testing points, there was greater variation, and again, the lowest values were obtained from models 2 and 8.
Models 2 and 8 – which exclude SL and chlorophylladata respectively, were less accurate. Model 2 was the least efficient of all models, with AUC of 0.862 and 0.449 for training and testing points respectively, followed by model 8, which yielded AUC of 0.893 and 0.750 for training and testing points respectively.
for the same period. The reservoir area not yet invaded, corresponding to the stretches of points C08 and C10, was also considered highly vulnerable to invasion by the mussel. Other areas not colonized by the species showed a low risk of colonization: the Alegre, Preto and Sa˜o Francisco Rivers (points P03, P04 and P05), upstream from the Sa˜o Sima˜o dam, or even rivers downstream of the reservoir, such as the Claro, Verde and Corrente Rivers (points T1, T2 and T3). In the Apore´ River (T4) the invasion risk was medium and the probability of the species to occur tended to increase towards the confluence with the Paranaı´ba River, which is in accord with the records obtained in 2006 and 2007 and presented in Figure 1.
The L. fortunei potential distribution simulated by the MAXENT adopting model 1 showed a good adjustment with the observed data (Figure 3A): the areas where the probability of the mollusc occurrence is low in great part coincide spatially with the points of true absences confirmed by field checks.
In contrast, the spatial distribution simulated by model 2 showed that, when the variable SL is excluded from the niche
modeling (Figure3B), most of the points where there are no records of the species corresponded spatially to areas of high probability of the mussel occurrence. These areas included not only the confluence of the Paranaı´ba and Grande rivers and the adjacent 80 km mentioned earlier, but also the whole segment from the ‘‘absence point’’ PR1 to the ‘‘absence point’’ C05 (including ‘‘absence points’’ P00, PB031, C02, C14, and C05) and the segments downstream from ‘‘absence points’’ P15 and P03; C08 and C10. Therefore, excluding SL from the list of variables that compose theL. fortuneiniche, there was a clear decrease in the efficiency of the model to predict its real distribution area (AUC for training points is 0.862 and AUC for testing points is 0.449) and an inconsistency of simulated with actual absence data.
Figure 3C shows the potential distribution generated by model 8, which uses all environmental layers except chlorophyll
a. The areas most vulnerable to an L. fortuneiinvasion were those which correspond to the segment from the mouth of the Paranaı´ba River to approximately 120 km upstream and
Figure 2. Spatial distribution of the surface drainage energy – from the Hack index – SL, interpolated by kriging.
Table 2.Parameters to assess the accuracy of the models of potential distribution generated by Maxent
(Model) / Environmental layers used in each model AUC (training points) AUC (testing points)
(1) All layers 0.917 0.896
(2) Except SL 0.862 0.449
(3) Only Chlorophylla/ SL 0.916 0.899
(4) Without layers OD / pH / Calcium / Conductivity 0.918 0.917
(5) Without layers OD / pH 0.918 0.917
(6) Except OD 0.917 0.896
(7) Without layers OD / pH / Conductivity 0.918 0.917
(8) Except Chlorophylla 0.893 0.750
http://dx.doi.org/10.1590/1676-0611-BN-2014-0164 http://www.scielo.br/bn
Biota Neotrop., 16(1): e20140164, 2016 7
segments downstream, including ‘‘absence points’’ T3 (Cor-rente River) and T4 (Verde River). The segment downstream from ‘‘absence points’’ C08, C10 and C09 was also prone to invasion. AUC for training points is 0.893 and for testing points is 0.750. The exclusion of the chlorophyllavariable led to a niche model with a better performance than model 2, which excluded SL, and a worse performance than model 1, which included all physical-chemical variables, in particular the hydrological variable SL.
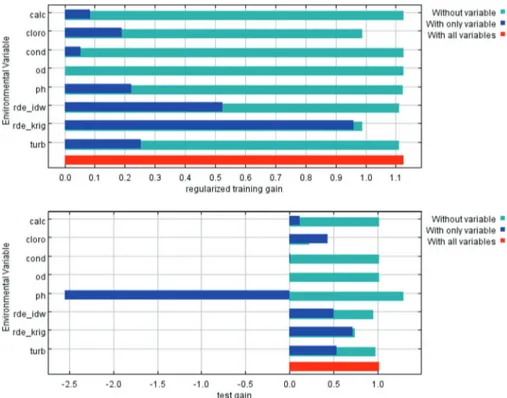
The analysis of the results of the Jackknife test, which evaluates the isolated contribution of the environmental layers in the training and testing rounds of model 1 (Figure 4), shows that SL was the environmental layer that individually contributed the most for the construction of the niche model and for good evaluation (largest ‘‘gain’’). From the training data, when the SL and chlorophyllavariables were omitted, a decrease in the efficiency of the model was observed. A variable that decreases the efficiency of the model quality tests was pH (excluding pH, the ‘‘gain’’ of the testing data was negative), whereas dissolved oxygen and conductivity did not seem to contribute or even to disturb the construction of the model. Calcium was less important when compared to the other variables (turbidity, chlorophyllaand SL).
Discussion
In 2004,L. fortuneiwas detected in Porto Alencastro (PR3), located less than 120 km downstream from the Sa˜o Sima˜o reservoir (Campos et al. 2012). Considering that the speed of invasion upstream along the Rio de la Plata averaged 240 km/ year (Darrigran & Drago 2000), we can consider that the advance of the species is decelerated in this portion of the Paranaı´ba River, even with the continuous traffic of vessels that dock in the port downstream from the Sa˜o Sima˜o reservoir and bring the mussels attached to their hulls. Which factors could then explain the dissimilarL. fortuneioccupation pattern in this segment of the river and in the reservoir – in other words, which factors are limiting the establishment of the mussel in these parts where it does not occur? According to Sobero´n & Peterson (2005) and Sobero´ n (2007), the establishment of an invading species is represented by the intersection of three components: adequate environmental conditions, favorable biotic interactions, and accessibility to the new region. Along the whole segment of the Paranaı´ba River downstream from the Sa˜o Sima˜o Reservoir, the lack of dispersion vectors from the colonized to the non-colonized areas could not be considered as a negative factor to the establishment of the golden mussel, considering the constant
traffic of vessels coming from infested areas. A second filter relates to biological interactions, which were also considered less important, because in the areas further downstream from the same fluvial segment, the population densities of the invading bivalve are high, exceeding possible limitations regarding the availability of food or other negative interactions, such as parasites, competitors or even predators. Thus, unfavorable environmental conditions would be one of the most important
filters in the conformation of the actual or potential spatial distributions.
Different physical-chemical aspects of the water were con-sidered when generating niche models during this study (i.e.,pH, dissolved oxygen, calcium, conductivity, chlorophyll a and turbidity), which have already been indicated by other researchers as determining factors for a causal relationship of the invading bivalve occurrence records (Oliveira et al 2010a, b). For instance,
Figure 4.Results of Jackknife evaluations of relative importance of predictor variables (training data above and test below): pH, dissolved oxygen (DO), chlorophylla(cloro) , turbidity (turb), conductivity (cond), calcium (calc) and Rde_idw and Rde_krig ( note: different methods to interpolate the SL layer).
Figure 5.Golden mussel occurrence points along the Paranaı´ba River, upstream and downstream from the Sa˜o Sima˜o reservoir (MG/GO), Upper Parana´ River Basin obtained during the period from 2012 to 2014. (data unpublished from ECOGERAES Consultoria Ambiental).
http://dx.doi.org/10.1590/1676-0611-BN-2014-0164 http://www.scielo.br/bn
Biota Neotrop., 16(1): e20140164, 2016 9
some studies indicate a pH value45.0 as favorable for the species survival (Ricciardi 1998, Montalto & Marchese 2003, Karatayev et al. 2007). For calcium, minimum values for the survival of adult mussels in natural waters range between 1 and 3 mg/L (Ricciardi 1998).
Considering the limnological environmental characterization, the great part of variables presented similar and suitable average values to allow the survival of the mussel in the study area: oxygen values were generally high, and either the pH as the chlorophyll
alevels, for the great majority of the situations, would not cons-titute a limiting aspect to the species’ survival. Just the turbidity and the calcium concentrations showed a significative spatial variation between invaded and uninvaded environments (Table 1). However, the lowest Ca concentration, found in one of the down-stream tributaries, was close to 1.36 mg.L-1meeting the minimum
limits required for the species survival.
In turn, the highest values of turbidity occurred in the tributaries, upstream from the dam (P03, P04 e P05) or downstream (Claro River, T1, and Verde River, T2) and all of them corresponded to uninvaded river stretches as well as the segments of highest energy (high SL Index, high shear stress). Therefore, the aspects related to the energy and sediment transport of the fluvial environments appeared as the primary factors to explain the spatial heterogeneity and possible different levels of habitat suitability. In addition, differences in hydrodynamic aspects between invaded and uninvaded environments would be more relevant to determine the susceptibility to the establishment of the species than pH, calcium, chlorophyll, and others (Neary & Leach 1992, Ramcharam et al. 1992, Mellina & Rasmussen 1994).
This trend also appeared in the simulations generated by MAXENT. Three clear patterns for the L. fortunei potential distribution models were obtained: (1) models generated with the inclusion of environmental layers SL and chlorophyll a
(independent from the other variables); (2) models generated excluding the environmental layer SL; (3) models generated excluding environmental layers SL and chlorophylla.
The highest statistical accuracy values were obtained from models included in pattern (1) whose predictions coincided with the distribution of validation points. The models included in pattern (2) - models generated excluding environmental layer SL, yielded low statistical accuracy values in a broad sense (training and testing data), especially in the intermediate lotic portion, not coinciding with the points of real absence of the invading species. The models of pattern (3) - excluding SL and chlorophylla, yielded the lowest statistical accuracy values and conflicted with the points of absence of the species.
These observations, plus the Jackknife analysis generated by MAXENT, led us to qualitatively rank the environmental layers according to their importance in predicting the potential distribution ofL. fortuneiin the lower Paranaı´ba River: SL4
Chlorophylla4Turbidity4Calcium4Dissolved Oxygen ¼
Conductivity4 pH. Strictly speaking, SL was the variable that contributed the most to the efficiency of the constructed models.
Such ranking, allied to the environmental characterization, indicates that the shear strength (SL) or energy of the river waters could be the key factor related to theL. fortuneispatial distribution in the study area, while the other variables would be less influential in the golden mussel distribution, at least in the spatial scale considered.
A validation of these simulations results could also be done by observing the real spatial distribution ofL. fortuneiobtained later, from 2012 to 2014. As the Figure 5 shows, the most
recent distribution area of the invasive mussel is quite similar to that simulated with data from 2006-2007. This indicates that the environmental conditions did not change expressively, and that the hydrodynamic is the key factor to force the spatial pattern until the present.
The importance of the hydrodynamic aspects for the environmental suitability of bivalve species has been pointed out in the literature. Clarke & McMahon (1996) investigated the effect of the water speed on the production of byssus filaments in adult zebra mussels (D. polymorpha), which are invading species with ecological characteristics similar to those of the golden mussel, and observed that the water flow eliminated the byssus production, which could be associated with the mechanical perturbation of the adhered mussels and influence on the ability to press the foot against the substrate to consolidate the filament. Another direct relationship can occur between the river energy and the strength to drag the planktonic larval stages, or the interference of the flow strength in larvae mortality. According to Horvath & Lamberti (1999), zebra mussel veliger larvae seem to be highly susceptible to damage caused by physical strength such as shearing and consequently larvae mortality in turbulent flows could be an important mechanism to limit the dispersion of the zebra mussel downstream. The veliger larvae can be particularly sensitive to the breakage of the valves while feeding, because the valves must be open to allow food particles to enter the gills (Sprung 1993). An open shell can expose a larger surface and tissue area, being more susceptible to shearing.
The physical-chemical characteristics of the water in the region of the upper Parana´ River – also the lower Paranaı´ba River – are generally adequate to the establishment of the invading species and therefore responded in a less important manner to the composition of the ecological niche models that best adjusted to the present spatial distribution of the species in the study area.
Furthermore, in its native area, the Pearl River (Zhujiang),
L. fortuneiis present in pH ranges of 6.9 - 8.4 and calcium concentrations of 5.0-65.2mg.L-1, (values taken in 75 hydro-logical stations in the Zhujiang for the period of 1958–2002, according Zhang et al. 2007). The limnological aspects from Sa˜o Sima˜o dam and tributaries upstream the dam, Paranaı´ba river and right bank tributaries, Grande and Parana´ Rivers, when compared to the values of limnological variables from Pearl River, suggest thatL. fortuneican withstand lower limits of pH and calcium than those for Asian environments. This information shows that the invaded niche is not contemplated in the native niche and indicates a greater invasiveness of this species and its potential area of dispersion.
On the other hand, the competence of the fluvial channels translated by the Hack Index proved to be an important component to describe the environmental suitability to the invadingL. fortunei.
degree of habitat suitability especially in some of its branches. Most likely, the invasion has not yet happened due to low pressure propagules (Campos et al 2012) that reach the reservoir. All these tools indicate that the invasion of this new environment will be a question of time and therefore, the intensification of preventive measures should be undertaken immediately.
Acknowledgments
This work was supported by the Electric Power Company of Minas Gerais - Cemig, the Ageˆncia Nacional de Energia Ele´trica - ANEEL and the Program for Crustal Evolution and Natural Resources, Federal University of Ouro Preto, which granted a doctoral thesis, related to this work. The authors acknowledge Pedro Fialho for his assistance with the ARC GIS and two anonymous reviewers for their helpful suggestions.
References
ANDERSON, R.P., LEW, D. & PETERSON, E.A.T. 2003. Evaluat-ing predictive models of species’ distributions: criteria for selectEvaluat-ing optimal models. Ecol. Model. 162:211–232, http://dx.doi.org/ 10.1016/S0304-3800(02)00349-6.
BATHURST, J.C. 1982. Distribution of boundary shear stress in riv-ers. In Adjustments of the Fluvial System, D.D. (Rhodes and G.P Williams, eds.) Allen and Unwin, London, p. 95-116.
BENDA, L.N., POFF, L., MILLER, D., DUNNE, T., REEVES, G., PESS, G., & POLLOCK, M. 2004. The network dynamic hypothesis: how channel networks structure riverine habitats. BioScience 54:413–427, http://dx.doi.org/10.1641/0006-3568(2004) 054[0413:TNDHHC]2.0.CO;2.
BEST, J.L. 1986. The morphology of river channel confluences. Pro-gress in Physical Geography 10:157–174,http://dx.doi.org/10.1177/ 030913338601000201.
BOSSENBROEK, J.M., JOHNSON, L.E., PETERS, B. & LODGE, D.M. 2007. Forecasting the expansion of zebra mussels in the United States. Conserv. Biol. 21:800–810, http://dx.doi.org/ 10.1111/j.1523-1739.2006.00614.x.
CAMPOS, M.C.S., ANDRADE A.F.A., KUNZMANN B.,
GALVA˜ O D.D., SILVA F.A., CARDOSO A.V., CARVALHO M.D., MOTA H.R. 2014. Modelling of the potential distribution ofLimnoperna fortunei(Dunker, 1857) on a global scale. Aquatic Invasions 9:253–265,http://dx.doi.org/10.3391/ai.2014.9.3.03.
CAMPOS, M.C.S., LANZER R. & CASTRO P.T. 2012. Hydrological stress as a limiting factor of the invasion ofLimnoperna fortunei(Dunker, 1857) in the Upper Parana´ River (Brazil). Acta Limnol. Brasil., 24 (1): 64–82,http://dx.doi.org/10.1590/S2179-975X2012005000027.
CHASE, J.M. & LEIBOLD, M.A. 2003. Ecological Niches: Linking Classical and Contemporary Approaches. University of Chicago Press, Chicago.
CHRISTOFOLETTI, A. 1981. Geomorfologia fluvial: o canal fluvial. Sa˜o Paulo: Edgard Blu¨cher.
CLARK, M. & McMAHON, R.F. 1996b. Effects of current velocity on byssal – threats production in the zebra mussel (Dreissena polymorpha) Can. J. Zool. v.74, p.63–69.
CLAUDI, R. & MACKIE, G. 1994. Practical Manual for Zebra Mussel Monitoring and Control. Lewis Publishers.
DARRIGRAN, G. & DRAGO, E. 2000. Distribucion deLimnoperna fortunei(Dunker, 1857) (Mytilidae), en la Cuenca del plata, Region Neotropical. Medio Ambiente 13(2):75–79.
DARRIGRAN, G. & PASTORINO, G. 1995. The recent introduction of Asiatic Bivalve, Limnoperna fortunei (Mytilidae) into South America. The Veliger 38 (2):183–187.
DRAKE, J.M. & BOSSENBROEK, E.J.M. 2004. The potential distribu-tion of zebra mussels in the United States. BioScience 54:931–941,http:// dx.doi.org/10.1641/0006-3568(2004)054[0931:TPDOZM]2.0.CO;2.
EPA - United States Environmental Protection Agency. Water: Habi-tat Protection http://water.epa.gov/type/oceb/habiHabi-tat/invasive_spe- http://water.epa.gov/type/oceb/habitat/invasive_spe-cies_index.cfm last access at 10/15/2013.
ELITH J., GRAHAM C.H. 2006. Novel methods improve prediction of species’ distributions from occurrence data.Ecography29:129–151,
http://dx.doi.org/10.1111/j.2006.0906-7590.04596.x.
ETCHEBEHERE, M.L.C., SAAD, A.R., SANTONI, G., CASADO, F.C. & FULFARO, V.J. 2006. Detecc¸a˜o de prova´veis deformac¸o˜es neo-tectoˆnicas no vale do rio do Peixe, Regia˜o Ocidental Paulista, mediante aplicac¸a˜o de ı´ndices RDE (Relac¸a˜o Declividade-Extensa˜o) em segmen-tos de drenagem. Revista UNESP – Geocieˆncias. 25(3):271–287. ETCHEBEHERE, M.L.C., SAAD, A.R., PERINOTTO, J.A.J. &
FULFARO, V.J. 2004. Aplicac¸a˜o do I´ndice ‘‘Relac¸a˜o Declividade-Extensa˜o - RDE’’ na Bacia do Rio do Peixe (SP) para detecc¸a˜o de deformac¸o˜es neotectoˆnicas, Revista do Instituto de Geocieˆncias da USP - Se´rie Cientı´fica 4(2):43–56, http://dx.doi.org/10.5327/S1519-874X2004000200004.
GALLIEN, L., DOUZET, R., PRATTE, S., ZIMMERMANN, N.E., & THUILLER, W. 2012. Invasive species distribution models -how violating the equilibrium assumption can create new insights. Global Ecol. Biogeogr 21:1126–1136, http://dx.doi.org/10.1111/ j.1466-8238.2012.00768.x.
HACK, J.T. 1957. Studies of longitudinal stream profiles in Virginia and Maryland. U.S. Geol. Survey Prof. Paper 294-B, p. 45–97. HACK, J.T. & YOUNG, R.S. 1959. Entrenched meanders of the
North Fork of the Shenandoah River, Virginia. U.S. Geol. Survey Prof. Paper 354-A, 10 p.
HACK, J.T. 1973. Stream-profile analysis and stream-gradient index. J. Res. Us. Geol. 1(4):421–429.
HINCKS, S.S. & MACKIE, G.L. 1997. Effects of pH, calcium, alka-linity, hardness, and chlorophyll on the survival, growth, and reproductive success of zebra mussel (Dreissena polymorpha) in Ontario lakes. Canadian Journal of Fisheries and Aquatic Sciences, Ottawa, 54:2049–57,http://dx.doi.org/10.1139/f97-114.
HORVATH, T.G. & LAMBERTI, G.A. 1999. Mortality of zebra mussel, Dreissena polymorpha, veligersduring downstream transport. Fresh. Biol. 42:69–76,http://dx.doi.org/10.1046/j.1365-2427.1999.00462.x.
HUTCHINSON, G.E., 1957. Concluding remarks. Cold Spring Harb Symp Quant Biol 22:415–427.
IGUCHI, K., MATSUURA, K., MCNYSET, M., PETERSON, A.T., SCACHETTI-PEREIRA, R., POWERS, K., VIEGLAIS, D., WILEY, E.O. & YODO, E.T. 2004. Predicting Invasions of North American Basses in Japan Using Native Range Data and a Genetic Algorithm. T. Am. Fish. Soc. 133:845–854.
KARATAYEV, A.Y., PADILLA, D.K., MINCHIN D., BOLTOVS-KOY, D. & BURLAKOVA, L. 2007. Changes in global economy and trade: the potential spread of exotic freshwater bivalves. Biol. Invasions 9:161–180,http://dx.doi.org/10.1007/s10530-006-9013-9.
KARATAYEV, A.Y., MASTITSKY, S.E., BURLAKOVA, L.E. & OLENIN S. 2008. Past, current and future of the central European corridor for aquatic invasions in Belarus. Biol. Invasions 10:215– 232,http://dx.doi.org/10.1007/s10530-007-9124-y.
KOUTNIK, M.A., PADILLA, D.K. 1994. Predicting the spatial dis-tribution of Dreissena polymorpha (zebra mussel) among inland lakes of Wisconsin: Modeling with a GIS. Can. J. Fish. Aquat. Sci. 51:1189–1196,http://dx.doi.org/10.1139/f94-118.
KLUZA, D.A. & MCNYSET, M. 2005 Ecological niche modeling of aquatic invasive species. Aquatic Invaders 16(1):1–7.
LEOPOLD, L.B. & LANGBEIN, W.B. 1964. Fluvial processes in geomorphology in San Francisco, W. H. Freeman.
LOBO, J.M., JIME´ NEZ-VALVERDE, A., REAL, R. 2008. AUC: A misleading measure of the performance of predictive distribution models.Global Ecology and Biogeography 17:145–151,http://dx.doi. org/10.1111/j.1466-8238.2007.00358.x.
LUOTO, M., POYRY J., HEIKKINEN R.K., SAARINEN K. 2005. Uncertainty of bioclimate envelope models based on the geo-graphical distribution of species.Global Ecology and Biogeography 14:575–584,http://dx.doi.org/10.1111/j.1466-822X.2005.00186.x.
http://dx.doi.org/10.1590/1676-0611-BN-2014-0164 http://www.scielo.br/bn
Biota Neotrop., 16(1): e20140164, 2016 11
MAC MAHON, R.F. 1996. The physiological ecology of the zebra mussel,Dreissena polymorpha, in North America and Europe. Am. Zool. 36:339–363.
MACK, R.N., SIMBERLOFF, D., LONSDALE, W.M., HARRY E., CLOUT, M., & BAZZAZ F.A. 2000 Biotic Invasions: Causes, Epidemiology, Global Consequences, And Control, Ecol. Appl. 10 (3):689–710, http://dx.doi.org/10.1890/1051-0761(2000)010[0689: BICEGC]2.0.CO;2.
MANEL, S., WILLIAMS, H.C., ORMEROD, S.J. 2001. Evaluating presence-absence models in ecology: the need to account for pre-valence.Journal of Applied Ecology38:921–931,http://dx.doi.org/ 10.1046/j.1365-2664.2001.00647.x.
MCNYSET, K.M. 2005. Use of ecological niche modelling to predict distributions of freshwater fish species in Kansas. Ecol. Freshw. Fish. 14:243–255,http://dx.doi.org/10.1111/j.1600-0633.2005.00101.x.
MELLINA, E. & RASMUSSEN, J.B. 1994. Patterns in the distribu-tion and abundance of zebra mussel (Dreissena polymorpha) in rivers and lakes in relation to substrate and other physicochemical factors. Can. J. Fish. Aquat. Sci v. 51:1024–1036.
MONTALTO, L. & MARCHESE, M. 2003. Limnoperna fortunei (Dunker, 1857) (Bivalvia, Mytilidae) tolerance to chlorine, pH and temperature in experimental conditions. Neotropica. 49:26–34. MORTON, B. 1973. Some aspects of the biology and functional
morphology of the organs of feeding and digestion ofLimnoperna fortunei(Dunker) (Bivalvia: Mytilacea). Malacologia. 12:265–281. MORTON, B. 1975. The colonization of Hong Kong’s raw water supply system by Limnoperna fortunei (Dunker 1857) (Bivalvia: Mytilacea) from China. Malacological Review. 8(1-2):91–106.MORTON, B. 1997. The Aquatic nuisance species problem: a global perspective and review. In Zebra mussels and aquatic nuisance species, (F. M. D’Itri eds), Ann Arbor Press, Chelsea, MI Chp.1, p. 1–54.
NEARY, B.P. & LEACH, J.H. 1992. Mapping the potential spread of the zebra mussel (Dreissena polymorpha) in Ontario. Can. Fish. and Aquat. Sci. 49:406–415,http://dx.doi.org/10.1139/F08-099.
OLIVEIRA, M.D., HAMILTON, S.K., CALHEIROS, D.F., JACOBI, C.M. & LATINI, R.O. 2010a. Modeling the potential distribution of the invasive golden musselLimnoperna fortuneiin the Upper Para-guay River system using limnological variables, Braz. J. Biol. 70 (3): 831–840,http://dx.doi.org/10.1590/S1519-69842010000400014.
OLIVEIRA, M.D., HAMILTON, S.K. & JACOBI, C.M., 2010b. Forecasting the expansion of the invasive golden mussel Limno-perna fortuneiin Brazilian and North American rivers based on its occurrence in the Paraguay River and Pantanal wetland of Brazil. Aquatic Invasions 5:59–73.
PARESCHI, D.C., MATSUMURA-TUNDISI T., MEDEIROS G.R., LUIZA A.P. & TUNDISI J.G. 2008. First occurrence of Limno-perna fortunei (Dunker, 1857) in the Rio Tieteˆ watershed (Sa˜o Paulo State, Brasil). Braz. J. Biol. 68(4):1107–1114.
PASTORINO, G., DARRIGRAN, G., MARTIN, S. & LUNASCHI, L. 1993. Limnoperna fortunei (Dunker, 1857) (Mytilidae), nuevo bivalvo em a´guas del Rio de La Plata. Neotropica 39 (101–102):171. PETERSON, A.T. & VIEGLAIS, E.D.A. 2001. Predicting species invasions using ecological niche modeling: New approaches from bioinformatics attack a pressing problem. BioScience 51:363–371,
http://dx.doi.org/10.1641/0006-3568(2001)051[0363:PSIUEN]2.0. CO;2.
PETERSON, A.T. 2001. Predicting species’ geographic distributions based on ecological niche modeling. Condor 103:599–605,http:// dx.doi.org/10.1650/0010-5422(2001)103[0599:PSGDBO]2.0.CO;2.
PHILLIPS, S.J., ANDERSON, R.P. & SCHAPIRE, R.E. 2006. Maximum entropy modeling of species geographic distributions Ecol. Model. 190:231–259,http://dx.doi.org/10.1016/j.ecolmodel.2005.03.026.
PHILLIPS, S.J., DUDIK, M. & SCHAPIRE, R.E. 2004. A maximum entropy approach to species distribution modeling. In Proceedings of the 21st International Conference on Machine Learning, ACM Press, New York, p. 655–662,http://dx.doi.org/10.1145/1015330.1015412.
POWER, M.E., MARKS, J.C., PARKER & E.M.S. 1992. Variation in the Vulnerability of Prey to Different Predators - Community-Level Consequences. Ecology. 73:2218–2223, http://dx.doi.org/ 10.2307/1941469.
RAMCHARAN, C.W., PADILLA, D.K. & DODSON, S.I. 1992. Models to predict potential occurrence and density of the zebra mussel,Dreissena polymorpha.Can. J. Fish. Aquat. Sci. 49:2611– 2620,http://dx.doi.org/10.1139/f92-289.
RICCIARDI, A. 1998. Global range expansion of the Asian mussel Limnoperna fortunei(Mytilidae): another fouling threat to fresh-water systems. Biofouling, 13 (2):97–106,http://dx.doi.org/10.1080/ 08927019809378374.
RICCIARDI, A.H. & MAC ISAAC, H. 2000. Recent mass invasion of the North American Great Lakes by Ponto-Caspian species. Trends Ecol. Evol. 15:62–65,http://dx.doi.org/10.1016/S0169-5347 (99)01745-0.
SALA, O.E., CHAPIN III, F.S., ARMESTO, J.J., BERLOW, E., BLOOMFIELD, J., DRZO, R., HUBER-SANWALD, E., HUENNEKE, L.F., JACKSON, R.B., KINZIG, A., LEEMANS, R., LODGE, D.M., MOONEY, OESTERHELD, M., POFF, N.L., SYKES, M.T., WALKER, B.H., WALKER, M. & WALL, E.D.H. 2000. Global Biodiversity Scenarios for the Year 2100. Science, 287:1770–1774,http://dx.doi.org/10.1126/science.287.5459.1770.
SIEGEL, S. & CASTELLAN N.J. 1988. Nonparametric statistics for the behavioral sciences. New York, NY: McGraw-Hill.
SOBERO´ N, J. 2007. Grinnellian and Eltonian niches and geographic distributions of species. Ecology Letters, 10:1115–1123 doi: 10.1111/j.1461-0248.2007.01107.x, http://dx.doi.org/10.1111/j.1461-0248.2007.01107.x..
SOBERO´ N, J. & PETERSON A.T. 2005. Interpretation of models of fundamental ecological niches and speciesdistributional area. Bio-divers Inf 2:1–10,http://dx.doi.org/10.17161/bi.v2i0.4.
SPRUNG, M. 1993. The other life: An account of present knowledge of the larval phase of Dreissena polymorpha. In Zebra mussels. Biology, impacts and control (T. F. Napela and D. W. Schloesser, eds.), Lewis Publishers, Boca Raton Chap. 2, p. 39–53.
STOCKWELL, D.R.B. & PETERSON, A.T. 2002. Effects of sample size on accuracy of species distribution models. Ecol. Model. 148, 1–13,http://dx.doi.org/10.1016/S0304-3800(01)00388-X.
STRAYER, D.L. 1991. Projected distribution of the zebra mussel, Dreissena polymorpha,in North America. Can. J. Fish. Aquat. Sci. v.48 p.1389–1395,http://dx.doi.org/10.1139/cjfas-2015-0064.
SYLVESTER, F., DORADO, J., BOLTOVSKOY, D., JUA´ REZ, A. & CATALDO, D. 2004. Filtration rates of the invasive pest bivalve Limnoperna fortuneias a function of size and temperature. Hidro-biologia 534:71–80,http://dx.doi.org/10.1007/s10750-004-1322-3.
WILLIAMSON, M. 1996. Biological Invasions. Chapman and Hall, London.
ZHANG, S.R., LU, X.X., HIGGITT, D.L. et al. 2007.Water chemistry of the Zhujiang (Pearl River): natural processes and anthro-pogenic influences. J Geophys Res Earth Surf 112:1–17 123,http:// dx.doi.org/10.1029/2006JF000493.