Article
0103 - 5053 $6.00+0.00
*e-mail: [email protected]
Concentration of Airbone Trace Metals in a Bus Station with a
High Heavy-Duty Diesel Fraction
Josiane Loyola,
aGraciela Arbilla,*
,aSimone Lorena Quiterio,
a,bViviane Escaleira
cand Alfredo Victor Bellido
daDepartamento de Físico-Química, Universidade Federal do Rio de Janeiro, Centro de Tecnologia, Prédio A, Sala 408,
Cidade Universitária, 21949-900 Rio de Janeiro-RJ, Brazil
bCentro Federal de Educação Tecnológica de Química de Nilópolis, Unidade Maracanã, Rua Senador Furtado, 121,
Maracanã, 20270-020 Rio de Janeiro-RJ, Brazil
cCentro Nacional da Pesquisa do Solo, EMBRAPA, Rua Jardim Botânico 1024, 22460-000 Rio de Janeiro-RJ, Brazil
dPrograma de Pós Graduação em Geoquímica Ambiental-IQ-Universidade Federal Fluminense Prédio da Química,
5ºandar, Valonguinho, 24020-150 Niterói-RJ, Brazil
Amostras de material particulado total (MPT) e MP10 foram coletadas numa estação de ônibus, no período de agosto de 2006 a fevereiro de 2007. Na área, as únicas fontes importantes de emissão de poluentes são os ônibus, já que os veículos leves representam apenas 1-2% do fluxo total e não são desenvolvidas outras atividades no local. As concentrações de metais foram determinadas por espectroscopia de emissão por plasma indutivamente acoplado (ICP-OES). Os metais mais abundantes foram Ca, Mg, Fe e Al, que correspondem a 50,1%; 24,2%; 6,5% e 18,7%, respectivamente, do conteúdo metálico. O Co, Ni, Cd, Cr e Pb foram encontrados em níveis inferiores ao seu limite de detecção, exceto para algumas poucas amostras. Os fatores de enriquecimento calculados, mostram que o Zn e o Cu são devidos provavelmente à composição do combustível e do óleo lubrificante. O Ca, Mg e Al podem ser atribuídos à resuspensão de poeira, enquanto que o Fe pode ser devido tanto à ressuspensão de poeira como as emissões dos veículos.
Total particulate matter (TSP) and PM10samples were collected in a bus station, in the period of August 2006 to February 2007. Buses are the only significant emission sources in this area once light duty vehicles represent about 1-2% of total flux and no other activities are developed in the location. Concentrations of metals in the samples were determined by inductively coupled plasma optical emission spectroscopy (ICP-OES). Ca, Mg, Fe and Al were the most abundant elements and accounted for about 50.1%, 24.2%, 6.5% and 18.7% of the total metal content. Co, Ni, Cd, Cr and Pb were under detection limits except for a few samples. Calculated enrichment factors show that Zn and Cu are probably due to fuel and oil composition. Ca, Mg and Al may be attributed to dust resuspension while Fe may be due to both dust resuspension and contribution of vehicles.
Keywords: airborne particulate matter, PM10, trace metal, diesel emissions
Introduction
Heavy-duty diesel vehicles contribute significantly to air pollution in urban areas. Previous studies conducted by the California Resources Board estimated that, for instance, heavy-duty vehicles account for nearly 80% of particulate
matter (PM) in California.1
In Brazil, the government regulatory agencies have estimated mobile source emissions for several urban areas. The Metropolitan Area of São Paulo has the largest running fleet in Brazil: roughly 7.3 million passenger cars and commercial vehicles being composed of approximately
6% of diesel vehicles.2 In this region, mobile sources
are responsible for about 40% of inhalable particulate
matter emissions (14,000 t year-1 due to diesel engines,
4,900 t year-1 due to light-duty vehicles and 9,100 t year-1
reactions, i.e., gas-to-particle conversion, condensation
and coagulation, which contribute with 25% of local PM10
emissions. Resuspension of soil and dust generates 25% of these particles while 10% is attributable to industrial
sources.3 The Metropolitan Area of Rio de Janeiro has
the second largest running fleet, with nearly 1.5 million vehicles and about 12% heavy-duty vehicles (mainly buses
and trucks) running on diesel.4 According to the most recent
available official emission inventory,5 approximately 76%
of the total air pollution load of CO, SO2, NOXand PM10
are direct contributions of mobile sources.
Diesel particulate matter consists of an elemental carbon core with a large number of adsorbed substances, such as several organic compounds, sulfates, nitrogen derivatives and metals. The particle size distribution and chemical composition is highly dependable on composition of fuel and lubricating oil, emission control technology, engine type, operating conditions and traffic jams. The properties
of Brazilian diesel are presented in Table 1.6 No analysis
of metal content is required and, to our knowledge, there is no information available in the literature.
National legislation determines the maximum tolerable emissions of diesel vehicles. For new motors, emissions of particulate matter in a current dynamometer test
should be less than 0.10 g kW h-1.7 National standards
of air quality only determine limits for total particulate
matter (240 ng m-3 for 24 h and 80 ng m-3 for the annual
geometrical mean) and PM10 (150 ng m-3 for 24 h and
50 ng m-3 for the annual mathematical mean). However,
no legislation and no control are done regarding fine
particles (PM2.5). Literature data obtained for Brazilian
cities mainly deals with total suspended particles (TSP)
and PM10. Recently, Miranda and Andrade3 determined
the main characteristics of particles released into the atmosphere of the city of São Paulo, using a micro-orifice uniform deposit impactor (MOUDI). According to this study, soil-derived elements appeared in the coarse fractions obtained with the impactor, whereas sulfur and black carbon, the latter derived from diesel emissions, were predominant in the fine fraction. Certainly, more studies to assess particulate matter distribution and composition, focused on the fine mode, are necessary.
Several studies have discussed the toxicological effects
associated with particle-bound trace metals.8,9 The size
distribution of atmospheric particle-bound trace metals is crucial in determining their health effects by inhalation. Recent literature data show increased toxicity of particles
with decreasing size.10,11
As discussed by Valavanidis et al.,12 the PM
2.5 and PM10
levels in urban atmospheres are mainly related to traffic-pollutants (both diesel and gasoline vehicles) while coarse particles contain crustal material, and resuspended road
dust.13,14The authors reported that 90% of metals in TSP,
PM10 and PM2.5 fractions, collected in the centre of Athens
(Greece), were Fe, Zn, Pb and Cu attributed to traffic, static combustion and crustal matter. These results are in general agreement with the majority of previously reported data.
Recently, trace elements and metals in the ultrafine and accumulation particulate matter modes were measured near a Southern California freeway with approximately 20% of diesel traffic. Their results confirmed previous studies which showed that the presence of metals in the 18-32 nm is significantly higher when compared to any other sizes
range.15
Table 1. Diesel fuel properties for diesel formulations A, B and C which are currently used in Brazil6
Property Units Values following ASTM E 29 specifications6
Type of Diesel A B C
Sulfur maximum % m/m 1.00 0.50 0.30
Volatility Distillation
50% ºC 245-310 245-310 245-310
80% ºC 370 370 360
Density at 20-24ºC g cm-3 0.82-0.88 0.82-0.88 0.82-0.88
Viscosity 40ºC mm4s-1 1.6-6.0 1.6-6.0 1.6-6.0
Cetane number 40 40 42
Contaminants:
Water and Sediments % (v/v) 0.05 0.05 0.05
Direct diesel engine exhaust particles have also received great attention. Using a diesel engine under various driving condition and diesel from Taiwan, it was
determined16that the emitted concentrations of crustal
elements (such as Al, Ca, Fe, Mg and Si) are much higher than those of anthropogenic elements. Nevertheless, the authors concluded that the contribution of these elements to the ambient environment could be quite significant and different results may be expected for diesel fuel used in other countries.
The goal of this paper is to determine diesel buses emissions of metals in particulate matter, under typical conditions of operation in a bus station, which is poorly ventilated and where the buses move at low speed and park for passenger access. Results are limited since they are strongly affected by vehicle’s operating conditions and the quality of diesel fuel. Due to instrumental limitations,
only TSP and the PM10 fraction were studied.
Experimental Method
Sampling site
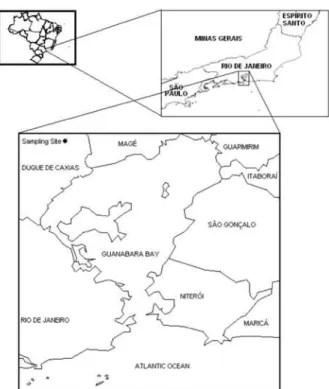
Samples were collected in Mayor José Carlos Lacerda bus station, placed in Centenário Quarter, in the city of Duque de Caxias (Figure 1). The city occupies an area of
468.3 km2 and has a population of about 842,890 inhabitants
distributed in forty Quarters and four Districts.17 The total
number of vehicles in the city is about 160,000. Presently, 64.7% of vehicles use gasohol (gasoline with 24% of ethanol), 11.7% use neat ethanol, 12.3% use compressed natural gas (CNG), 2.5% are flex-fueled cars (gasohol and
ethanol) and 8.8% use diesel.4 The city has about 3,000
buses and 690 micro-buses.
The bus station region is a residential area with reduced commercial activity and no industries. The station has one
floor (10,621 m2) with 8 platforms for arrivals and departures
of urban heavy-duty diesel buses. Each platform has capacity for four buses. Besides movements of arrivals and departures, many vehicles that are waiting for departure keep their motors on. The station makes the confluence for 181 buses from 14 bus lines coming from all other districts of Duque de Caxias (6) and other cities of the Metropolitan Region of Rio de Janeiro (8). The samplers were installed beside one of the platforms at a height of 2 m. The flux of buses is higher during the morning and in the evening. In those periods, the departure interval between buses is nearly five minutes and the frequency of leaving buses in the bus station is less than one minute. Since light duty cars represent about 1-2% of the total flux, buses are the only significant emission sources. Moreover, no other activities are developed in the location and its surroundings, and no other possible significative sources may be considered. In particular, there are no fast-food restaurants in the area near the platforms.
The bus station has a paved platform and is covered by a roof. Since the sides are opened and the roof is about 10 m high, it is a well ventilated area.
Sampling
The selection of the points and the sampling procedure took into account the U.S. Environmental Protection
Agency18 (EPA) recommendations.
Samplings were performed, in Mayor José Carlos Lacerda bus station on week days using 6 h sampling periods of time (from 6:00 am to midday). No samplings were performed in the afternoon and at night because the main goal of this work was to identify typical emissions of diesel-powered vehicles. It was not the objective of this study to assess comparisons such as rush-to-non-rush hours or daytime-to-nighttime periods. Furthermore, these comparisons should have been useful to qualify clearly diesel burning but experiments at night were not possible to be performed because of security reasons and availability of the equipment.
TSP and PM10 were collected using high volume
samplers (Sibata, model HVC500) and borosilicate glass microfiber filters (Sibata, diameter of 110 mm, thickness
of 0.22 µm). The flow rate was aspiration of 500 L min-1.
A total of 66 samples (33 TSP and 33 PM10 respectively) were collected, on week days, from August 2006 to February 2007.
Extraction procedure and analysis
Levels of TSP and PM10 were determined by
gravimetry.19-21 For analysis of trace metals, the same
procedure of our previous studies was followed.19-21 Filters
were extracted by adding 5 mL of nitric acid (Merck
Suprapur® 65%), 2 mL of hydrochloric acid (Merck
Suprapur® 36%) and 10 mL of ultrapure water (18 M
Ωcm-1
of specific resistivity) in a Pyrex™ tube and let still for
2 h at 95oC in a heating plate.22,23 The extracted solution
was filtered by using a Whatman no 41 (WH1441-110)
filter, completed to 50 mL with ultrapure water and kept in pre-cleaned polyethylene bottles in the refrigerator until analyses.24,25
Filter and reagent blanks were processed following the same treatment. The metal content of the blanks for Ca, Mg, Mn, Fe, Zn, Cu, Co, Ni, Al, Cd and Pb was less than 5% of samples average content. For Cr, it represented less than 8%.
Metals were determined by inductively coupled plasma optical emission spectroscopy (ICP-OES) following
Method IO-3.4.23
Both, detection limits and accuracy for the method were
determined following Method IO-3.4.23 Detection limits
were computed as three times the standard deviation of the distribution of outputs for ten repeated measurements
of the standard, which contained no metals.26 These limits
were calculated as 80 ng m-3for Al and Cr, 10 ng m-3for
Zn, 8 ng m-3for Fe, Co and Cu, 4 ng m-3for Mn, 2 ng m-3
for Ni, 0.2 ng m-3for Cd and 0.1 ng m-3for Pb.
The accuracy of the method was evaluated using a standard reference material (SRM, 2783 Air particulate on Filter Media-NIST). Three samples of the reference material were determined in triplicate and the results were compared with the concentration reported in the certificate of analysis. The obtained concentrations differed less than 8%. All samples, as well as SRM, were in the range of the reference material (3-8%). All samples and SRM were determined in triplicate and a difference lower than 1% was considered acceptable.
Statistical analysis
Experimental data were analysed by calculating the Spearman’s correlation coefficients using STATISTICA 6.0 (Stat soft) programme. Also principal component analysis (PCA) and cluster analysis (CA), using Euclidian distances
and Ward’s Method, were performed, as a classification and ordination method.
Results and Discussion
Particulate matter
TSP levels, determined by gravimetry, were in the
range of 177.6 to 524.2 µg m-3. The mean concentration
for all samples (n=33) was 335.9 µg m-3. Similarly, values
for PM10 (n=33) ranged from 38.6 to 120.6 µg m-3, with a
mean value of 74.6 µg m-3.
The ratios PM10/TSP were in the range 0.11 to 0.65
with an average value of 0.24. Literature data27,28 show
that most diesel exhaust particle mass is associated with accumulation mode particles, ranging from 0.05 to 0.7 µm and centered at about 0.02 µm. The coarse mode (1-10 µm) accounts for 5-20% of diesel exhaust particle mass, containing accumulation mode particles that have been deposited on cylinder and exhaust system surfaces and are
later reentrined. Since in this work only the TSP and PM10
fractions were studied and clearly the fraction of diameter > 10 µm is the most abundant, the main contribution to the studied particulate matter in the bus station is the resuspension of dust.
Levels of trace metals
Twelve metals were studied in TSP and PM10 samples:
Ca, Mg, Mn, Fe, Zn, Cu, Co, Ni, Al, Cd, Cr and Pb. Table 2 shows the mean concentrations as well as standard derivation, minimum and maximum for Ca, Mg, Fe, Zn, Cu and Al which were determined in all samples. Ca, Mg and Fe were the most abundant elements and accounted for about 50.1%, 24.2%, 6.5% and 18.7% of the total metal content.
This result agrees with Wang et al.16 who reported
that Al, Ca, Fe, Mg and Si (not determined in the present study) accounted for about 80% of the total metal content in diesel fuel and in the exhaust of a diesel engine. Aerosol samples from the exhaust of a diesel motor car, in the size range 0.1-2.5 µm, determined by total reflection X-ray fluorescence presented considerable amounts of Si, Ca,
Al, Fe, Zn and Mg.29
Also, Lough et al.30 reported that the most abundant
elements determined in PM10 in two tunnels in Milwaukee,
USA, were Fe, Ca, Si, Na, Mg, Al, S and K, which
accounted for an average of 94% of the total PM10 content
of 42 measured elements. They were also present in PM2.5
in much lower amounts and were significantly different
The pattern observed in the bus station may be attributed to the influence of several sources such as tail pipe emissions from buses, brake wear, tire wear and resuspended dust. Literature results confirm that diesel fuels and lubrificating oils contain significative amounts
of Ca, Mg, Fe and Zn.16,31,32 Lubrificating oils contain trace
amounts of Ti, Mn, Co, Cd and Pb used as additives.31
The exhaust of a 4 cylinders diesel engine, with a rotatory fuel pump and a mechanical injection system was analyzed using the US EPA protocol. The engine
was operated with diesel A,currently used in Brazil. Two
samples, one of TSP and other of PM10,were collected. In
TSP, the following metals were detected: Ca (47%), Mg (23%), Fe (10%), Zn (0.6%), Cu (0.3%) and Al (19%). In
PM10 the following metals were detected: Ca (50%), Mg
(24%), Fe (6.5%), Zn (0.3%), Cu (0.1%) and Al (19%). Mn, Co, Ni, Cd and Pb were under detection limits.
Ca, Mg, Fe and Al are major components of crustal materials and soil and are predominantly attributed to
resuspension of dust.30 It has been previously shown that
the dust resuspended from roadways is enriched with many
elements emitted from anthropogenic sources. The fact that Zn and Cu are present in the samples in higher ratios than those found in crustal materials, while Ca, Mg, Fe and Al are present in lower levels, indicates that these two elements may have important combustion sources and are enriched in the soil (Table 3). It may be noted that, as previously stated, metal-based oil additives containing Zn and Mg, anti-wear agents (Zn based) and detergents (Ca and Mg based) are added to fuels and lubrificating oils, influencing
the sizes of emitted particles and their composition.31
Also, it was reported that brake wear emissions contain significant amounts of metals, including Zn, Cu, Fe and
crustal elements.30,33
Mn, Co, Ni, Cd, Cr and Pb levels were under detection
limits except for a few samples: PM10, one sample presented
129 ng m-3 of Pb, five samples presented concentrations
in the range 1.1-9.7 ng m-3 and another sample contained
6.9 ng m-3 of Ni. For TSP, one sample contained 1.7 ng m-3
of Cd, Ni and Cd is present in batteries. It is worth noting that the extraction procedure, mainly the final sample volume, may have a negative contribution to the detection Table 2. Statistical summary of metal concentrations determined in TSP and PM10. Samples were collected in Mayor José Carlos Lacerda Bus Station in the period of August 2006 to February 2007. Standard deviations (SD), minimum (Min) and maximum (Max) values are also shown
Concentration (ng m-3)
Ca Mg Fe Zn Cu Al
TSP Mean 11907 5754 2597 141 66 4811
(n=33) SD 3581 1784 1849 110 178 1815
Min 4270 1902 6 0 6 1423
Max 19215 8568 5715 509 1049 8273
PM10 Mean 11145 5361 1446 77 26 4160
(n=33) SD 2648 1545 1625 75 13 1189
Min 4270 1902 218 Udt Udt 1423
Max 15548 7902 5299 313 51 7106
Udt = Under detection limit
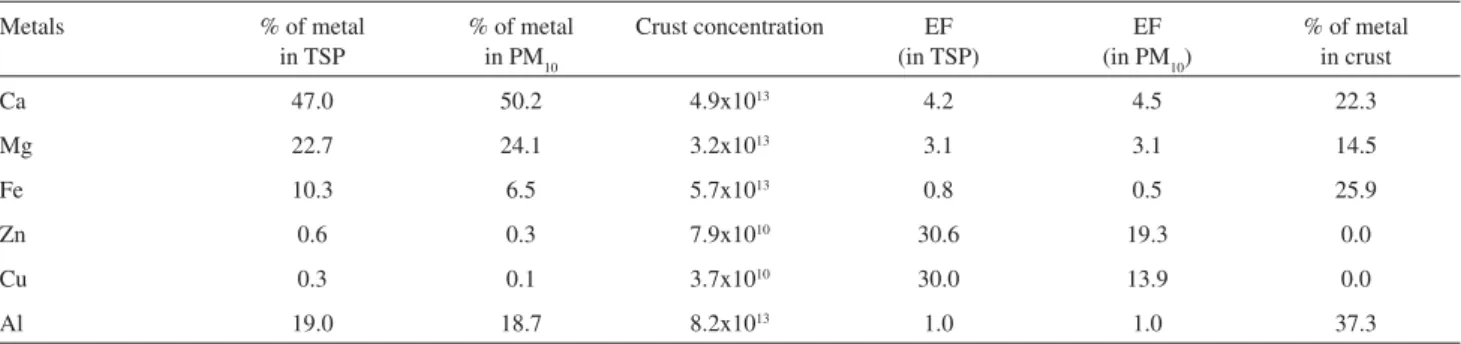
Table 3. Relative concentration of each metal in TSP and PM10samples (first and second columns). Typical crust concentration in units of ng m-3 (third
column) and relative concentration of each metal in the earth’s crust (fourth column). Enrichment factors (EF) for each metal in TSP and PM10 samples (two last columns) calculated using Al as reference
Metals % of metal
in TSP
% of metal in PM10
Crust concentration EF (in TSP)
EF (in PM10)
% of metal in crust
Ca 47.0 50.2 4.9x10¹³ 4.2 4.5 22.3
Mg 22.7 24.1 3.2x10¹³ 3.1 3.1 14.5
Fe 10.3 6.5 5.7x10¹³ 0.8 0.5 25.9
Zn 0.6 0.3 7.9x10¹⁰ 30.6 19.3 0.0
Cu 0.3 0.1 3.7x10¹⁰ 30.0 13.9 0.0
of these metals. Eventually, using smaller volumes, they would be determined in concentrations higher than the detection limit.
Enrichment factors
Enrichment factors (EF) were also calculated using Fe as reference and the expression:
EfX = (X/Ref)air/(X/Ref)crust
The interpretation of EF is based on the fact that metals originated from well defined sources, such as the earth’s crust can be distinguished from other metals derived from
anthropogenic processes.34-36 Since crustal metals are also
present in direct exhausts emissions from the diesel motors, the choice of a reference material is rather difficult.
When using Al as reference, which is traditionally considered a soil tracer, enrichment factors for Zn and Cu in the range from 13.8 to 30.6 are obtained, confirming the possibility of anthropogenic sources.
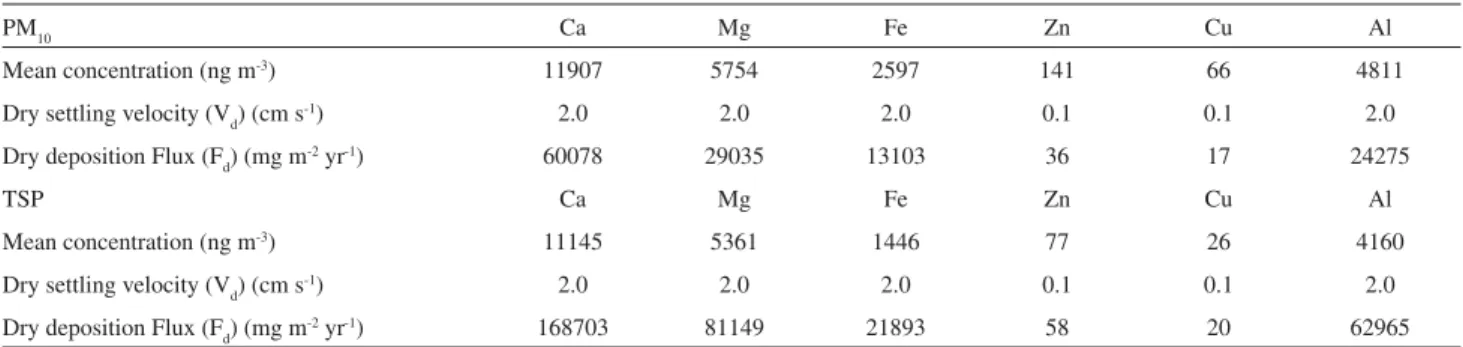
Trace metal dry deposition fluxes
Dry deposition fluxes were calculated using the equation:
Fd= Ci x Vd
where Fd is the dry deposition flux, C
i the trace metal
geometric mean concentration taken from a prolonged
sampling period and Vd is the elemental settling velocity.37
The deposition processes include gravitational settling,
impaction and diffusion,38 which are dependent upon wind
speed, humidity, viscosity and surface roughness. A range of settling velocities have been applied to dry deposition flux calculations in the past, these were determined by a number of approaches including mass-size distributions in the aerosol population, usually evaluated from cascade
impactor data.39-41 For Zn and Cu, a mean value of 0.1 cm s-1
was applied, and for Ca, Mg, Fe and Al a mean value of
2 cm s-1 was adopted. These values fall close to the V
d range
given in other studies42-44 (and references there in). It should
be emphasized, however, that the flux calculations might vary by approximately one order of magnitude due to the uncertainties in Vd.
Calculated values are presented in Table 4. Dry deposition fluxes are higher for Ca, Mg, Al and Fe, in decreasing order, due to their high concentration and settling velocities. Fluxes for Zn and Cu are three orders of magnitude lower.
Statistical analysis
Spearman correlation coefficients, calculated using the individual concentrations (n=33 for TSP and n=33 for
PM10), are presented in Table 5.
Table 4. Estimated trace element dry deposition fluxes in Mayor José Carlos Lacerda Bus Station (Fd). Dry settling velocities (Vd) are literature data34-36
PM10 Ca Mg Fe Zn Cu Al
Mean concentration (ng m-3) 11907 5754 2597 141 66 4811
Dry settling velocity (Vd) (cm s-1) 2.0 2.0 2.0 0.1 0.1 2.0
Dry deposition Flux (Fd) (mg m-2 yr-1) 60078 29035 13103 36 17 24275
TSP Ca Mg Fe Zn Cu Al
Mean concentration (ng m-3) 11145 5361 1446 77 26 4160
Dry settling velocity (Vd) (cm s-1) 2.0 2.0 2.0 0.1 0.1 2.0
Dry deposition Flux (Fd) (mg m-2 yr-1) 168703 81149 21893 58 20 62965
Table 5. Spearman’s correlation factors calculated for metals in TSP and PM10 samples collected of metals in Mayor José Carlos Lacerda Bus Station (significant values at 95% of confidence limit are in bold)
TSP Ca Mg Fe Zn Cu Al
Ca 1.0
Mg 0.95 1.0
Fe 0.65 0.58 1.0
Zn 0.49 0.39 0.79 1.0
Cu –0.33 –0.20 –0.18 –0.16 1.0
Al 0.92 0.88 0.84 0.68 –0.42 1.0
PM10 Ca Mg Fe Zn Cu Al
Ca 1.0
Mg 0.84 1.0
Fe 0.38 0.11 1.0
Zn 0.40 0.18 0.92 1.0
Cu 0.50 0.35 0.69 0.71 1.0
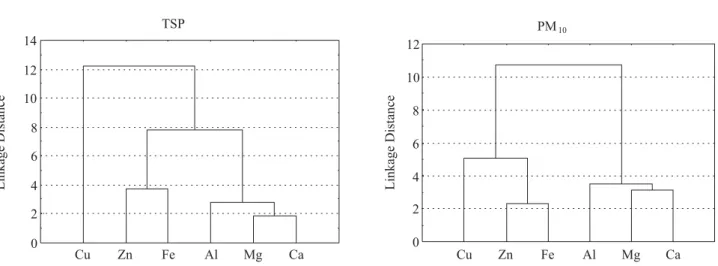
High correlations (0.88-0.92) were obtained for Ca, Mg, Fe and Al in TSP samples. Furthermore, Zn and Fe show a high correlation (0.79) while the value for Zn and Cu is very low. A similar result is shown in Figure 2 in which the cluster analysis is displayed. Al, Mg and Ca are grouped in the same sub-group, as well as Zn and Fe. The five elements are in the same group in the dendogram of Figure 2.
Besides, the principal component analysis shows three groups. Component 1, which accounts for 66.8% of the total variance, contains Fe and Zn. Ca, Mg, and Al are included in component 3 (96.0% of total variance).
Data for PM10 also show a high correlation between
Ca, Mg and Al with Spearman correlation coefficients in the range of 0.79-0.84 (see Table 5). Fe and Zn also show high correlation (0.92) and Zn-Cu has a coefficient of 0.71. These data are consistent with the dendogram displayed in Figure 2: two clusters are obtained, one grouping Cu, Zn and Fe and the other containing Al, Mg and Ca.
Principal components analysis leads to two factors: factor 1, (which represents 65.6% of variance) groups Fe, Zn and Cu, and factor 2 contains Ca, Mg and Al accounts for 89.9% of total variance.
When comparing TSP and PM10 data, it can be seen
that Ca, Mg and Al are highly correlated in both particulate matter fractions. As previously stated, they are major components of crustal materials and are indicative of the significant contribution of dust resuspension to particulate matter contribution.
As suggested by the enrichment factors, Zn and Cu, which may have an important anthropogenic contribution,
only show a good correlation in PM10. Fe also shows a good
correlation with Zn, manly in PM10. These results may
be explained considering that it was reported that brake emissions contain significant amounts of metals, including
Zn, Cu, Fe and crustal elements.30,33
Conclusions
The results of this study showed that diesel vehicles significantly contribute to the emissions of Ca, Mg, Zn and Cu. The pattern observed may be attributed to the contribution of several sources such as tail pipe emissions, brake wear, tire wear and resuspended dust. The analysis of the exhaust of a diesel motor confirmed that these metals are emitted by diesel combustion. Oil additive also contains trace quantities of these metals, while brake wear emissions contain significant amounts of Zn, Cu and crustal elements.
Due to instrumental limitations, only the TSP and PM10
fractions were determined but, clearly, the characterization of trace metals in the fine and ultrafine ranges is important due to the toxicological impacts of some of the metals studied.
Acknowledgments
The study was funded in part by National Council for Technological and Scientific Development (CNPq) and Research Foundation of the State of Rio de Janeiro (FAPERJ). We would like to thank the collaboration of LMT, Federal University of Rio de Janeiro, in particular Albino José Kalab Leiroz, Nauberto Rodrigues Pinto, Pedro Paulo Pereira, Pedro Henrique Leite dos Santos, Renan de Souza and Marcos Dufles for providing the facilities to perform the sampling of the diesel motor exhaust, and to Marcos Menezes and Luiz Carlos de Oliveira, FIOCRUZ, for lending the high volume samplers.
References
1. Lev-On, M.; Letavec, C.; Uihlein, J.; Alleman, T.; Lawson, D.; Vertin, K.; Thompson, G.; Gautam, M.; Wayne, W. S.; Zielinska, B.; Sagebiel, J.; Chatterjee, S.; Hallstrom, K.; Journal of Fuels and Lubricants2003,111, 220.
2. http://www.cetesb.sp.gov.br, accessed in August 2007. 3. Miranda, R. M.; Andrade, M. F.; Atmos. Environ.2005,39,
6188.
4. http://www.detran.rj.gov.br, accessed in August 2007. 5. Loureiro, L. N.; MSc Dissertation, Federal University of Rio
de Janeiro, Brazil, 2005. http://www.ppe.ufrj.br/ppe/production/ tesis/lnloureiro.pdf, accessed in November 2007.
6. http:/ www.anp.gov.br, accessed in April 2007.
7. http://www.feema.rj.gov.br/proconve-promot.asp, accessed in March 2008.
8. Carter, J. D.; Ghio, A . J.; Samet, J. M.; Devlin, R. B.; Toxicol. Appl. Pharmacol.1999,146, 180.
9. Ghio, A. J.; Stonehuerner, J.; Dailey, L. A.; Carter, J. D.; Inhalation Toxicol.1999,11, 37.
10. Kreyling, W.G.; Semmler-Behnke, M.; Moller, W.; J. Aerosol Med.2006,19, 74.
11. Karakoti, A. S.; Hench, L. L.; Seal, L.; J. Miner. Metals Mater. Soc.2006,58, 7782.
12. Valavanidis, A.; Fiotakis, K.; Vlahogianni, T.; Bakeas, E. B.; Triantafillaki, S.; Chemosphere 2006,65, 760.
13. Vallius, M.; Janssen, N. A.; Heinrich, J.; Hoek, G.; Ruuskanen, J.; Cyrys, J.; Van Grieken, R.; de Hartog, J. J.; Kreyling, W. G.; Pekkanen, J.; Sci. Total Environ.2005,33, 147.
14. Park, S. S.; Kim, Y. J.; Chemosphere2005,59, 217.
15. Nhtziachristos, L.; Ning, Z.; Geller, M. D.; Sheesley, R. J.; Schauer, J. J.; Sioutas, C.; Atmos. Environ.2007,41, 5684. 16. Wang, Y. F.; Huang, K. L.; Li, C. T.; Mi, H. H.; Luoc, J. H.;
Tsaid, P. J.; Atmos. Environ.2003,37, 4637.
17. http://www.duquedecaxias.rj.gov.br/web/cgi/cgilua.exe/sys/ start.htm, accessed in April 2007.
18. http://www.epa.gov/epaoswer/hazwaste/test/pdfs/3550c.pdf, accessed in July 2006.
19. Quiterio, S. L.; Arbilla, G.; Silva, C. R. S.; Escaleira, V.; Atmos. Environ.2004,38, 32.
20. Quiterio, S. L.; Arbilla, G.; Escaleira, V.; Silva, C. R. S.; Maia L. F. P. G.; Bull. Environ. Contam. Toxicol.2004,72, 916. 21. Loyola, J.; Almeida Junior, P. B.; Quiterio, S. L.; Sousa, C. R.;
Arbilla, G.; Arch. Environ. Contam. Toxicol.2006,51, 93. 22. Fernandez, A. J.; Ternero, M.; Barragán, F. J.; Jiménez, J. C.;
Chemosphere2000,2, 123.
23. Method IO-3.4. Determination of Minerals in Ambient Particulate Matter using Inductively Coupled Plasma (ICP)
Spectroscopy. US EPA, Washington, 1999.
24. Serrano, E.; Beceiro, E. López, P.; Prada, D.; Quim. Anal. (Barcelona)1996,15, 38.
25. Beceiro-Gonzalez, E.; Andrade-Garda, J. M.; Serrano-Velasco, E.; Lopez-Mahía, P.; Sci. Total Environ.1997,196, 131.
26. Boss, C. B.; Fredeen, K. J. Concepts, Instrumentation, and Techniques in Inductively Coupled Plasma Optical Emission
Spectrometry, 2nded, Perkin Elmer Corp: Norwalk, 1999.
27. Zielinska, B.; Exp. Toxicol. Pathol.2005,57, 31. 28. Kittelson, D. B.; J. Aerosol Sci.1998,29, 575.
29. Weber, S.; Hoffmann, P.; Ensling, J.; Dedic, A. N.; Weinbruch, S.; Miehe, G.; Gutlich, P.; Ortner, H. M.; J. Aerosol Sci.2000, 31, 987.
30. Lough, R.G.; Buckley, L. J.; Werner, F. E.; Quinlan, J. A.; Edwards, K. P.; Fish. Oceanogr. 2005,14, 241.
31. Lin, M. C. H.; Ayoko, G. A.; Morawska, L.; Ristovski, Z. D.; Jayaratne, E. R.; Fuel2007,86, 1831.
32. Weckwerth, G.; Atmos. Environ.2001,35, 5525.
33. Garg, B. D.; Cadle, S. H.; Mulawa, P. A.; Groblicki, P. J.; Laroo, C.; Parr, G. A.; Environ. Sci. Technol.2000,34, 4463. 34. Caroli, S.; La Torre, F.; Petrucci, F.; Violante, N.; Element
Speciation in Inorganic Chemistry, Wiley-Interscience: New
York, 1996.
35. Ure, A. M.; Davidson, C. M.; Chemical Speciation in the Environment, Blackie Academic & Professional: London,
1995.
36. Cheng, M. T.; Lin, Y. C.; Chio, C. P.; Wang, C. F.; Kuo, C. Y.; Chemosphere2005,61, 1439.
37. Pereira, P. A. P.; Lopes, W. A.; Carvalho, L. S.; Rocha, G. O.; Bahia, N. C.; Loyola, J.; Quiterio, S. L.; Escaleira, V.; Arbilla, G.; de Andrade, J. B.; Atmos. Environ.2007,41, 7837. 38. Duce, R. A.; Liss, P. S.; Merril, J. T.; Atlas, E. L.; Buat-Menard,
P.; Hickes, B. B.; Miller, J. M.; Prospero, J. M.; Arimoto, R.; Church, T.; M., Ellis, W.; Galloway, J. N.; Hansen, L.; Jickells, T. D.; Knap, A. H.; Reinhardt, K. H.; Schneider, B.; Soudine, A., Tokos, J. J.; Tsunogai, S.; Wollast, R., Zhou, M.; Global Biogeochem. Cycles.1991,5, 193.
39. Dulac, F.; Buat-Menard, P.; Ezat, U.; Melki, S.; Bergametti, G.; Tellus1989,41B, 362.
40. Ottley, C. J.; Harrison, R. M.; Atmos. Environ. 1993, 27A, 685.
41. Spokes, L. J.; Jickells, T. D.; Jarvis, K.; Mar. Chem.2001,76, 319.
42. Herut, B.; Nimmo, M.; Medway, A.; Chester, R.; Krom, M. D.; Atmos. Environ.2001,35, 803.
43. Migon, C.; Journel, B.; Nicolas, E.; Atmos. Environ.1997,31, 889.
44. Rojas, C. M.; Injuk, J.; Van Grieken, R. E.; Laane, R. W.; Atmos. Environ.1993,27A, 251.
Received: July 7, 2008