A
r
ti
c
le
0103 - 5053 $6.00+0.00
*e-mail: [email protected]
Preparation and Characterization of PVA/PASA-PVA/PDDAB Bipolar Membrane
Heriberto Espinoza-Gómez,*,a Lucía Z. Flores-López,b Eduardo Rogel-Hernándezc
and Manuel Martíneza
aFacultad de Ciencias Químicas e Ingeniería, Universidad Autónoma de Baja California,
Calzada Tecnológico 14418, 22348 Tijuana-B.C., México
bCentro de Graduados e Investigación del Instituto Tecnológico de Tijuana, Blvd. Industrial s/n
Tijuana, B.C. México
Membranas bipolares foram preparadas pela junção de membranas de troca catiônica e aniônica. Para a preparação da camada seletiva a cátions, soluções aquosas de PVA [poli(vinil álcool)] e PASA [poli(sódio anatolesulfonato)], em que a razão PVA/PASA foi modificada para o controle da densidade de carga da membrana, foram preparadas para produzir membranas carregadas negativamente. Estas membranas foram tratadas a 100 oC por 45 min e reticuladas em solução
aquosa contendo 10% de Na2SO4, 1,5% de H2SO4 e 0,5% de glutaraldeído, a fim de controlar a quantidade de água no gel das membranas. As camadas seletivas a ânions foram preparadas pela dispersão de uma solução de PVA e PDDAB [poli(brometo de dialildietilamônio)] em DMF, em que a razão PVA/PDDAB foi modificada para o controle da densidade de carga na membrana. A resistência elétrica de membranas bipolares preparadas por esta metodologia aumentou ligeiramente, enquanto a seletividade diminuiu e sua perme-seletividade não mudou com o pós-tratamento ácido ou alcalino.
Bipolar membranes (BMP) were prepared by bonding together separate anion and cation exchange membrane. For the preparation of the cation selective layer, aqueous solution of PVA [poly(vinyl alcohol)], and PASA [poly(anetholesulfonic acid sodium salt)], where the ratio of PVA/PASA was changed for the control of the membrane charge density, were cast for negatively charged membranes. These membranes were annealed at 100 oC for 45 min and cross-linked in
an aqueous solution containing 10% Na2SO4, 1.5% H2SO4, and 0.5% glutaraldehyde in order to
control water content of the gel membranes. The anion selective layers were prepared by dispersing a solution of PVA and PDDAB [poly(diallyldiethylammonium bromide)] in DMF, where the ratio of PVA/PDDAB was changed for the membrane charge density control. The electrical resistance of BMP formed by this methodology was slightly increased while the selectivity decreased, while their permselectivity did not change with the acid or alkaline post-treatment.
Keywords: bipolar membrane, PVA/PASA, PVA/PDDAB, bipolar membrane
characterization
Introduction
The bipolar membrane (BMP) is an ion-exchanging membrane composed of two ion-exchange regions of opposite polarity in series.1,2 BMP consists of a layered
structure involving a cation selective membrane joined to an anion selective membrane. They can be of the sandwich-like structure involving a negatively charge layer, N, and a positive charged layer, P, pressed together.3-5 BMP systems
were considered in the past as simple models for biological systems,6-9 acid and base production,10-15 and treatment of
saltwater effluents.14,16-18 The characterization of BMP has
been carried out for aqueous solutions systems by studying the current-voltage curve,4,19-28 membrane potential,29-33 and
ac impedance spectra.34-39
Bipolar membrane preparation can be formed by laminating (heat-pressing or gluing) an anion exchange membrane and a cation one, back to back; introducing positively charged fix groups and negatively charged ones to different sides of a neutral film, or casting a cation (or anion) exchange polyelectrolyte solution on a commercial anion (or cation) exchange membrane.40 The ideal BMP
good chemical and mechanical stability, long lifetime, and no “balloonig”.40,41
In the laminated BMP, the anion and cation selective layer must not be so close to each other that they can interpenetrate. It seems that the interpenetration might take place in the high resistance bipolar films which are formed by pressing together. It has been speculated that the high electrical resistance of the membrane and the apparent fusion of the two fixed charged regions, could be due to the anion and cation exchange films interpenetrating each other, under the action of the strong electrostatic attractive force between the oppositely charged layers.42 Generally
most of the overpotential for BMP formed by pressing together separate anion and cation selective films appears across the interface.10,42-44
It is evident from the foregoing that the major problem in preparing low resistance BMP which are laminates of conventional anion and cation exchange membrane is to obtain an interface for which the overvoltage is low for currents in the commercial range (ca. 100 mAcm-2). The main objective
of the work described in this paper was the development of a laminated BMP with good chemical stability, high permselectivity, and low electrical resistance.
Experimental
Membrane preparation
Bipolar membranes were prepared by bonding together separate anion and cation exchange films or membranes. The two monopolar membrane of opposite selectivity were fused together in a hydraulic press at 160 oC at a pressure
of 2.76 MPa to form a two ply membrane structure.
Preparation of the cation selective layer
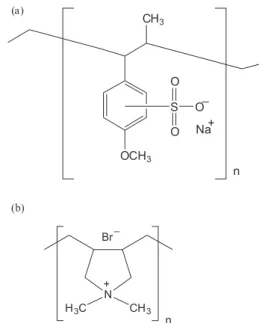
For the preparation of the cation selective layer, aqueous solution of a mixture of poly(vinyl alcohol), (PVA Sigma-Aldrich, Mw 146,000-186,000), and poly(anetholesulfonic acid sodium salt), (PASA, Fluka) (Figure 1), where the ratio of PVA/PASA was changed for the control of the membrane charge density, were cast for negatively charged membranes. These membranes were annealed at 100 oC for 45 min and cross-linked in an
aqueous solution containing 10% Na2SO4, 1.5% H2SO4, and 0.5% glutaraldehyde in order to control water content of the gel membranes.
Preparation of the anion selective layer
The anion selective layers were prepared by dispersing a solution of PVA and poly(diallyldiethylammonium bromide), (PDDAB, Fluka) (Figure 1) in DMF, where
the ratio of PVA/PDDAB was changed for the membrane charge density control.
In both types of membranes, were utilized PAA like copolimer, given their mechanical properties and due to that the difusion coefficients of salt type 1-1 through this polymer, are known.45
Membrane characterization
Membranes prepared by the above described procedures were characterized in terms of their ion-exchange capacity, their electrical resistance, their swelling deionized water, their permselectivity, their water splitting capacity, and their chemical stability.
Determination of the membrane ion-exchange capacities
The ion-exchange capacity of the membranes was determined by titrating the fixed –RSO3 –(RSO3−)
and –R4N+ (−NR 3
+) groups with 0.1 mol L-1 NaOH
or 0.1 mol L-1 HC1, respectively, against methyl red
or phenolphthalein. For these tests, cation- and anion-exchange membranes were equilibrated for 24 h in 1 mol L-1 NaOH or 1 mol L-1 HCI, respectively, and then
rinsed for 3 h with deionized water. The ion-exchange capacity of samples was then determined by titration with 0.1 mol L-1 HCI or 0.1 mol L-1 NaOH, respectively. The
samples were then dried and the ion-exchange capacity calculated for the dry membrane.
Determination of the membrane swelling
To determine the degree of swelling, membrane samples were equilibrated for 3 days in deionized water. After
Figure 1. Chemical structure of the repetitive unit of the polymers utilized.
removing the surface water from the sample, the weight of the wet sample was determined. The sample was then dried at 75 °C over phosphorous pentoxide until a constant weight was obtained. The degree of swelling was determined from the weight difference between the wet (mwet) and dry (mdry) membrane according to equation 1.
mwet– mdry
swelling(%) = –––––––––– x100 (1) mdry
Determination of the membrane electrical resistance
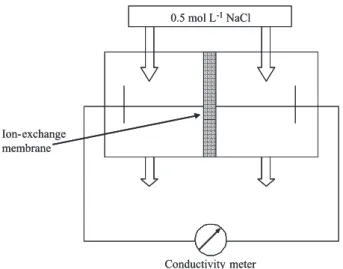
The electrical resistance of the membranes was determined by conductivity measurements in a cell, shown schematically in Figure 2. The cell consists of two well-stirred chambers separated by the membrane sample. The cell is filled with a 0.05 mol L-1 NaC1 solution.
The electrical resistance of the cell was measured with and without a membrane separating the two chambers. The membrane resistance was then calculated from the difference of the two measurements using the equation 2,
Rm = R1 – R2 (2)
where Rm is the area resistance of the membrane per unit area, R1 the total resistance of the cell and the membrane, and R2 the mean resistance of the cell.
Determination of the membrane permselectivity
The permselectivity was determined by a static method, which is illustrated in Figure 3. The actual test system consisted of two cells separated by the membrane sample. The potential difference across the membrane between two solutions of different concentrations was determined using calomel electrodes. The selectivity was then calculated from the ratio of the experimentally determined to the theoretically calculated potential
difference for a 100% permselective membrane. The theoretical potential difference in the system used during this study was 36.94 mV. It was calculated using the following equation 3,
RT M2F2
∆Eth = – –––– ln –––––– (3) F M1f1
where R is the gas constant, T the absolute temperature, F the Faraday constant, Ml and M2 the concentrations (mol L-1) and f
l and f2 the activity coefficients of the two
solutions separated by the membrane.
The permselectivity of the membrane is given by equation 4,
∆Eexp
S = ––––– x100 (4)
∆Eth
where ∆Eexp is the potential difference between the two electrolytes and ∆Eth the theoretical potential difference calculated using equation 3. The membranes were storaged at 60 oC in 2 mol L-1 NaOH and 2 mol L-1 HCl until the
determination of membrane permselectivity.
Determination of the coion fluxes
The schematic diagram to the experiment for determining the flows of Na+ and Cl− ions through a BMP
is indicated on Figure 4. During current flow hydrogen ions were generated at the anode, and were converted to hydrogen gas at the cathode. Also hydrogen ions carried almost the entire current across the cation exchange membrane. Therefore if the BMP had operated at 100% current efficiency, the hydrogen ion and hydroxyl ion concentrations would have remained constant in the measured times. In fact the acidities and alkalinities of the fluids declined with time, as the current efficiencies of the bipolars were less than 100%, there being small leakage flows of Na+ and Cl− coions across the bipolar membrane.
Figure 2. Schematic diagram of the test cell used to determine the
electrical resistance of ion-exchange membranes.
Figure 3. Diagram of the test cell used to determine the permselectivity
These coion flows were estimated by measuring the rates of accumulation of the ions in the various compartments during current flow. In this case, the current was applied until at least 0.006 equiv. of charge had crossed the membrane. The acid and alkalin solutions were then withdrawn from their compartments and analyzed for Na+
and Cl− ions respectively.
Determination of the water splitting capacity of bipolar membranes
The water splitting capacity of the BMP was determined in an electrodialysis stack consisting of 6 individual cells, as indicated in the schematic diagram of Figure 5. The effective membrane area, i.e., the cell cross section, was 100 cm2.
The distance between the two membranes was 0.2 cm. The two cells containing the electrodes were separated from the other cells by cation-exchange membranes and rinsed with a 0.5 mol L-1 Na
2SO4 solution to avoid penetration
of chloride ions to the anode and, thus, the formation of chlorine. A 1 mol L-1 HCl solution was recirculated
through the cells adjacent to the BMP while a 1 mol L-1
NaCl solution was fed into the outside cells. The protons generated in the BMP form hydrochloric acid in the cell at the cation-exchange side of the BMP with the chloride ions permeating the anion-exchange membrane from the 1 mol L-1 NaCl solution in the adjacent cell. Similarly the
hydroxyl ions form sodium hydroxide with the sodium
ions transferred through the cation-exchange membrane from the 1 mol L-1 NaCl feed solution. The concentrations
and, thus, the production of hydrochloric acid and sodium hydroxide were determined by pH measurements.
The current efficiency was calculated from the total current passing through the cell system and the measured acid and base concentrations. The potential drop across the BMP was measured with Pt electrodes as a function of the current density.
Determination of membrane stability
To determine the stability of the membranes at high and low pH values membrane samples were stored for 7 days at 50 °C in solutions of 2 mol L-1 NaOH and
2 mol L-1 HC1, respectively. Furthermore, samples were
dried for 7 days at 75 °C over phosphorous pentoxide and rewetted to determine the effect of drying on membrane performance. Changes in the electrical properties and in visual appearance as compared to the original samples were determined.
Results and Discussion
Membrane ion-exchange capacities
The ion-exchange capacities of the bipolar membrane made are shown on Table 1.
Figure 4. Static cell used for membrane characterization studies (B = bipolar membrane; C = cation exchange membrane).
Figure 5. Cell with recirculating flows used for membrane stability studies (B = bipolar membrane; C = cation exchange membrane; A = anion exchange
The cation-exchange membranes did not show any difference between the initial value (ion-exchange capacities without treatment) and the ion-exchange capacities after two days storage in acid or alkaline solution. On the other hand, the anion-exchange membranes show some differences between the initial values and the ion-exchange capacities after two days storage in acid or alkaline solution. The ion-exchange capacity of a membrane as well as its swelling increased with increasing the basicity of the amine.
Membrane swelling
The determinations of the degree of swelling membrane are summarized on Table 1. For the membrane PVA/PASA, the swelling degree was 12.3%, while for the PVA/PDDAB, the swelling degree was 24.4%, these results are in agreement with the ion-exchange capacities; for the membrane PVA/PASA, the ion-exchange was 0.77 mequiv. g-1 and for PVA/PDDAB, the ion-exchange
capacities was 1.31 mequiv. g-1.
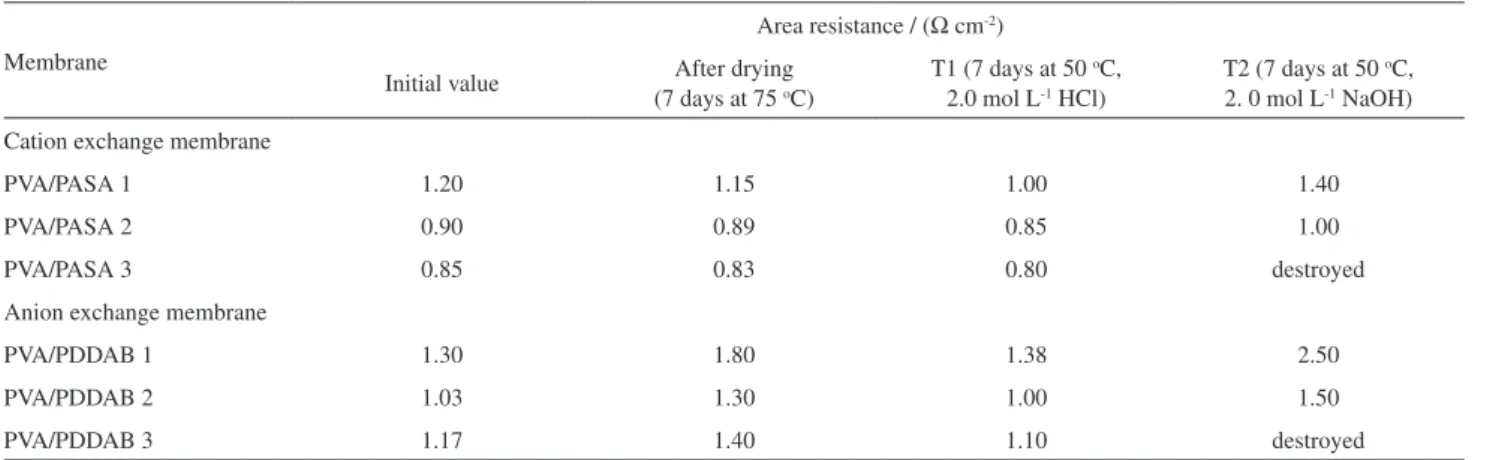
Membrane electrical resistance
The electrical resistance and the permselectivity of the membrane are a function of its ion-exchange capacity. Drying and extensive exposure at 50 oC to 2 mol L-1 HCl
did not have any effect on the electrical properties or the mechanical stability of the membranes (treatment 1, T1); treatment with 2 mol L-1 NaOH at 50 oC also had
little effect on the electrical properties (treatment 2, T2). The electrical resistance is slightly increased and the selectivity decreased (Table 2). Figure 6 gives voltage current measurements in 1 mol L-1 HCl / 1 mol L-1
NaOH for PVA/PASA-PVA/PDDAB BMP with both treatments.
It is seen that the PVA/PASA-PVA/PDDAB T1, has the lower electrical resistance. Nevertheless the other membrane (PVA/PASA-PVA/PDDAB T2) possesses certain advantages. Their current efficiencies are higher than that of the PVA/PASA-PVA/PDDAB T1. After the treatment 2, the PVA/PASA-PVA/PDDAB T2 become destroyed.
Table 1. Properties of cation- and anion-exchange membranes
Membrane Ion exchange
capacity / (mequiv. g-1)
Swelling in deionized water / (%)
Cation exchange membrane
Without treatment 0.77 12.3
Acid treatment (T1) 0.93 13.1
Alkaline treatment (T2) 1.24 15.2
Anion exchange membrane
Without treatment 1.31 24.4
Acid treatment (T1) 0.33 16.9
Alkaline treatment (T2) 0.59 10.8
Table 2. Resistances of cation- and anion-exchange membranes
Membrane
Area resistance / (Ω cm-2)
Initial value After drying (7 days at 75 oC)
T1 (7 days at 50 oC,
2.0 mol L-1 HCl)
T2 (7 days at 50 oC,
2. 0 mol L-1 NaOH)
Cation exchange membrane
PVA/PASA 1 1.20 1.15 1.00 1.40
PVA/PASA 2 0.90 0.89 0.85 1.00
PVA/PASA 3 0.85 0.83 0.80 destroyed
Anion exchange membrane
PVA/PDDAB 1 1.30 1.80 1.38 2.50
PVA/PDDAB 2 1.03 1.30 1.00 1.50
PVA/PDDAB 3 1.17 1.40 1.10 destroyed
Figure 6. Voltage-current characteristics for bipolar membrane in
The decrease in resistance in the PVA/PASA membrane is probably related to a hydration effect, either at the interface of the fixed charge regions or else in the interior of monopolar membrane.
Membrane permselectivity
The membrane permselectivity results are showing in Table 3. The experiments involved the routine testing of PVA/ PASA-PVA/PDDAB BMP which separated 2 mol L-1 NaOH
and 2 mol L-1 HCl solutions, in the static cell of Figure 4,
at a current of 100 mAcm-2. During these experiments we
regularly observed that over a period of 24 h the volume of solution in the acid compartment 1 of the cell would decrease by 1.8-2.2 mL while that in the alkaline compartment would increase by the same reason. Both the volume of water which would have been split in the BMP during this period and the volume which would have entered compartment 2 in the form of hydrogen and hydroxyl ions were about 1.2 mL. Further, there was no significant accumulation of aqueous ions in compartment 1, the hydrogen ions converted to gas at the cathode being compensate for by hydrogen ions entering the compartment from the bipolar membrane. It followed, therefore, that there must have been a net flow of 0.4-0.8 mL of water across the bipolar from the acid compartment 1 to the alkaline compartment 2, and about 1.2 mL across PVA/PASA membrane into alkaline compartment 2. The volume flow across the PVA/PASA membrane corresponds on average to approximately one water molecule for each proton that traversed the PVA/PASA membrane.
Coion flux and current efficiency
Figure 7, gives the flux data for sodium and chloride ions in the case of both PVA/PASA-PVA/PDDAB T1 and T2, membrane for different applied currents at room temperature, when the membrane separated 1 mol L-1 HCl
and 1 mol L-1 NaOH solutions. It is seen that the ionic
fluxes are similar in size for low applied currents but that chloride accounts for an increasing fraction of the coion transport at higher current densities. There is a diffusive flow of the ions across the membrane, at zero current, due to the concentration gradients for the HCl and NaOH.
The data on Figure 7 may be used to calculate the change ion coion flux (∆φi) which results when the current is increased from zero to a value I. These changes can be used to calculate the current efficiency (E) for water splitting,
i.e. the fraction of the applied current which is carried by the ions of water. We have equation 5,
I – F(∆φNa – ∆φCl)
E = –––––––––––––––– x100 (5)
Ι
where F is the Faraday constant. However from a practical viewpoint this definition for current efficiency is not the most useful as it ignores the zero current losses of hydrogen, chloride, hydroxyl and sodium ions from the acid and base compartments. It is more convenient to define an effective current efficiency, E’ (equation 6),
Table 3. Permselectivity values of cation- and anion-exchange membranes
Membrane
Permselectivity / (%)
Initial value After drying (7 days at 75 oC)
T1 (7 days at 50 oC,
2.0 mol L-1 HCl)
T2 (7 days at 50 oC,
2.0 mol L-1 NaOH)
Cation exchange membrane
PVA/PASA 1 59.3 59.5 59.7 50.1
PVA/PASA 2 80.5 83.2 85.1 79.2
PVA/PASA 3 94.2 94.0 93.9 destroyed
Anion exchange membrane
PVA/PDDAB 1 96.6 90.2 88.4 45.5
PVA/PDDAB 2 97.5 89.9 91.2 70.7
PVA/PDDAB 3 97.0 94.8 92.0 destroyed
Figure 7. Fluxes of Na+ and Cl− ions through bipolar membrane at different
current densities. The membrane separated 1 mol L-1 HCl and 1 mol L-1
I – F(φNa – φCl)
E' = –––––––––––––– x100 (6)
Ι
where φNa and φCl are the true fluxes of sodium and chloride through the membrane. The effective current efficiency for the PVA/PASA-PVA/PDDAB T1 is about 1.5% lower than the true current efficiency for the 1 mol L-1 HCl / 1 mol L-1
NaOH case at 100 mAcm-2; and for the
PVA/PASA-PVA/PDDAB T1 is about 2% lower than the true current efficiency for the 1 mol L-1 HCl / 1 mol L-1 NaOH case
at 100 mA cm-2.
Figure 8 gives the effective current efficiency data for the case where the membranes separated 1 mol L-1 HCl
and 1 mol L-1 NaOH solutions at room temperature. The
current efficiency declined with current density from 98% at 100 mAcm-2 to 85%, at 20 mAcm-2 for
PVA/PASA-PVA/PDDAB T1; on the other hand, the current efficiency declined with current density from 96% at 100 mAcm-2 to
88%, at 20 mA cm-2 for PVA/PASA-PVA/PDDAB T2.
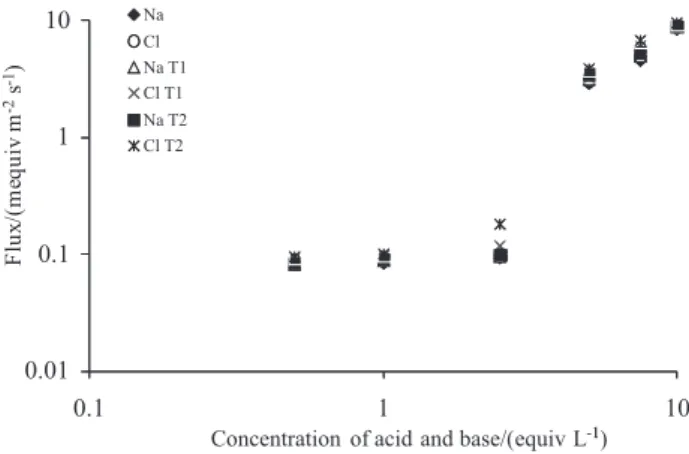
Figure 9 shows the variations in Na+ and Cl− ion fluxes
with external acid and base concentration when the current was 100 mA cm-2. There was a 10 fold increase in the total
coion flux and a decrease in effective current efficiency from 99% to 85% (T1) and 99% to 89% (T2), when the external NaOH and HCl concentrations were raised from 0.5 mol L-1 to 4 mol L-1.
Figure 10 shows the Arrhenius plots of flux vs reciprocal temperature for the 1 mol L-1 HCl / 1 mol L-1 NaOH case at
100 mAcm-2. Increasing the temperature caused an increase
in the coion flux, particularly for Na+ ions. The slopes
correspond to activation energies of 7.4 kcal mol-1 for Na+ and
5.8 kcalmol-1 for Cl− (T1); and for T2, the activation energies
of 7.0 kcal mol-1 for Na+ and 6.1 kcal mol-1 for Cl−.
The membrane appeared to have stable operating characteristics in acids and alkalis solutions for the range of
concentrations that were investigated, i.e. up to 10 mol L-1
NaOH and 6 mol L-1 HCl, provided that there was an applied
electric current. However the performance deteriorated if they separated acid and alkaline solution for an excessive period, without an applied current. For instance the PVA/ PASA-PVA/PDDAB T1 deteriorates in performance if the adjacent compartments contain 2 mol L-1 NaOH and
2 mol L-1 HCl and the current is discontinued for about
60 h. The absence of the β-C atom in the amine, makes this amine less sensitive to hydrolytical degradation. On the other hand, the membranes are stable for at least six months when there is no applied current, it they separate dilutes solutions, i.e. < 0.5 mol L-1 NaCl.
Conclusions
The present report describes the preparation of bipolar membrane in which the separate anion and cation exchange membranes were fused together in a hydraulic press at 160 oC at a pressure of 2.76 MPa to form a two
ply membrane structure. The effects of acid and alkaline
Figure 8. Effective current efficiency (E’) of a bipolar membrane
with and without treatment, at different membrane currents. The membrane separated 1 mol L-1 HCl / 1 mol L-1 NaOH solutions at room
temperature.
Figure 9. Na+ and Cl− ion flux data for different acid/base concentrations
at room temperature. The current density was 100 mA cm-2.
Figure 10. Na+ and Cl− ion fluxes versus reciprocal temperature for
PVA/PASA-PVA/PDDAB T1 and PVA/PASA-PVA/PDDAB T2 bipolar membranes separating 1 mol L-1 HCl / 1 mol L-1 NaOH solutions. The
post-treatment were investigated. The electrical resistance of the bipolar membrane formed by this methodology was slightly increased, while the selectivity decreased. The membrane permselectivity of the bipolar membrane did not change with the acid or alkaline post-treatment. On the other hand, increasing the temperature caused an increase in the Na+ coion flux (activation energy 6.4 kcal mol-1
for T1, 6.0 kcal mol-1 for T2). However, increasing in
the temperature caused a decrease in the Cl1− coion flux
(activation energy 3.8 kcal mol-1 for T1, 5.1 kcalmol-1
for T2). The membranes also have the advantage that the water splitting properties are not altered if the films become dry. Furthermore, they are fairly robust and are simple to produce.
Acknowledgments
Financial support from Consejo Nacional de Ciencia y Tecnología (CONACYT) under the “Apoyo complementario para investigadores en proceso de consolidación SNI 1” is gratefully acknowledged.
References
1. Frilette, V. J.; J. Phys. Chem. 1956, 60, 435.
2. Rose, W. H.; Millar, I. F.; Ind. Eng. Chem. Fundam. 1986, 25, 360.
3. Bassignana, I. C.; Reiss, H.; J. Membr. Sci.1983, 15, 27. 4. Wilhelm, F. G.; van der Vegt, N. F. A.; Strathmann, W. H.;
J. Electroanal. Chem.2001, 502, 152.
5. Wilhelm, F. G.; Pünt, I.; van der Vegt, N. F. A.; Strathmann, W. H.; Wessling, M.; Ind. Eng. Chem. Res. 2002, 41, 579. 6. Mauro, A.; Biophys. J.1962, 2, 179.
7. Costers, H. J. L.; Biophys. J.1965, 5, 669. 8. Simons, R.; Desalination1979, 28, 41.
9. Yokoyama, Y.; Tanioka, A.; Miyasaka, K.; J. Membr. Sci.1988, 38, 223.
10. Bauer, B.; Gerner, F. J.; Strathmann, H.; Desalination1988, 68, 279.
11. Mani, K. H.; Byszcwski, C. H.; Abstract of AIChE Spring National Meeting, Houston TX, USA, 1987.
12. Chiao, Y. C.; Chlanda, F. P.; Mani, K. N.; J. Membr. Sci.1991, 61, 239.
13. Bolton, H. R.; J. Chem. Technol. Biotechnol. 1992, 54, 341. 14. Raucq, D.; Pourcelly, G.; Gavach, C.; Desalination1993, 91,
163.
15. Novalic, S.; Okwor, J.; Kulbe, K. D.; Desalination1996, 105, 277.
16. Mani, K. N.; J. Membr. Sci.1991, 58, 117.
17. Urairi, M.; Tsuru, T.; Nakao, S.; Kimura, S.; J. Membr. Sci.1992, 70, 153.
18. Strathmann, H.; Rapp, H. J.; Bauer, B.; Bell, C. M.; Desalination
1993, 90, 303.
19. Ramirez, P.; Aguilella, V. M.; Manzanares. J. A.; Mafé, S.; J. Membr. Sci.1992, 73, 191.
20. Sokirko, A. V.; Ramirez, P.; Manzanares, J. A.; Mafé, S.; Ber. Bunsen Phys. Chem.1993, 97, 1040.
21. Ramirez, P.; Rapp, H. J.; Mafé, S.; Bauer, B.; J. Electroanal. Chem.1994, 375, 101.
22. El Moussaoui, R.; Pourcelly, G.; Maeck, M.; Hurwitz, H. D.; Gavach, C.; J. Membr. Sci.1994, 90, 283.
23. Aritomi, T.; van der Boomgaard, Th.; Strathmann, H.; Desalination1996, 101, 13.
24. Mafé, S.; Ramirez, P.; Acta Polym.1997, 48, 234.
25. Strathmann, H.; Krol, J. J.; Rapp, H. J.; Eigenberger, G.; J. Membr. Sci.1997, 125, 123.
26. Shimizu, K.; Tanioka, A.; Polymer1977, 38, 5441. 27. Chou, T. J. Tanioka, A.; J. Phys. Chem. B1998, 102, 7866. 28. Chamoulaud, G.; Belanger, D.; J. Colloid Interface Sci.2005,
281, 179.
29. Higuchi, A.; Nakagawa, T.; J. Chem. Soc., Faraday Trans. 1
1989, 85, 3609.
30. Higa, M.; Kira, A.; J. Phys. Chem. B 1995, 99, 5089.
31. Ramírez, P.; Mafé, S.; Manzanares, J. A.; Pellicer, J.; J. Electroanal. Chem.1996, 404, 187.
32. Tanioka, A.; Shimizu, K.; Miyasaka, K.; Zimmer, H. J.; Minoura, N.; Polymer1996, 37, 1883.
33. Higa, M.; Tanioka, A.; Kira, A.; J. Phys. Chem. B1997, 101, 2321.
34. Chilcott, T. C.; Coster, H. G. L.; George, E. P.; J. Membr. Sci.
1995, 100, 77.
35. Chilcott, T. C.; Coster, H. G. L.; George, E. P.; J. Membr. Sci.
1995, 108, 185.
36. Alcaraz, A.; Ramírez, P.; Mafé, S.; Holdik, H.; J. Phys. Chem. B 1996, 100, 15555.
37. Alcaraz, A.; Ramírez, P.; Manzanares, J. A.; Mafé, S.; J. Phys. Chem. B 2001, 105, 11669.
38. Chilcott, T. C.; Chan, M.; Gaedt, L.; Nantawisarakul, T.; Fane, A. G.; Coster, H. G. L.; J. Membr. Sci.2002, 195, 153. 39. Gaedt, L.; Chilcott, T. C.; Chan, M.; Nantawisarakul, T.; Fane,
A. G.; Coster, H. G. L.; J. Membr. Sci.2002, 195, 169. 40. Huang, Ch.; Xu, T.; Environ. Sci. Technol.2006, 40, 5233. 41. Simons, R.; J. Membr. Sci.1993, 82, 65.
42. Simons, R.; J. Membr. Sci.1993, 78, 13. 43. Simons, R.; Electrochim. Acta1984, 29, 151. 44. Simons, R.; Electrochim. Acta1985, 30, 275.
45. Mackie, J. S.; Meares, P.; Proc. R. Soc. London1955, 232, 498A.
Received: September 22, 2008