Article
0103 - 5053 $6.00+0.00
*e-mail: [email protected]
Annual Variation of Total Suspended Particulate and Associated Polycyclic Aromatic
Hydrocarbons in the Tropical City of Niterói, RJ, Brazil
Fernanda de Melo Limaa,b and Annibal D. Pereira Netto*,a,c
aPrograma de Pós Graduação em Química, Instituto de Química, Universidade Federal Fluminense,
Outeiro de São João Batista, s/n, Centro, 24020-141 Niterói-RJ, Brazil
bCentro Federal de Educação Tecnológica de Química, Rua Senador Furtado, 121, Maracanã,
20270-021 Rio de Janeiro-RJ, Brazil
cDepartamento de Química Analítica, Instituto de Química, Universidade Federal Fluminense,
Outeiro de São João Batista, s/n, Centro, 24020-141 Niterói-RJ, Brazil
Este artigo apresenta os resultados da determinação de 12 hidrocarbonetos policíclicos aromáticos (HPAs) em material particulado atmosférico (MPA) coletado na cidade de Niterói, RJ, Brasil. Amostras quinzenais de MPA foram coletadas durante 24 h, entre junho/2005 e maio/2006, no Campus da Universidade Federal Fluminense, localizado em uma área residencial e comercial no Centro de Niterói. Um amostrador de grandes volumes e filtros de fibra de vidro foram usados na coleta de MPA. A concentração média de MPA foi 87 µg m-3. HPAs foram determinados por
cromatografia líquida de alta eficiência e detecção por fluorescência após extração em banho de ultra-som. Os limites de detecção e de quantificação foram suficientemente baixos para permitir a detecção dos HPAs nas faixas de concentração observadas. Boas recuperações foram obtidas pela análise do material certificado SRM 1649a (NIST, USA). Fenantreno, benzo[a]antraceno, benzo[b]fluoranteno e benzo[ghi]perileno foram os HPAs predominantes. As concentrações dos HPAs individuais variaram entre 0,001 (antraceno) e 0,357 (fenantreno) ng m-3. As concentrações
totais de HPAs variaram entre 0,141 e 1,235 ng m-3. As concentrações individuais e totais de HPAs
não apresentaram correlação significativa com a temperatura, umidade relativa e a velocidade do vento. As razões fluoranteno/(fluoranteno + pireno) e benzo[ghi]perileno/indeno[1,2,3-cd]pireno indicaram que a principal fonte de HPAs na área estudada é a emissão veicular.
This paper reports the determination of twelve polycyclic aromatic hydrocarbons (PAHs) in total suspended particulate (TSP) collected in Niterói City, RJ, Brazil. Bimonthly 24 h TSP samples were collected between June/2005 and May/2006 in the Campus of Federal Fluminense University that is located in a mixed residential and commercial neighbourhood in Niterói City Center, Rio de Janeiro State, Brazil. A high volume sampler and glass fibber filters were used to TSP sampling. A mean TSP concentration of 87 µg m-3 was found. PAHs were determined by high-performance liquid
chromatography with fluorescence detection following ultrasonic extraction. Limits of detection and of quantification were sufficiently low to accomplish PAH determination in the observed concentration ranges. Good PAH recoveries were obtained by analysis of SRM 1649a (NIST, USA). Phenanthrene, benzo[a]anthracene, benzo[b]fluoranthene and benzo[ghi]perylene were the predominating PAHs. Individual PAH concentrations varied between 0.001 (anthracene) and 0.357 (phenanthrene) ng m-3.
Total PAH concentrations varied between 0.141 and 1.235 ng m-3. Individual and total PAH
concentrations were not correlated with temperature, relative humidity or wind velocity. The ratios fluoranthene/(fluoranthene + pyrene) and benzo[ghi]perylene/indene[1,2,3-cd]pyrene indicated the main source of PAHs in the studied area was vehicular emission.
Keywords: air pollution, TSP, polycyclic aromatic hydrocarbons, PAH sources
Introduction
Polycyclic aromatic hydrocarbons (PAHs) are ubiquitous persistent pollutants that have been described in all
environmental compartments. Many PAHs are well-known pro-carcinogenic and/or mutagenic compounds that have
been related to several kinds of human cancer.1-3 There are
three major PAH exposure pathways to human beings, i.e.,
inhalation, ingestion of contaminated food and/or water
The sources, formation and fate of PAHs have been
reviewed.3-6 PAHs are distributed between the gaseous
phase and particulate matter of the atmosphere, according
to their vapor pressures and to temperature.7 PAH
concentrations in total suspended particulate (TSP), in suspended particles of different diameters and/or in the gaseous phase have been used to assess air pollution. There are data concerning atmospheric PAHs for many places
and cities of the world,3,8-10 but there are relatively few data
of atmospheric PAHs in South American cities11-13 and in
tropical cities.14 Most of the available data of atmospheric
PAHs of Brazilian cities are restricted to the Megacities of
São Paulo and Rio de Janeiro.15-23 However in the last years,
studies of atmospheric PAHs in Brazilian cities with 1 to
2 million inhabitants were performed.24,25 PAHs have also
been studied in TSP and in street dust in Niterói City, Rio de Janeiro, Brazil.26-29
Vehicular emission of PAHs plays a major role in urban areas and the concentrations of atmospheric PAHs vary
widely during the day according to traffic level.30 Besides
vehicular emission other important sources of PAHs in urban areas include tobacco smoke, waste incineration,
domestic heating and industrial processes or activities.3
Vegetation or forest fires are also sources of concern.31
Vegetation burning during sugarcane harvest is considered an important source of atmospheric PAHs in sugarcane
cultivation areas.24
This work presents the evaluation of twelve PAHs in TSP samples collected during one year in the central area of Niterói, a medium city of Rio de Janeiro State, Brazil that belongs to the metropolitan area of Rio de Janeiro City. This study also partly addresses to fill the lack of data of atmospheric PAHs in medium Brazilian cities and also in tropical cities. It also allows the evaluation of seasonal effects in atmospheric PAH concentrations in a selected tropical area.
Experimental
Chemicals and reagents
A standard solution containing the 16 EPA target PAHs
in concentrations of 0.2 mg mL-1 (AccuStandard, CT,
USA) and solid PAHs from Sigma (MO, USA), Aldrich Chemical Co. (WI, USA) or AccuStandard, (CT, USA) were employed. Hexane, dichloromethane and acetonitrile (all HPLC grade, Tedia, RJ, Brazil) were used. Ultra-pure water was prepared with a Millipore Milli-Q System (MA, USA). Urban particulate matter (SRM 1649, NIST, USA) was used as an external quality control to evaluate PAH recoveries and overall method accuracy and precision.
Site description
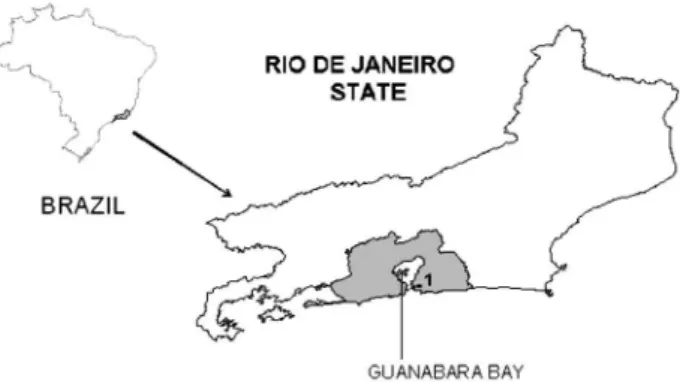
Niterói has around 474,000 inhabitants. It is considered to have a high environmental quality and a high life quality
when compared to other Brazilian cities.32 Niterói is
located in the margins of Guanabara Bay and belongs to the Metrolpolitan Area of Rio de Janeiro City, in Rio de Janeiro State, Brazil (Figure 1).
Sample collection
TSP samples were collected between June/2005 and May/2006 with a mean bimonthly periodicity with glass fibber filters (Pall Corporation, USA) and a high volume sampler (Energética, RJ, Brazil) that was
calibrated and operated according to NBR 954/97.33 TSP
samples were collected in the Valonguinho Campus of Federal Fluminense University that is located in a mixed commercial-residential neighborhood representative of Niterói City Center. Sampling point faced an eleven lane traffic system. Samples were collected in open area 5 meters above ground and around 200 m of Guanabara Bay margin. Sampling always started at 8:00 A.M. and continued during the subsequent 24 h. After sampling, loaded filters were taken to the laboratory, equilibrated and weighted. They were wrapped with aluminum foil and kept inside plastic
bags that were stored in freezer (T = –8 oC) until extraction.
TSP mass was calculated as the difference of filter weights after and before sampling.
Meteorological data
of the university, that is distant around 2 km of the sampling point.
PAH extraction
One quarter of each filter containing TSP samples was cut in small pieces and ultrasonically extracted with dichloromethane (5 steps of 5 mL; 20 min). Combined extracts were concentrated up to 1 mL in rotary evaporator
in temperatures below 40 oC with solvent exchange to
acetonitrile (1 mL). Concentrated extracts were transferred to 2 mL vials and kept in freezer until analysis.
PAH determination
Qualitative and quantitative analysis of PAHs were performed by high-performance liquid chromatography with fluorescence detection (HPLC-Fluo). The HPLC consisted of a quaternary pump, an automated injector, a column oven and a fluorescence detector (all Agilent 1100 Series, USA). Chromatographic conditions (mobile phase composition and flow rate) were optimized in a reverse-phase column (Lichrospher PAH, 5 µm; 250 × 3 mm, Merck, Germany and a guard column (Vydac 201TP54, 2.1 mm; 10 mm). Different proportions of acetonitrile and water were tested to allow the best resolution of PAHs. Separation was achieved using a step-wise binary elution gradient consisting of acetonitrile (A) and water (B). The gradient was as follows: 50% of A held for 10.5 min, increased linearly to 75% of A during 9.5 min, held for 8 min, increased linearly to 90% A during 2.0 min, held for 10 min and decreased to 50% of A during 2 min to allow for equilibration before the following injection.
PAH detection was carried out by programmed excitation and emission wavelengths. Four different emission wavelengths were used to evaluate possible matrix interferences. Quantitative analysis was performed in the excitation and emission maxima.
Naphthalene, acenaphthene, acenaphthylene and fluorene were not evaluated in TSP due to their large vapor pressures. Moreover acenaphthylene shows low fluorescence and as a consequence poor detection by HPLC-Fluo. Calibration was performed with standard
solutions with concentrations between 0.5 and 50 µg L-1.
Analytical curves obtained by least-squares method were also employed to evaluate limits of detection (LOD) and limits of quantification limits (LOQ) according to IUPAC definition. LOD and LOQ were calculated by considering respectively 3 and 10 times the standard deviations of the
less concentrated standard in each analytical curve.38
Results and Discussion
TSP concentrations and meteorological data
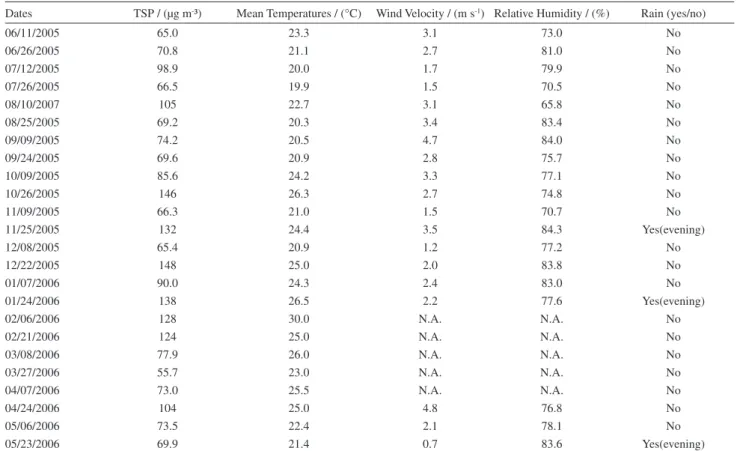
TSP concentrations and meteorological data of the period of study are shown in Table 1. No data of humidity and wind velocity are available for February, March and April, 2006 due to operational problems of the Meteorological Station.
TSP concentrations were always below the primary
standard (240 µg m-3) and the secondary standard
(150 µg m-³) adopted by Brazilian legislation34 that equal
WHO guidelines.35 The annual geometric mean of TSP
was 87 µg m-3 or 9% above the annual primary standard
(80 µg m-3) and 31% above the secondary annual standard
(60 µg m-3).34 The largest TSP concentrations were found
in working days since the sampling point is located near the most important commercial area of Niterói.
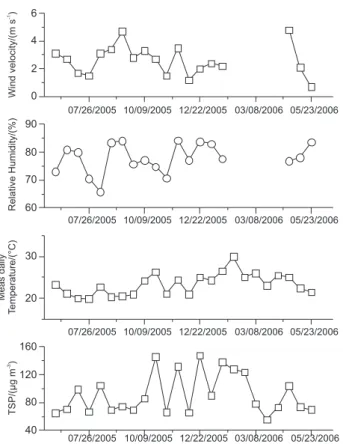
Higher TSP concentrations were observed during summer (Figure 2). The highest concentration of TSP was
observed in December 22nd, 2005 (148 µg m-3) that was
only 1% below the secondary standard level. TSP and temperature showed a significant correlation (R = 0.657; p > 0.95) but the increase of TSP certainly cannot be attributed to only this effect. Poor correlations between
Figure 2. Variation of TSP concentrations (µg m-3) along the period of the
study compared with (a) mean daily temperature (oC); (b) wind velocity
TSP and wind velocity (R = 0.141) and between TSP and humidity (R = 0.138) were found.
The annual geometric mean of TSP observed in Niterói was lower than those found in highly populated Brazilian urban areas but comparable to other medium or
small cities of Rio de Janeiro State.23,36,37 To put our data
into perspective, a comparison of our data with previous TSP data found in Brazilian cities and areas is shown in Figure 3. Data of Figure 3 show that the mean TSP concentration found in Niteroi is comparable to the lowest values previously found in other cities that belong to the
Metropolitan Area of Rio de Janeiro City.37
Concentrations of PAHs associated with TSP
Analytical curves derived by least-square regression method presented excellent correlation coefficients showing the good relationship between fluorescence intensity and concentrations in the studied range (Table 2).
In order to express LOD and LOQ in pg m-3, the mean TSP
concentration (87 µg m-3) and the mean TSP mass (229 mg)
were considered. Adequate LOD, LOQ and correlation coefficients were obtained for all PAHs in the studied range (Table 2). PAH recoveries were evaluated by analysis
of SRM 1649a (NIST, USA) Recoveries varied between 83.9 and 105% except for benzo[a]pyrene that showed a recovery of 64.0% (Table 2).
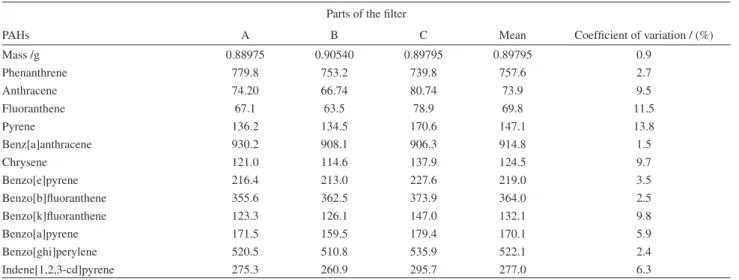
The homogeneity of the loaded filters was also evaluated by independent determinations of PAHs in three
different quarters of the filter collected in June 11th, 2005
(Table 3). Similar PAH concentrations in the three quarters were found indicating that filter loading was uniform. Data of Table 3 also indicate a good overall precision of the method.
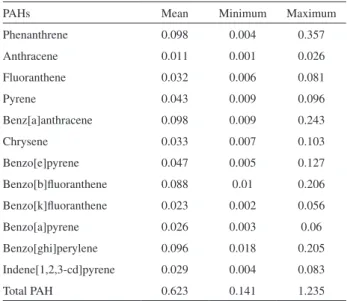
Maximum, minimum and mean concentrations of TSP associated PAH found during the study are shown in Table 4. Phenanthrene, benzo[a]anthracene, benzo[b]fluoranthene and benzo[ghi]perylene were the predominating PAHs. PAH concentrations varied between 0.001 (anthracene) and
0.357 (phenanthrene) ng m-3. These values are comparable
to the lowest values previously found in urban areas.3 They
were lower than many values previously reported for Rio
de Janeiro City,15-17, 19-21 but comparable to the values found
in green areas of Rio de Janeiro21 and São Paulo cities.18
These values are also lower than those found in a previous study in Niterói.26,27 In fact and in respect with Niterói,
the sampling periods (diurnal versus 24 h samples) may
be in part responsible of the observed differences since Table 1. TSP concentrations (µg m-³) and meteorological data of the period of study
Dates TSP / (µg m-³) Mean Temperatures / (°C) Wind Velocity / (m s-1) Relative Humidity / (%) Rain (yes/no)
06/11/2005 65.0 23.3 3.1 73.0 No
06/26/2005 70.8 21.1 2.7 81.0 No
07/12/2005 98.9 20.0 1.7 79.9 No
07/26/2005 66.5 19.9 1.5 70.5 No
08/10/2007 105 22.7 3.1 65.8 No
08/25/2005 69.2 20.3 3.4 83.4 No
09/09/2005 74.2 20.5 4.7 84.0 No
09/24/2005 69.6 20.9 2.8 75.7 No
10/09/2005 85.6 24.2 3.3 77.1 No
10/26/2005 146 26.3 2.7 74.8 No
11/09/2005 66.3 21.0 1.5 70.7 No
11/25/2005 132 24.4 3.5 84.3 Yes(evening)
12/08/2005 65.4 20.9 1.2 77.2 No
12/22/2005 148 25.0 2.0 83.8 No
01/07/2006 90.0 24.3 2.4 83.0 No
01/24/2006 138 26.5 2.2 77.6 Yes(evening)
02/06/2006 128 30.0 N.A. N.A. No
02/21/2006 124 25.0 N.A. N.A. No
03/08/2006 77.9 26.0 N.A. N.A. No
03/27/2006 55.7 23.0 N.A. N.A. No
04/07/2006 73.0 25.5 N.A. N.A. No
04/24/2006 104 25.0 4.8 76.8 No
05/06/2006 73.5 22.4 2.1 78.1 No
05/23/2006 69.9 21.4 0.7 83.6 Yes(evening)
Figure 3. Comparison of mean TSP concentrations (µg m-3) of Niterói and selected cities of Brazil. (a) Quitério et al.36 (b) Quitério et al.37 (c) Vasconcellos
et al.18 (mean values of 3 points) (d) Ré-Poppi and Santiago-Silva24 e) Azevedo et al.21 (mean of 3 points in open areas).
Table 2. Figures of merit of the analytical method
PAHs R² LOD /
(µg L-1)
LOD / (pg m-3)
LOQ / (µg L-1)
LOQ / (pg m-3)
Mean recoveries / (%)a
Phenanthrene 1.000 0.084 0.13 0.28 0.43 88.7 ± 8.4
Anthracene 1.000 0.016 0.024 0.054 0.082 98.8 ± 7.3
Fluoranthene 1.000 0.31 0.47 1.03 1.56 83.8 ± 9.2
Pyrene 0.999 0.093 0.14 0.310 0.47 94.5 ± 8.8
Benz[a]anthracene 1.000 0.49 0.74 1.62 2.47 105.0 ± 8.4
Chrysene 0.999 0.074 0.11 0.25 0.38 84.0 ± 5.1
Benzo[e]pyrene 1.000 0.13 0.19 0.42 0.64 92.8 ± 5.6
Benzo[b]fluoranthene 0.999 0.26 0.40 0.87 1.32 96.5 ± 11.8
Benzo[k]fluoranthene 1.000 0.085 0.13 0.29 0.43 85.3 ± 7.8
Benzo[a]pyrene 1.000 0.14 0.22 0.48 0.73 64.0 ± 4.9
Benzo[g,h.i]perylene 1.000 0.27 0.41 0.91 1.38 88.5 ± 8.4
Indene[1,23-c,d]pyrene 1.000 0.13 0.19 0.42 0.64 93.5 ± 10.4
aFour independent determinations; mean ± standard deviations.
Table 3. PAH concentrations (ng g-1) in each quarter of filter for evaluation of homogeneity of the loading of the filters
Parts of the filter
PAHs A B C Mean Coefficient of variation / (%)
Mass /g 0.88975 0.90540 0.89795 0.89795 0.9
Phenanthrene 779.8 753.2 739.8 757.6 2.7
Anthracene 74.20 66.74 80.74 73.9 9.5
Fluoranthene 67.1 63.5 78.9 69.8 11.5
Pyrene 136.2 134.5 170.6 147.1 13.8
Benz[a]anthracene 930.2 908.1 906.3 914.8 1.5
Chrysene 121.0 114.6 137.9 124.5 9.7
Benzo[e]pyrene 216.4 213.0 227.6 219.0 3.5
Benzo[b]fluoranthene 355.6 362.5 373.9 364.0 2.5
Benzo[k]fluoranthene 123.3 126.1 147.0 132.1 9.8
Benzo[a]pyrene 171.5 159.5 179.4 170.1 5.9
Benzo[ghi]perylene 520.5 510.8 535.9 522.1 2.4
PAH emissions are reduced during night. Other factors to be considered are the different characteristics sampling devices employed in each study and also changes of vehicular fleet.
The variations of total PAH concentrations (ΣPAH) and
of mean daily temperatures during the study are shown in
Figure 4. ΣPAH varied between 0.141 and 1.235 ng m-3.
This range is comparable to the lowest values found in
urban areas.3 No correlation between ΣPAH and mean
temperatures of sampling days was observed (Figure 4)
(R = 0.198) indicating no seasonal variation of ΣPAH. This
fact may be in part due to the relatively low difference of
maximum and minimum mean temperatures (ca. 10 oC)
during the period of study. These results are similar to those previously found in Niterói and Rio de Janeiro
City26,27 and São Paulo City.18 No correlations between
ΣPAH and wind velocity or humidity were also observed.
The less significant correlation between ΣPAH and TSP
(0.332; p > 0.90) may be in part due to the contribution of salt spray to TSP since the samples were collected around 200 m away of Guanabara Bay margin. This way, TSP concentrations may be certainly affected by salt spray that does not contribute to the PAH burden of the samples.
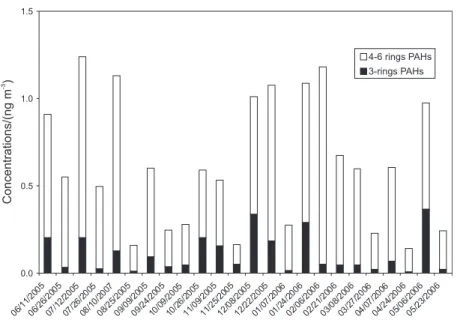
PAH levels were also compared considering the number of rings. This way the sum of tricyclic PAHs concentrations were compared with the sum of concentrations of 4 to 6 rings PAHs. Tricyclic PAHs varied between 0.007 and
0.365 ng m-3 while 4 to 6 rings PAHs that varied between
0.113 to 1.13 ng m-3, predominated in all samples (Figure 5).
Two and three ringed PAHs are generally considered as petrogenic while 4 to 6 rings PAHs are considered pyroltic PAHs and hence our data indicate a predominance of pyrolitic PAHs in the studied area. However this affirmative has to be considered with reserve since some very volatile 2-3 ring PAHs (naphthalene, acenaphthene, acenaphthylene and fluorene) were not evaluated in this study due to several factors as pointed above. This way the sum of 2-3 rings PAHs may be under estimated.
In order to evaluate the major sources of PAHs in the Center of Niterói, the ratios of selected isomeric PAHs were calculated with their mean values obtained during the study. The ratio fluoranthene/(pyrene+fluoranthene) was 0.43 that is in good agreement with the previously value
of 0.43 ± 0.08 reported for vehicular emissions39 and with
the value of 0.37 ± 0.15 reported by Quitério et al.23 that
was also considered indicative of vehicular emissions. This value is also similar to that found in tree bark samples of a
high traffic area of Rio de Janeiro City.40 A ratio benzo[ghi]
perylene/indene[1,2,3-cd]pyrene > 3 is also indicative of Table 4. Maximum, minimum and mean concentrations (ng m-3) of PAHs
in the studied period
PAHs Mean Minimum Maximum
Phenanthrene 0.098 0.004 0.357
Anthracene 0.011 0.001 0.026
Fluoranthene 0.032 0.006 0.081
Pyrene 0.043 0.009 0.096
Benz[a]anthracene 0.098 0.009 0.243
Chrysene 0.033 0.007 0.103
Benzo[e]pyrene 0.047 0.005 0.127
Benzo[b]fluoranthene 0.088 0.01 0.206
Benzo[k]fluoranthene 0.023 0.002 0.056
Benzo[a]pyrene 0.026 0.003 0.06
Benzo[ghi]perylene 0.096 0.018 0.205
Indene[1,2,3-cd]pyrene 0.029 0.004 0.083
Total PAH 0.623 0.141 1.235
Figure 5. Contribution of PAHs according to number of cycles to Total PAH Concentrations. All values are expressed in ng m-3.
vehicular emissions. In this study a value of 3.3 was found for this ratio showing again the importance of this source in the studied area.
Conclusions
Individual and total concentrations of TSP associated PAHs in Niterói, RJ, Brazil showed poor correlations with meteorological parameters such as temperature, wind velocity and relative humidity indicating that they are affected by other factors such as PAH volatility or other variables that are out of control in this study. This fact agrees well with previous findings in tropical and temperate cities.
The calculated ratio fluoranthene/(pyrene+fluoranthene) led to a value equal to that characteristic of vehicular emission, which in this area of Niterói City is certainly the major source of PAHs. Similar results were found with the calculated ratio of benzo[ghi]perylene and indene[1,2,3-cd] pyrene.
Our results indicate also that human exposure to PAHs due to TSP is not of immediate or urgent concern to public health since low concentrations of TSP bound PAHs were found in the center of Niterói City. The concentrations of TSP were also lower than those found in most Brazilian cities and below WHO standards.
Acknowledgments
The authors thank CNPq (Conselho Nacional de Desenvolvimento Científico e Tecnológico), CAPES (Coordenação de Aperfeiçoamento de Pessoal de Nível
Superior) and FINEP (Financiadora de Estudos e Projetos) for grants, fellowships and for financial support of projects that allowed the execution of this work. Prof. Dr. Jorge L. F. de Oliveira of Departament of Geography, UFF is acknowledged for providing meteorological data.
References
1. Boffetta, P.; Jourenkova, N.; Gustavsson, P.; Cancer Causes
Control1997, 8, 444.
2. Pereira Netto, A. D.; Moreira, J. C.; Dias, A. E. X. O.; Arbilla, G.; Ferreira, L. F. V.; Oliveira, A. S.; Barek, J.; Quim. Nova
2000, 23, 765.
3. IPCS-International Programme on Chemical Safety; Selected
Non-Heterocyclic Polycyclic Aromatic Hydrocarbons, World
Health Organization: Geneva, 1998.
4. Baek, S. O.; Field, R. A.; Goldstone, M. E.; Kirk, P. W.; Lester, J. N.; Perry R. A.; Water, Air, Soil Pollut.1991, 60, 279. 5. Bouchez, M.; Blanchet, D.; Haeseler, F.; Vandecasteele, J.-P.;
Rev. Inst. Fr. Pétrole1996, 51, 407.
6. Lopes, W. A.; de Andrade, J. B.; Quim. Nova1996, 19, 497. 7. Valerio, F.; Pala, M.; Fresenius J. Anal. Chem.1991, 339,
777.
8. Alsberg, T.; Strandell, M.; Westerholm, R.; Stenberg, U.;
Environ. Int.1985, 11, 249.
9. Menchini, E.; Sci. Total Environ.1992, 116, 109.
10. Menchini, E.; Bertolaccini, M. A.; Taggi, F.; Falleni, F.; Monfredini, F.; Sci. Total Environ.1999, 241, 27.
11. Catoggio, J. A.; Succar, S. D.; Roca, A. E.; Sci. Total Environ.
1989, 79, 43.
13. Kavouras, I. G.; Lawrence, J.; Koutrakis, P.; Stephanou, E. G.; Oyola, P.; Atmos. Environ.1999, 33, 4977.
14. Panther, B. C.; Hooper, M. A. Tapper, N. J; Atmos. Environ.
1999, 33, 4087.
15. Daisey, J. M.; Miguel, A. H.; de Andrade, J. B.; Pereira, P. A. P; Tanner, R. L.; J. Air Pollut. Control Assoc.1987, 37, 15. 16. Miguel, A. H.; de Andrade, J. B.; Int. J. Environ. Anal. Chem.
1989, 35, 35.
17. Miguel, A. H.; de Andrade, J. B.; Pereira, P. A. P; Aerosol Sci.
Technol.1989, 10, 292.
18. Vasconcellos, P. C.; Zacarias, D.; Pires, M. A. F.; Pool, C. S.; Carvalho, L. R. F.; Atmos. Environ.2003, 37, 3009.
19. Fernandes, M. B.; Brickus, L. S. R.; Moreira, J. C.; Cardoso, J. N.; Rev. Environ. Health1999, 14, 145.
20. Fernandes, M. B.; Brickus, L. S. R.; Moreira, J. C.; Cardoso, J. N.; Chemosphere2002, 47, 417.
21. Azevedo, D. A.; Moreira, L. M.; Siqueira, D. S.; Atmos. Environ.
1999, 33, 4987.
22. Pereira Netto, A. D.; Barreto, R. P.; Moreira, J. C.; Arbilla, G.;
Bull. Environ. Contam. Toxicol.2005, 75, 1004.
23. Quiterio, S. L.; Arbilla, G.; Bauerfeldt, G. F.; Moreira, J. C.;
Water, Air, Soil Pollut.2007, 179, 79.
24. Ré-Poppi, N.; Santiago-Silva, M.; Atmos. Environ.2005, 39, 2839.
25. Dallarosa, J. B.; Monego, J. G.; Teixeira, E. C.; Stefe6ns, J. L.; Wiegand, F.; Atmos. Environ.2005, 39, 1609.
26. Pereira Netto, A. D.; Barreto, R. P.; Moreira, J. C.; Arbilla, G.;
Bull. Environ. Contam. Toxicol.2001, 66, 36.
27. Pereira Netto, A. D.; Barreto, R. P.; Moreira, J. C.; Arbilla, G.;
Bull. Environ. Contam. Toxicol.2002, 69, 173.
28. Pereira Netto, A. D.; Muniz, F. C.; Laurentino, E. C. P. R.; Bull.
Environ. Contam. Toxicol.2002, 68, 831.
29. Pereira Netto, A. D.; Cunha, I. F.; Muniz, F. C.; Rego, E. C. P.;
Bull. Environ. Contam. Toxicol.2004, 72, 829.
30. Nielsen, T.; Atmos. Environ.1996, 30, 3481.
31 Vasconcellos, P. C.; Artaxo, P. E.; Ciccioli, P.; Cecinato, P.; Brancaleoni, E.; Frattoni, M.; Quim. Nova1998, 21, 385. 32. IBGE-Instituto Brasileiro de Geografia e Estatística, 2005;
http://www.ibge.gov.br, accessed in December, 2005. 33. ABNT-Associação Brasileira de Normas Técnicas, NBR
954/97; Material Particulado em Suspensão no Ar Ambiente: Determinação da Concentração Total pelo Método do
Amostrador de Grande Volume, 1997; http://www.abntnet.com.br,
accessed in January, 2006.
34. CONAMA-Comissão Nacional do Meio Ambiente; Padrões
Nacionais de Qualidade do Ar, Resolução CONAMA 003, 1990;
http://www.mma.gov.br/port/conama, accessed in May, 2005. 35. WHO– World Health Organization; Air Quality Guidelines,
Global Update, 2005.
36. Quiterio, S. L.; Escaleira, V.; Souza, C. R. S.; Maia, L. F. P. G.; Arbilla, G.; Bull. Environ. Contam. Toxicol.2004, 72, 916. 37. Quiterio, S. L.; Arbilla, G.; Souza, C. R. S.; Escaleira, V.; Atmos.
Environ.2005, 39, 3504.
38. Miller, J. N.; Miller, J. C.; Statistics for Analytical Chemistry, Ellis Horwood: London, 1993.
39. Sicre, M. A.; Marty, J. C.; Saliot, S.; Aparicio, X.; Grimalt, J.; Albaiges, J.; Atmos. Environ.1987, 21, 2247.
40. Pereira Netto, A. D.; Barreto, R. P.; Moreira, J. C.; Arbilla, G.;
J. Hazard. Mater. 2007, 142, 389.